Abstract
The nasal epithelium is continuously subjected to wall shear stresses (WSS) induced by respiratory airflows. An in vitro experimental model was developed to expose nasal epithelial cells cultured under air-liquid interface conditions to steady airflow-induced WSS. Mucus secretion from epithelial goblet cells was quantified using an enzyme-linked lectinosorbent assay, and modifications of the cytoskeletal structure were qualitatively evaluated from fluorescent stains of actin and β-tubulin fibers. The results show increased mucus secretion from cells subjected to WSS of 0.1 and 1.0 dyne/cm2 for more than 15 min in comparison with unstressed cells. The integrity levels of β-tubulin fibers were significantly lower in cells subjected to WSS than in unstressed cells. The increased mucus secretion in response to WSS was approximately the same in Taxol-free and Taxol-treated cultures, which indicates that there is no direct connection between β-tubulin fragmentation and mucus secretion. The stressed cells regained their normal cytoskeletal appearance 24 h after the exposure to WSS. The results of this study suggest that WSS have an important role in the mechanical regulation of the nasal surface epithelium function.
INTRODUCTION
Nasal defense is based on the mucociliary clearance mechanism. The secreted mucus traps inhaled particles and is constantly driven by the cilia toward the nasopharynx to remove the particles through the digestive system. One major source of mucus secretion is the nasal epithelial goblet cells, which rapidly discharge mucus in response to a wide variety of biological stimuli, including cytokines, bacterial products, proteinases, oxidants, irritant gases, and inflammatory mediators, as well as biophysical changes, such as osmolarity alterations (1–6). The nasal epithelium is continuously subjected to wall shear stresses (WSS) induced by respiratory airflows. However, mucus secretion and cytoskeleton alterations in nasal epithelial cells in response to airflow-induced WSS have not yet been explored.
In the normal nose, air currents are practically laminar. Swirls may be generated due to sharp changes in airway geometry; however, they gradually dissipate as a result of friction, and the main stream remains laminar (7). In vitro simulations of quiet breathing (e.g., 12–17 breaths per minute) with cast models of the nose, into which airflows and dyed water jets were introduced, revealed inspiratory air velocity of ∼2 m/s in the main passage of the nasal cavity and values in the range of 6–18 m/s near the nasal valve (8,9). Time-dependent airflow velocity fields and physical stresses at the air-wall interface in nose-like and anatomical models during quiet breathing were previously investigated using a three-dimensional computational analysis (10). The computed velocity values were in the range of 0–2.5 m/s. The WSS values on the septum of the nose-like model were in the range of 0.5–1.5 dyne/cm2, whereas the values in the anatomical model ranged between 1.0 to 10 dyne/cm2 with a maximal value of 15 dyne/cm2. These values are on the same order of magnitude as WSS in normal uniform regions of large arteries (11).
Mechanical stimuli such as WSS have been shown to affect many cellular processes in almost all living cells, and extensively studied in endothelial cells (12–16). Experiments performed with cultured endothelial cells using either cone-and-plate systems or pressure-driven flow chambers showed that WSS affect cell proliferation, cytoskeleton remodeling, intracellular calcium level, nitric oxide concentration, and other mechanotransduction mechanisms in which ion channels, integrins, and plasma membrane receptors are involved (12,17). Recently, normal and cystic fibrosis human airway epithelial cells were cultured under air-liquid interface (ALI) conditions and mounted on a rotating device that created phasic rotational motions (18). The WSS created by these phasic motions largely increased the airway surface liquid height on top of cultured normal human airway epithelial cells in comparison with cells kept under static conditions.
It has been hypothesized that the dynamic environment in contact with nasal epithelial cells may have a significant mechanical impact on the regulation of cellular processes in the nasal epithelium, and specifically mucus secretion from epithelial goblet cells. In this study, an in vitro experimental model was developed to expose human nasal epithelial cells that were cultured under ALI conditions to steady airflow-induced WSS of values expected to exist in the nasal cavity during quiet breathing. Mucus secretion from epithelial goblet cells was quantified and compared with the results obtained from similar cultures that were kept under static conditions. Modifications of the cells' cytoskeleton morphology and structure were also evaluated to correlate changes in the cytoskeletal structures and mucus secretion.
MATERIALS AND METHODS
The following methodologies were used in this study: 1), culture of human nasal epithelial cells under ALI conditions in a way that allows application of WSS on the cells; 2), exposure of the cells to controlled uniform fields of WSS; 3), quantification of mucus secretion from nasal epithelial goblet cells; and 4), evaluation of modifications in the cytoskeleton structure and morphology.
Cell isolation and culture
Human nasal epithelial cells were isolated from specimens of nasal turbinates of patients undergoing endonasal surgical intervention and cultured under ALI conditions as previously described (19–21). The use of dissected turbinates was approved by the ethics committee of the Sheba Medical Center at Tel Hashomer (approval No. 2788/2002). After incubation of the turbinates in pronase solution, the cells were dissociated from the tissue by scraping. The cell suspension was then centrifuged, washed, and resuspended in a serum-free hormone culture bronchial epithelial growth medium (BEGM) supplemented with 100 U/mL penicillin and 100 μg/mL streptomycin, 50 μg/mL gentamicin, 0.25 μg/mL amphotericin B, 0.6 μg/mL epinephrine, 5 μg/mL insulin, 0.072 μg/mL hydrocortisone, 10 μg/mL transferrin, 25 ng/mL epidermal growth factor, 0.01 μM triiodothyronine, 0.5 μM phosphorylethanolamine, 0.5 μM ethanolamine, 10 μg/mL bovine pituitary extract, 0.5 mg/mL bovine serum albumin (BSA), 3 μM zinc sulfate, stock 4 (1.5 × 10⁻⁶ M ferrous sulfate, 6 × 10⁻⁴ M magnesium, 1.1 × 10⁻⁴ M calcium chloride), trace elements (0.03 μM selenium, 0.001 μM manganese, 0.5 μM silicone, 0.001 μM molybdenum, 0.005 μM vanadium, 0.001 mM nickel sulfate, 0.5 nM tin), and 5 × 10⁻⁸ M retinoic acid. Primary cells were plated in BEGM on collagen-coated tissue culture plastic dishes at a density of 0.5–6 × 10⁶ cells per dish. After 24 h the dishes were washed with phosphate-buffered saline (PBS) and the cells were fed with BEGM. Thereafter, the medium was changed every 2–3 days. When primary cultures reached 70–90% confluence (usually after 4–6 days), the cells were trypsinized, washed, counted, and plated on a collagen-coated Polytetrafluoroethylene (PTFE) porous membrane at density of 100–150 × 103 cells per 0.8 cm2 membrane. The PTFE membrane was mounted in a custom-designed well that was developed for ALI culture (21). The cells seeded in these wells were fed with ALI medium, which is similar to BEGM but contains 50% DMEM-H as the base medium, and the epidermal growth factor concentration is reduced 50-fold. After 2–3 days, the medium from the apical side of the membrane was removed to allow ALI conditions, in which the cells were fed only from the basal part of the membrane whereas the apical side was exposed to 5% carbon dioxide-enriched air.
Custom-designed wells for ALI cultures
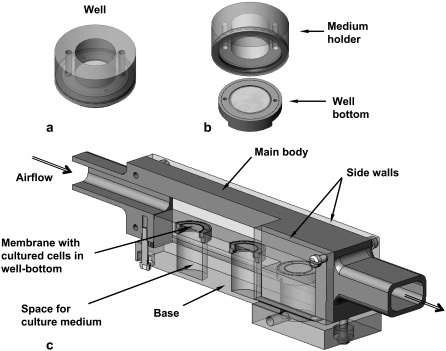
Cell culture under ALI conditions requires special wells (e.g., Millicells; Millipore, Billerica, MA) to create well-differentiated airway epithelial cell cultures, including ciliated and goblet cells (20). In this study we used custom-designed wells that were developed in our lab for ALI culturing of airway epithelial cells (Fig. 1 a) (21). These new wells can be disassembled into subunits, i.e., a medium-holder and a well-bottom (Fig. 1 b). The well-bottom with the cultured cells can then be installed in a flow chamber for application of WSS on the cell surface. Upon completion of a set of experiments, the well can be reassembled for either biological treatments of the cells or for further culture incubation for additional experiments.
FIGURE 1.
(a) Custom-designed well for ALI cultures. (b) The disassembled well. The well-bottom allows application of a planar field of WSS in the flow chamber on the membrane with the cells. (c) Scheme of the flow chamber for exposing ALI cultures to WSS. The flow chamber can hold three well-bottoms. The perspective cross-sectional view shows the membrane on which the cells are seeded in the well-bottom and the space for culture medium.
Flow chamber for application of WSS on ALI cultured cells
A special flow chamber was designed for flow studies with nasal epithelial cells cultured under ALI conditions (Fig. 1 c). The chamber is an 18-cm-long conduit with a rectangular cross-sectional area of 20 mm × 10 mm that can be connected to inlet and outlet tubes. The main body was made of stainless steel and the base and side walls were fabricated from polycarbonate. The base can host up to three well-bottoms in carefully designed holes that are filled with culture medium that is in contact with the inferior plane of the membrane in the well-bottom throughout the experiment. The holes were precisely drilled to ensure that the upper surface of the base was coplanar with the layer of cultured cells, which ensured undisturbed planar airflow over the cells and tight sealing between the air and medium regions. The flow chamber was connected to an air source via a 2-m-long silicon tube of 18 mm inside diameter to ensure fully developed airflow over the cultured cells. The chamber's exit was also connected to a 20-cm-long silicon tube to prevent exit disturbances.
The field of WSS applied on the cells was computed from the inlet airflow rate. For incompressible laminar flow (Reynolds number (Re) < 2000), a finite element computational package (Fluent, Fluent Inc., Lebanon, NH) was implemented for a three-dimensional model of rectangular conduit with rigid walls, to determine the uniform WSS at the bottom of the flow chamber due to a given inlet flow rate. For flow with Re > 2000, the required flow rate for obtaining a specific field of WSS was computed for turbulent flow in a smooth rectangular pipe, as described in the Appendix.
Quantification of mucus secretion
Quantification of mucin secretion was performed using an enzyme-linked lectinosorbent assay (ELLA) that measured the reactivity of glycoproteins equivalent to MUC5B (5). The assay was slightly modified in that it was based on peroxidase-labeled wheat germ agglutinin (WGA) lectin instead of soya-bean agglutinin lectin. Mucin was collected by gently adding 150 μl of PBS to the luminal surface of each culture in the custom-designed wells. After incubation for 15 min at 37°C, all of the apical liquid, including mucin secretions, was collected using a thin tip. MUC5B mucin standards were generously provided by Prof. C. W. Davis, University of North Carolina Cystic Fibrosis Pulmonary Research and Treatment Center. Serial dilutions of 0, 15.6, 31.3, 62.5, 125, 250, 500, and 1000 ng MUC5B per 1 mL PBS were used for the standard curve. The blank samples were prepared using O-Phenylenediamine (OPD, Pierce, Rockford, IL) substrate and 4 M sulfuric acid as detailed below.
Mucin samples were diluted 1:400 in PBS, and 100 μl samples were transferred to a 96-well plate with high binding property and incubated at 37°C for 2 h. The wells were then washed four times with a 200 μl/well solution of 0.05% Tween 20 in PBS (PBST). Later, a 100 μl dilution of 0.5 μg peroxidase-labeled WGA-lectin in 1 mL PBST was added to each well and the plate was incubated for 1 h at 37°C. Four washes of 200 μl/well PBST followed. The color reaction was obtained by adding 150 μl of substrate (40 mg OPD in 100 mL citrate phosphate buffer, spiked with 40 μl 30% hydrogen peroxide) to each well and keeping the wells at room temperature (RT) for 15 min. The reaction was stopped by adding 50 μl 4 M sulfuric acid to each well. The absorbance was read at 490 nm using a microtiter plate reader (SpectraMax 340PC384, Molecular Devices, Sunnyvale, CA). Equivalent MUC5B reactivity was determined from a polynomial curve fitted to the mucin standards measurements.
In this study, we used primary cultured cells isolated from different locations in the nasal cavity and different subjects. Since we do not know the amount of goblet cells that grew in each well, which directly controls the absolute amount of mucin secretion in the culture, we scaled the measured mucin concentration by the concentration of mucins secreted by the same culture over 24 h before the experiment. Accordingly, all cultures were rinsed and all the accumulated mucus was removed from the cells' apical surface 24 h before the flow experiments were conducted. On the following day, right before the beginning of the experiment, the apical 24-h secretion was collected from each culture and the mucin concentration was measured to determine the baseline concentration. Then, a series of flow experiments were conducted for each value of WSS over 5, 15, and 30 min. Each experiment was performed on triplicate cultures. After each experiment, mucin concentration was measured from each stressed culture and normalized with respect to the baseline concentration of mucins in mucus secreted over 24 h from the same specific culture. Mucus secretion results express the mucin concentration percentage of the baseline concentration of each culture. The control for mucus secretion from an unstressed culture was measured ∼30 min after the beginning of the series of flow experiments. This time was selected arbitrarily since the amount of mucus secreted from a static culture within the total duration of a series of flow experiments (i.e., 1 h) did not differ significantly with the specific measurement time.
Analysis of cytoskeleton structural alterations
Immunohistochemical fluorescent stains of β-tubulin and actin filaments were performed to identify morphological and structural changes in the cytoskeleton. Fixation of the cells was performed by incubation in 4% paraformaldehyde for 10 min at RT. Cell membrane perforation was achieved by incubation in a 5% dilution of donkey serum in PBST, for 4–5 h, on a rocker (60 RPM) at RT. β-Tubulin fibers were stained using a 1:500 dilution of mouse monoclonal anti-β-tubulin primary antibody, clone 2.1 (Sigma-Aldrich, Rehovot, Israel). The secondary antibody used was donkey Rhodamine anti-mouse secondary antibody (Jackson Immunoresearch, Suffolk, UK), at a 1:400 dilution. Actin stress fibers were stained with 1:1000 dilution of FITC-labeled Phalloidin in PBS (22). The custom-made wells were mounted in 12-well plate filled with the required liquids both inside and outside of the wells to expose both basal and apical parts of the cells to the liquid. After the stains were completed, the custom-made wells were disassembled and the membranes were mounted on a microscope glass slides.
The cells were examined under a Zeiss 410 confocal microscope using a ×40 magnifying water objective. Changes in the cytoskeletal structure were evaluated from the acquired images by observing an average of 51 cells in each one of 10 fields of 160 μm × 160 μm from every culture under examination. The level of integrity of the β-tubulin fibers and actin filaments of cells in both stressed and unstressed cultures was evaluated by grading the amount of cells, in each field, demonstrating fibers that underwent fragmentation. Three levels of fiber integrity were defined: “good integrity” indicates that <20% of the cells appeared with fragmented fibers, “moderate integrity” means that 20–60% of the cells showed fragmented fibers, and “poor integrity” indicates that more than 60% of the cells in the field were observed with fragmented fibers. Examples of these definitions are demonstrated in Fig. 2 for β-tubulin fibers. For each culture under examination, the number of fields that correspond to a certain integrity level was counted and presented as a percentage of the total number of fields from the same culture.
FIGURE 2.
Examples of the levels of β-tubulin fiber integrity used in this work. (a) Good integrity: <20% of the cells appeared with fragmented fibers. (b) Moderate integrity: 20–60% of the cells showed fragmented fibers. (c) Poor integrity: >60% of the cells in the field were observed with fragmented fibers. Bar = 10 μm.
To test the structure-function interactions between changes in β-tubulin fibers and mucus secretion, we treated cell cultures with Taxol, which is a microtubule stabilizing agent. These cultures were incubated with 10 nM Taxol for 90 min before the WSS experiments. Several of the unstressed control cultures were also treated with Taxol. After application of steady WSS of 1.0 dyne/cm2 for 15 min, mucus secretion was measured and β-tubulin fibers were stained.
Experimental protocol
All of the experiments were performed with well-differentiated cells that had been cultured for 5–10 days under ALI conditions. Each experiment was repeated three times with cells from different subjects. Triplicate cultures of cells from each subject were studied.
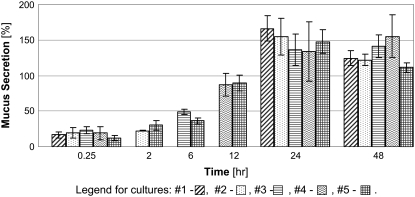
Before the WSS experiments were conducted, mucus secretion was studied under normal static culture conditions to explore regular nonstimulated time-dependent patterns of secretion. In addition, it was important to explore the effect of mucus collection on the secretion. Hence, mucus secretion from five cultures was collected at several time lengths after t0, at which a full 24-h secretion from each culture was collected and mucin concentration was quantified for use in scaling. All of the cultures were measured 15 min after t0, and also 24 and 48 h after t0. Cultures 2, 3, and 4 were also measured 2, 6, and 12 h after t0, respectively, and culture 5 was measured together with all the other cultures, i.e., at t0 and after 15 min and 2, 6, 12, 24, and 48 h.
Steady uniform WSS of 0.1 and 1.0 dyne/cm2 were applied on the cells in the flow chamber for durations of 5, 15, and 30 min. Mucus-secretion measurements and cytoskeleton fiber staining were performed immediately after cessation of the WSS and 24 h later to study recovery processes. To study dehydration effects of WSS on the cells, oscillatory WSS with a peak value of 5 dyne/cm2 were applied on the cells for 5, 15, and 30 min using humidified air (e.g., 40% RH) from a humidity-controlled air chamber. Mucus secretion was measured immediately after the experiment.
Statistical analysis
Mucus secretion results are presented as mean ± SD. Significant levels were calculated using SPSS 10.0.1 software by performing a univariate ANOVA, followed by a Tukey test. A p-value of <0.05 was considered statistically significant.
RESULTS
The computational and analytical analyses that were performed for laminar and turbulent flows, respectively, in the designed flow chamber revealed that steady airflow rates of 12 and 48 L/min generate homogeneous WSS of 0.1 and 1.0 dyne/cm2, respectively, on top of the cells in the flow chamber. Application of WSS of values higher than 1.0 dyne/cm2 resulted in detachment of cells from the membrane, as discussed below.
Mucus secretion in response to repetitive collections
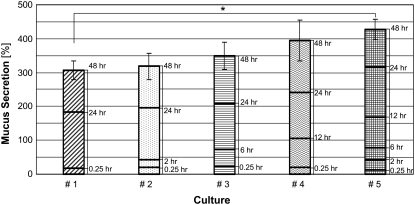
To explore the passive secretion of mucus in response to its extraction for quantification, we measured the secretion after repetitive collections at different times as described above. Representative results for triplicate cultures from one subject are depicted in Fig. 3. Mucus secretion results express the mucin concentration percentage of the baseline concentration, as described above. As expected, the longer the time between two subsequent collections, the higher was the secreted mucin concentration. The accumulative secretions from each culture are presented in Fig. 4. Although there was no significant difference between the accumulative secretions from cultures that underwent three and four collections of mucus, or four and six collections, there was a significant difference between the accumulative secretions from cultures that underwent three and six collections (p < 0.05). Since repetitive mucus collection was shown to induce secretion, all rinsing and mucus collection procedures were identical for all cultures for a single series of experiments.
FIGURE 3.
Mucus secretions from culture lengths that were kept under static conditions for different time lengths. All of the cultures were measured 0.25, 24, and 48 h after the beginning of the experiment. Cultures 2, 3, and 4 were also measured after 2, 6, and 12 h, respectively. Culture 5 was measured together with all the other cultures, i.e., after 15 min and 2, 6, 12, 24, and 48 h. The results are expressed as a percentage of the baseline measurement of each culture, as described in the Materials and Methods section. These results are from a representative experiment and show the same trends as the two other experiments.
FIGURE 4.
Accumulative data for mucus secretion measurements presented in Fig. 3, for cultures kept under static conditions (*p < 0.05).
Mucus secretion in response to WSS
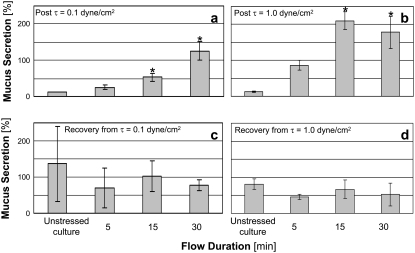
Mucus secretions measured immediately and 24 h after exposure of the cultures to WSS of 0.1 and 1.0 dyne/cm2 are presented in Fig. 5 for a representative series of experiments with triplicate cultures from one subject. The results from different subjects for a specific test (i.e., WSS level and duration) showed large differences (up to 150%) that resulted in high standard deviations with respect to the averages of all subjects. However, each set of results from cultures isolated from a single subject showed the same trends demonstrated in Fig. 5. Exposure of nasal epithelial cells to WSS for more than 15 min resulted in a significant increase in mucus secretion immediately after the stimulus was removed, with respect to the unstressed control cell culture. Insignificant differences in mucus secretion were observed in cultures subjected to WSS of 0.1 and 1.0 dyne/cm2 for the same time durations. Thus, it seems that the duration factor had a stronger influence on mucus secretion than the level of WSS, at least for the range of WSS tested. The secretion measured 24 h after the experiment was not significantly different in stimulated cultures with respect to unstressed control cultures. Mucus secretion was also measured 96 h after the end of a single experiment with WSS value of 1.0 dyne/cm2 (results not shown). The results showed a significant increase in mucus secretion immediately after the exposure to WSS, and an insignificant difference between stimulated and unstimulated cultures 96 h later. The application of oscillatory humidified airflow (i.e., air with 40% RH) for 5, 15, and 30 min resulted in immediate mucus secretions of 69.7%, 149.8%, and 97.5%, respectively, of the baseline concentration of each culture.
FIGURE 5.
Mucus secretions measured immediately after exposure of cultured nasal epithelial cells to WSS of (a) 0.1 dyne/cm2 and (b) 1.0 dyne/cm2, and after 24 h recovery from WSS of (c) 0.1 dyne/cm2 and (d) 1.0 dyne/cm2. The results are expressed as a percentage of the baseline measurement of each culture, as described in the Materials and Methods section (*p < 0.05, with respect to the unstressed control culture).
Cytoskeleton studies
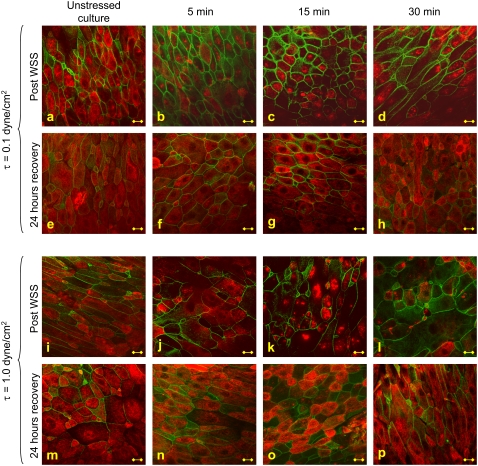
The analysis of cytoskeletal fibers was conducted on 10 fields of 160 μm × 160 μm in each culture under examination. It was notable that the total number of cells in each of these fields of either stimulated or unstimulated cultures did not differ significantly. In addition, the confluency level was high (>90%) in almost all cultures, and did not change significantly between stimulated and unstimulated cultures. Representative images of β-tubulin (red) and actin (green) stains of nasal epithelial cell cultures that were exposed to WSS of 0.1 and 1.0 dyne/cm2 for 5, 15, and 30 min in comparison with unstressed control cultures are presented in Fig. 6. In addition, stains were also performed 24 h after removal of the WSS. The actin integrity level was not significantly different in stressed cultures compared to control cultures, either immediately after exposure to WSS or 24 h after the experiment. The level of β-tubulin integrity was significantly different in the stressed cultures in comparison to the unstimulated ones.
FIGURE 6.
Representative images of β-tubulin (red) and actin (green) fibers stained immediately (a–d, i–l) and 24 h (e–h, m–p) after exposure of the cultures to WSS of 0.1 and 1.0 dyne/cm2 for 5, 15, and 30 min. Bar = 10 μm.
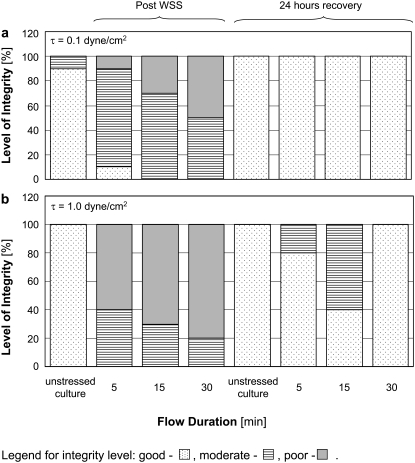
The distribution of the different levels of β-tubulin integrity (Fig. 2) in each of the examined cultures is shown in Fig. 7. It is clearly demonstrated that whereas the unstressed control cultures present a good β-tubulin integrity level in almost all cases, the fibers in cultures exposed to WSS were more affected and presented lower levels of β-tubulin integrity. The β-tubulin fibers of cells exposed to WSS of 1.0 dyne/cm2 (Fig. 7 b) were modified more significantly than those of cells exposed to 0.1 dyne/cm2 (Fig. 7 a), and demonstrated lower levels of β-tubulin integrity. The differences in β-tubulin integrity levels between cultures that were exposed to different flow durations of the same WSS level were less significant than the differences between results from cultures that were subjected to different WSS levels of the same duration. A recovery process of all cultures was observed 24 h after the experiment, as all of the cultures demonstrated improved β-tubulin integrity, although not all of the cultures that were subjected to WSS of 1.0 dyne/cm2 regained their initial good β-tubulin integrity level.
FIGURE 7.
Level of integrity of β-tubulin fibers in cultures exposed to (a) 0.1 dyne/cm2 and (b) 1.0 dyne/cm2. The results are from a representative experiment and show the same trends as the two other experiments. Dotted bars represent good integrity, horizontal lines bars represent moderate integrity, and gray bars represent poor integrity.
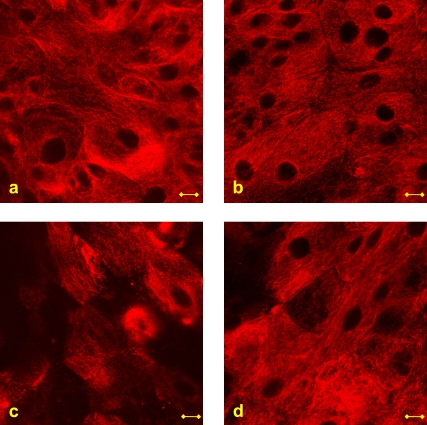
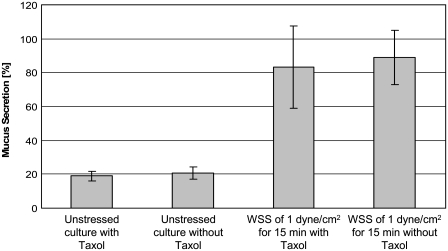
To test whether changes in β-tubulin integrity affect mucus secretion, we treated unstressed and stressed cell cultures with Taxol (Fig. 8). The stabilizing effect of Taxol on the β-tubulin fibers was very clear in both unstressed (Fig. 8 b) and stressed (Fig. 8 d) cultures, in that the flow did not cause as much fragmentation of the fibers as it did in the Taxol-free culture (Fig. 8 c). Mucus secretions from stressed and unstressed cultures with and without Taxol treatment are shown in Fig. 9. It is noticeable that a similar increase in mucus secretion was measured in both Taxol-free and Taxol-treated cultures that were exposed to WSS. The secretions were also almost identical in unstressed Taxol-free and Taxol-treated cultures.
FIGURE 8.
Images of β-tubulin in (a) unstressed Taxol-free culture, (b) unstressed Taxol-treated culture, (c) stressed Taxol-free culture, and (d) stressed Taxol-treated culture. The stressed cultures were exposed to WSS of 1.0 dyne/cm2 for 15 min. Bar = 10 μm.
FIGURE 9.
Mucus secretions measured in unstressed Taxol-free and Taxol-treated cultures in comparison with Taxol-free and Taxol-treated cultures that were exposed to WSS of 1.0 dyne/cm2 for 15 min. The results are expressed as a percentage of the baseline measurement of each culture, as described in the Materials and Methods section.
DISCUSSION
This work investigated the effects of WSS on the functional and structural properties of ALI cultured human nasal epithelial cells. Mucus secretion, attributed to cultured goblet cells, was shown to increase significantly immediately after exposure to WSS for durations longer than 15 min compared to unstressed control cultures (Fig. 5). These results are in good accordance with the outcomes of a study in which the airway surface liquid of normal human airway epithelial cells was doubled in cultures subjected to rotational WSS that characterize tidal breathing (18,23). In the current study, mucus secretion was found to be influenced more by the time length of exposure to WSS than by the level of WSS. Cytoskeletal β-tubulin fibers were shown to be significantly affected by WSS (Figs. 6 and 7). All cultures that were exposed to WSS of 1.0 dyne/cm2 demonstrated lower levels of β-tubulin integrity (i.e., were more affected) than the cultures exposed to 0.1 dyne/cm2 (Fig. 7), and the differences between various WSS durations were not as influential. An examination of the cells 24 h after WSS experiments revealed insignificant differences between mucus secretions from stressed and unstressed cultures, and an almost complete recovery of β-tubulin fibers.
The high variability in mucin secretions from different cultures (see Fig. 3, for example) may be related to the different numbers of goblet cells in each culture. Thus, mucin concentrations for each culture were normalized as described in the Materials and Methods section. In addition, it should be noted that mucus secretion from the unstressed control cultures was measured ∼30 min after the beginning of a 1-h series of experiments. It was shown for static cultures that even a 2-h period between subsequent measurements of secretion does not result in a significant difference. Only longer periods of time between subsequent measurements resulted in significantly different mucin concentrations (Fig. 3).
The results depicted in Fig. 5 clearly show that the duration parameter has more influence on mucus secretion than the level of WSS. Accordingly, it can be suggested that the increase in mucus secretion after exposure to WSS is a result of dehydration of the culture surface, which initiates the process of surface liquid regulation by mucus secretion to moisten the surface. To eliminate the dehydration effects of WSS on the cells, WSS with peak value of 5 dyne/cm2 were generated by 40% RH humidified air and applied on the cells for time periods of 5, 15, and 30 min. Mucus secretion measured immediately after the experiment showed increased mucin concentrations with a maximal value of 149.8% of the baseline concentration, which was obtained after 15 min of flow. Exposure of the cells to airflow with a humidity level that characterizes a comfortable environment resulted in increased mucin secretion immediately after the experiment, just as much as using air supplied from the air source in all other experiments described here. This suggests that the mechanical aspects of airflow—and not the dehydration aspects—were responsible for the increase in mucus secretion, at least for air humidity of a comfortable environment (i.e., 40% RH). The importance of the time length during which the cells were exposed to WSS might be explained by energy transfer considerations. The external energy of the momentum (i.e., force × time) applied by the WSS on the apical surface of the cells is transferred to the cytoskeleton through some kind of mechanotransduction mechanism and is balanced by the internal stresses and deformations of the fibers. The results of this study suggest that absorption of this energy inside the cell is expressed by fragmentation of the cytoskeletal fibers, specifically β-tubulin fibers.
Mucus secretion from nasal goblet cells participates in several functional roles of nasal breathing, including regulation of the temperature and humidity of inspired air. Accordingly, its regulation is a very complex process that is influenced by several biological and chemical factors. In this study we propose that mucus secretion is also influenced by mechanical factors, i.e., apical WSS. It was previously suggested that the nose is rich in mechanoreceptors (24); however, a comprehensive investigation of their microstructure is still required. It has been suggested that the mechanical environment induced by airflow in the nasal cavity has certain clinical implications; for example, it is possible that chronic tension headache is related to high shear stress at specific points of the nasal cavity (however, this is still controversial) (25).
Immunofluorescent staining assays were used to investigate changes in cytoskeletal structure and morphology. To ensure consistency of the staining procedure between different cultures and different experiments, we performed several preliminary tests to optimize the protocols of staining, confocal microscopy, and imaging. We repeated each experiment three times and the consistency of the staining results was very high. In the current study we did not observe cell alignment with respect to the flow direction, as is known to occur in endothelial cells that have been exposed to fluid WSS. This difference may be related to the fact that we cultured the nasal epithelial cells on semipermeable membranes, whereas in most studies with endothelial cells the cell were cultured on plastic or glass plates. It is known that integrins have an important role in the adhesion of cultured cells to the substrate, and thus different responses may be observed.
Following the experimental protocol of this work, staining of cytoskeletal fibers was performed immediately and 24 h after exposure to WSS. Thus, we observed recovery of the β-tubulin fibers after 24 h. In a previous study, we observed recovery of fragmented microtubule structures in cultured endothelial cells 4 h after exposure to therapeutic ultrasound irradiation (26). Actin fibers were also modified significantly and a recovery process of actin was observed after 24 h. Accordingly, it is possible that the recovery process of β-tubulin fibers occurred earlier than 24 h after the exposure to WSS; however, this was not tested in this study.
It was previously reported that actin microfilaments of the cytoskeleton are involved in agonist-induced mucus secretion from airway surface goblet cells. This complex process involves interactions of dephosphorylated myristoylated alanine-rich C kinase substrate (MARCKS) with actin and myosin to link mucin granules to the intracellular contractile apparatus, which is able to move them through the cell cytoplasm toward the apical membrane (27). Moreover, actin filaments have been shown to maintain a barrier in mucus secretion from intestinal goblet cells by hindering mucin granule access to the plasma membrane (28). In this study we did not observe significant differences in actin integrity between stimulated and unstimulated cultures. However, the increase in mucus secretion due to WSS was coupled with a significant decrease in β-tubulin integrity. Microtubules are well known for having an important role in vesicular transport in cells in general (29), and specifically in polarized epithelial cells (30,31). Moreover, studies with melanocytes, exocrine, endocrine, and hematopoietic cells have shown that the movement of mature secretory granules from the trans Golgi region to the cell periphery is along microtubules (32). However, this has not yet been investigated in goblet cells. When WSS were applied on cultures treated with the microtubule-stabilizing agent Taxol, mucus secretion was not affected. The secretions were also almost identical in unstressed Taxol-free and Taxol-treated cultures. Thus, it is suggested that there is no direct influence of β-tubulin fragmentation on mucus secretion. It should be noted that β-tubulin fibers undergo structural changes due to WSS without permanently damaging the cells, as implied by the almost complete recovery of the fibers 24 h after removal of the WSS. This suggests that the cells go through some kind of a structural remodeling process in response to WSS, which may lead to changes in the cell shape or orientation that allow different physical or chemical interactions or pathways that might regulate many cellular processes other than mucus secretion.
In this study the cells were exposed to steady uniform fields of WSS, whereas physiological airflow is time-dependent. For example, the time gradient for WSS on the septum of a nose-like model during quiet inspiration was previously computed to be as high as 5 dyne/cm2s, emphasizing the airflow aspect of unsteadiness (10). Several studies have shown that time-dependent WSS on blood vessel walls, which are induced by blood pulsatile flow, affect the function and phenotype of endothelial cells (33,34). This time dependency probably holds true in the respiratory system as well, as the time constants for mucus secretion due to secretagogues ligand binding are known to be very short, i.e., tens of milliseconds (27). The fast secretion of mucus has an important role in lung defense. Thus, it can be assumed that airway goblet cells can sense and respond very quickly to extracellular stimulations, whether biochemical or mechanical, and hence it can be suggested that the application of dynamic mechanical stimuli on nasal epithelial cells will result in somewhat different responses than those of cells exposed to steady stimuli.
The existing data on WSS at the air-wall interface of the nasal cavity rely mostly on computational analyses, since measurements of velocity inside the human nose interfere with the physiological flow. In computational models, specific nose geometries are considered, whereas the biological variability in nose geometry among different subjects is considerably high. Since the velocity fields and the resultant WSS are directly related to the nose geometry, these can also vary significantly. The maximal value of WSS applied here was 1.0 dyne/cm2, which is in the same order of magnitude as WSS computed by Elad et al. (10) for both nose-like and anatomical models. When we attempted to apply higher WSS values, cells began to detach from the membrane. A possible reason for that is that the flow and the resultant WSS were unidirectional. This issue can be addressed by applying bidirectional oscillating airflow on the cells, in a manner similar to respiratory airflows. This type of flow may generate deformations in opposite directions, which will result in very small net deformations and no accumulative deformation toward one direction. Another possible solution for preventing cell detachment is to use a different type of membrane as a substrate for cell cultures. The use of collagen coating as a substrate for ALI cultures was shown to be very efficient for biological studies that do not involve the application of mechanical forces on the cells (35). However, for biomechanical studies it may be essential to culture cells on substrates that enable stronger attachment of the cells. These may be generated by coating synthetic filters with biological or synthetic adhesion materials, or by using biological membranes.
In addition to subjecting the cells to oscillating WSS, another way to achieve a more physiological in vitro model of the nasal epithelial environment would be to provide air with temperature and humidity levels of different environments. It is known, for example, that microtubule assembly and disassembly are dependent on temperature (29). Subjecting the cells to more physiological conditions would eliminate the possibility that some of the cell responses do not directly relate to WSS.
In conclusion, to our knowledge, this is the first time that human nasal epithelial cells have been subjected to airflow-induced WSS that mimic physiological stresses during nasal breathing. Nasal epithelial cells respond both functionally and structurally to respiratory WSS. Mucus secretion was increased in cells subjected to WSS of 0.1 and 1.0 dyne/cm2 for more than 15 min with respect to unstressed control cultures. The secretion levels were directly related to the time duration of the WSS application. The integrity levels of β-tubulin fibers were significantly lower in cells subjected to WSS than in unstressed cells. The cells regained their normal cytoskeletal appearance 24 h after exposure to WSS, indicating that no permanent damage was caused to the cells by the WSS. Stabilizing the β-tubulin fibers by Taxol did not affect the levels of mucus secretion post application of WSS. The results of this study suggest that WSS have an important role in the mechanical regulation of the nasal surface epithelium function.
Acknowledgments
The authors thank Prof. Scott Randell and Prof. C. William Davis from the University of North Carolina, Chapel Hill, N.C., for useful advice regarding nasal epithelial cell culture and mucin quantification assays. We also thank Dr. Roni Haklai from the Department of Neurobiochemistry, Faculty of Life Sciences, Tel Aviv University, Tel Aviv, Israel, for help with cell culture and microscopy.
APPENDIX: EVALUATION OF STEADY WSS DUE TO TURBULENT AIRFLOW IN A RECTANGULAR CONDUIT
The steady WSS developed in a rectangular smooth conduit due to turbulent flow (Re > 2000) with a cross-sectional average velocity  were determined by a force balance calculation over a conduit section of length L. For a rectangular cross-sectional area with dimensions a × b, the shear forces are balanced by the pressure forces at the ends, thus
 |
(1) |
where τ0 is the shear stress at the conduit walls, and ΔP is the pressure drop at the ends.
The friction low for smooth conduits of rectangular cross-sectional area is (36)
 |
(2) |
where λ is a dimensionless coefficient of resistance, ρ = 1.12 kg/m3 is the air density, and Dh is the hydraulic diameter:
 |
(3) |
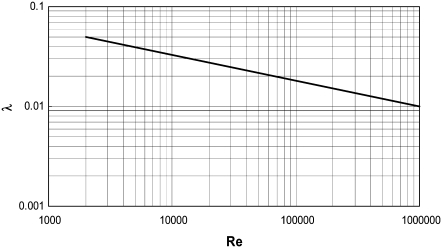
The coefficient of resistance, λ, was estimated from a diagram (Fig. 10), reproduced from experimental data measured in smooth rectangular cross-sectional area conduits (36).
FIGURE 10.
Resistance coefficient (λ) as a function of Re for a smooth rectangular pipe. Reproduced from Schlichting (36).
Substitution of Eqs. 2 and 3 in Eq. 1 yields the WSS:
 |
(4) |
The required airflow for generating a specific field of WSS was calculated iteratively as follows: a value for an average velocity  was assumed and the corresponding Re number was calculated. Then the coefficient of resistance, λ, was extracted from the diagram in Fig. 10, the value of WSS was calculated from Eq. 4 and compared with the required value of WSS, and
  was corrected to calculate a new Re number. The iterations were completed when the desired value of WSS was achieved. Thereafter, the required airflow rate was calculated by multiplying the flow-chamber cross-sectional area ab by the average velocity
  of the last iteration. Table 1 summarizes the required airflow rates for generating WSS in the range of 0.5–1.4 dynes/cm2, for a rectangular conduit of a = 0.02 m and b = 0.01 m.
TABLE 1.
Steady airflow rates required to generate WSS in the range of 0.5–1.4 dynes/cm2 at the bottom wall of a rectangular pipe of 20 mm × 10 mm cross-sectional area
 (m/s) (m/s) |
Re | λ | τ (dyne/cm2) | Q(L/min) |
|---|---|---|---|---|
| 2.5 | 1961 | 0.054 | 0.5 | 30 |
| 3 | 2353 | 0.048 | 0.6 | 36 |
| 4 | 3137 | 0.044 | 1.0 | 48 |
| 5 | 3922 | 0.04 | 1.4 | 60 |
Editor: Denis Wirtz.
References
- 1.Spicer, S. S., and J. R. Martinez. 1984. Mucin biosynthesis and secretion in the respiratory tract. Environ. Health Perspect. 55:193–204. [DOI] [PMC free article] [PubMed] [Google Scholar]
- 2.Kim, K. C., J. Nassiri, and J. S. Brody. 1989. Mechanisms of airway goblet cell mucin release: studies with cultured tracheal surface epithelial cells. Am. J. Respir. Cell Mol. Biol. 1:137–143. [DOI] [PubMed] [Google Scholar]
- 3.Kim, K. C. 1991. Biochemistry and pharmacology of mucin-like glycoproteins produced by cultured airway epithelial cells. Exp. Lung Res. 17:533–545. [DOI] [PubMed] [Google Scholar]
- 4.Rogers, D. F. 1994. Airway goblet cells: responsive and adaptable front-line defenders. Eur. Respir. J. 7:1690–1708. [PubMed] [Google Scholar]
- 5.Abdullah, L., S. W. Davis, L. Burch, M. Yamauchi, S. H. Randell, P. Nettesheim, and C. W. Davis. 1996. P2u purinoceptor regulation of mucin secretion in SPOC1 cells, a goblet cell line from the airways. Biochem. J. 316:943–951. [DOI] [PMC free article] [PubMed] [Google Scholar]
- 6.Davis, C. W., and L. H. Abdullah. 1997. In vitro models for airways mucin secretion. Pulm. Pharmacol. Ther. 10:45–55. [DOI] [PubMed] [Google Scholar]
- 7.Uddstromer, M. 1940. Nasal respiration. Acta Otolaryngol. 42 (Suppl): 3–146. [Google Scholar]
- 8.Proctor, D. F. 1966. Airborne disease and the upper respiratory tract. Bacteriol. Rev. 30:498–513. [DOI] [PMC free article] [PubMed] [Google Scholar]
- 9.Proctor, D. F. 1977. The upper airways: nasal physiology and defense of the lungs. Am. Rev. Respir. Dis. 115:97–129. [DOI] [PubMed] [Google Scholar]
- 10.Elad, D., S. Naftali, M. Rosenfeld, and M. Wolf. 2006. Physical stresses at the air-wall interface of the human nasal cavity during breating. J. Appl. Physiol. 100:1003–1010. [DOI] [PubMed] [Google Scholar]
- 11.Ku, D. N. 1997. Blood flow in arteries. Annu. Rev. Fluid Mech. 29:399–434. [Google Scholar]
- 12.Davis, F. D. 1995. Flow-mediated endothelial mechanotransduction. Physiol. Rev. 75:519–560. [DOI] [PMC free article] [PubMed] [Google Scholar]
- 13.Resnick, N., and M. A. Gimbrone. 1995. Hemodynamic forces are complex regulators of endothelial gene expression. FASEB J. 9:874–882. [DOI] [PubMed] [Google Scholar]
- 14.Brown, T. D. 2000. Techniques for mechanical stimulation of cells in vitro: a review. J. Biomech. 33:3–14. [DOI] [PubMed] [Google Scholar]
- 15.Geiger, B., A. Bershadsky, R. Pankov, and K. M. Yamada. 2001. Transmembrane crosstalk between the extracellular matrix–cytoskeleton crosstalk. Nat. Rev. Mol. Cell Biol. 2:793–805. [DOI] [PubMed] [Google Scholar]
- 16.Apodaca, G. 2002. Modulation of membrane traffic by mechanical stimuli. Am. J. Physiol. Renal Physiol. 282:F179–F190. [DOI] [PubMed] [Google Scholar]
- 17.Huang, H., R. D. Kamm, and R. T. Lee. 2004. Cell mechanics and mechanotransduction: pathways, probes, and physiology. Am. J. Physiol. Cell Physiol. 287:C1–C11. [DOI] [PubMed] [Google Scholar]
- 18.Tarran, R., B. Button, M. Picher, A. M. Paradiso, C. M. Ribeiro, E. R. Lazarowski, L. Zhang, P. L. Collins, R. J. Pickles, J. J. Fredberg, and R. C. Boucher. 2005. Normal and cystic fibrosis airway surface liquid homeostasis. The effects of phasic shear stress and viral infections. J. Biol. Chem. 280:35751–35759. [DOI] [PMC free article] [PubMed] [Google Scholar]
- 19.Randell, S. H., D. L. Walstad. U. E., Schwab, B. R. Grubb, and J. R. Yankaskas. 2001. Isolation and culture of airway epithelial cells from chronically infected human lungs. In Vitro Cell. Dev. Biol. Anim. 37:480–489. [DOI] [PubMed] [Google Scholar]
- 20.Fulcher, M. L., S. Gabriel, K. A. Burns, J. R. Yankaskas, and S. H. Randell. 2005. Well-differentiated human airway epithelial cell cultures. Methods Mol. Med. 107:183–206. [DOI] [PubMed] [Google Scholar]
- 21.Even-Tzur, N., D. Elad, U. Zaretsky, S. H. Randell, R. Haklai, and M. Wolf. 2006. Custom-designed wells and flow chamber for exposing air-liquid interface cultures to wall shear stress. Ann. Biomed. Eng. 34:1890–1895. [DOI] [PubMed] [Google Scholar]
- 22.Werner, U., and T. Kissel. 1996. In-vitro cell culture models of the nasal epithelium: a comparative histochemical investigation of their suitability for drug transport studies. Pharm. Res. 13:978–988. [DOI] [PubMed] [Google Scholar]
- 23.Randell, S. H., and R. C. Boucher. 2006. Effective mucus clearance is essential for respiratory health. Am. J. Respir. Cell Mol. Biol. 35:20–28. [DOI] [PMC free article] [PubMed] [Google Scholar]
- 24.Clarke, R. W., and A. S. Jones. 1995. Nasal airflow sensation. Clin. Otolaryngol. Allied. Sci. 20:97–99. [DOI] [PubMed] [Google Scholar]
- 25.Bieger-Farhan, A. K., J. Nichani, and D. J. Willatt. 2004. Nasal septal mucosal contact points: associated symptoms and sinus CT scan scoring. Clin. Otolaryngol. Allied. Sci. 29:165–168. [DOI] [PubMed] [Google Scholar]
- 26.Raz, D., U. Zaretsky, S. Einav, and D. Elad. 2005. Cellular alterations in cultured endothelial cells exposed to therapeutic ultrasound irradiation. Endothelium. 12:201–213. [DOI] [PubMed] [Google Scholar]
- 27.Rogers, D. F. 2003. The airway goblet cell. Int. J. Biochem. Cell Biol. 35:1–6. [DOI] [PubMed] [Google Scholar]
- 28.Oliver, M. G., and R. D. Specian. 1990. Cytoskeleton of intestinal goblet cells: role of actin filaments in baseline secretion. Am. J. Physiol. 259:G991–G997. [DOI] [PubMed] [Google Scholar]
- 29.Lodish, H., D. Baltimore, A. Berk, S. L. Zipursky, P. Matsudaira, and J. Darnell. 1997. Molecular Cell Biology. Scientific American, New York.
- 30.Saunders, C., and L. E. Limbird. 1997. Disruption of microtubules reveals two independent apical targeting mechanisms for G-protein-coupled receptors in polarized renal epithelial cells. J. Biol. Chem. 272:19035–19045. [DOI] [PubMed] [Google Scholar]
- 31.Kreitzer, G., J. Schmoranzer, S. H. Low, X. Li, Y. Gan, T. Weimbs, S. M. Simon, and E. Rodriguez-Boulan. 2003. Three-dimensional analysis of post-Golgi carrier exocytosis in epithelial cells. Nat. Cell Biol. 5:126–136. [DOI] [PubMed] [Google Scholar]
- 32.Davis, C. W., and B. F. Dickey. 2008. Regulated airway goblet cell mucin secretion. Annu. Rev. Physiol. 70:487–512. [DOI] [PubMed] [Google Scholar]
- 33.Malek, A. M., S. L. Alper, and S. Izumo. 1999. Hemodynamic shear stress and its role in atherosclerosis. JAMA. 282:2035–2042. [DOI] [PubMed] [Google Scholar]
- 34.Helmlinger, G., R. V. Geiger, S. Schreck, and R. M. Nerem. 1991. Effects of pulsatile flow on cultured vascular endothelial cell morphology. J. Biomech. Eng. 113:123–131. [DOI] [PubMed] [Google Scholar]
- 35.Wu, R., M. Zhao, and M. M. J. Chang. 1997. Growth and differentiation of conducting airway epithelial cells in culture. Eur. Respir. J. 10:2398–2403. [DOI] [PubMed] [Google Scholar]
- 36.Schlichting, H. 1960. Boundary Layer Theory. McGraw-Hill Book Co., New York.


