

Abstract
Although the role of the T cell-mediated autoimmune reaction in type 1 diabetes (T1D) is conclusive, studies including data from human circulating CD4+ and CD8+ lymphocytes subsets during the disease onset and posterior development are scarce. Further, chemokines and chemokine receptors are key players in the migration of pathogenic T cells into the islets of non-obese diabetic mice developing T1D, but few studies have investigated these markers in human T1D patients. We studied the expression of T helper 1 (Th1)- and Th2-associated chemokine receptors, and the two isoforms of CD45 leucocyte antigen on CD4+ and CD8+ lymphocytes from T1D and healthy children, as well as the secretion of chemokines in cell supernatants in peripheral blood mononuclear cells. Our results showed increased expression of CCR7 and CD45RA and reduced CD45RO on CD8+ cells among recent-onset T1D patients. The percentages of CD4+ cells expressing CXC chemokine receptor 3 (CXCR3), CXCR6 and CCR5, and the secretion of interferon-γ-induced protein-10, monocyte chemoattractant protein-1, macrophage inflammatory protein (MIP)-1α and MIP-1β was lower among diabetics. Low expression of Th1-associated receptors and secretion of chemokines, together with an increased amount of CD8+ cells expressing CD45RA and CCR7 in T1D patients therefore might represent suboptimal Th function in T1D, leading to impaired T cytotoxic responses or alternatively reflect a selective recruitment of Th1 cells into the pancreas.
Keywords: CD4+ T cells, CD8+ T cells, chemokine receptors, chemokines, type 1 diabetes
Introduction
Type 1 diabetes (T1D) is a T cell-mediated autoimmune disease involving both CD4+ T helper (Th) cells and CD8+ cytotoxic T (Tc) cells [1,2]. T cell-mediated beta-cell destruction is induced by the release of molecules, including cytokines and chemokines, but most of the mechanisms resulting in beta-cell destruction remain unclear. Chemokines are important in directing leucocyte migration between blood, lymph nodes and tissues. They constitute a complex signalling network because the chemokines are not always restricted to one type of receptor [3]. Secretion of the ligands for CCR5 receptor, regulated upon activation normal T cell expressed and secreted (RANTES), macrophage inflammatory protein (MIP)-1α/ and MIP-1β[4] and the ligand for CXC chemokine receptor 3 (CXCR3), induced protein (IP)-10 [5] have been associated with Th1 responses. Chemokines have been observed in Th1 pancreatic infiltrates and other inflammatory lesions characterized by T cell infiltration [6,7]. Th1-like cells have also been suggested to synthesize monocyte chemoattractant protein (MCP)-1 [6], while others have shown that the chemokine is a ligand for CCR4 together with MIP-1α[8].
T cell chemokine receptor expression has been studied predominantly in animal models and in in vitro CD4+ cell lines, while ex vivo human lymphocytes, and in particular the cytotoxic CD8+ cells, are less well characterized. Initial studies indicated that their expression was regulated tightly on T cells, with restricted receptor expression on Th cell subsets. Thus, CXCR3, CCR5, CXCR6 and interleukin (IL)-18R were expressed predominantly on Th1-associated cells, whereas CCR4 and CCR8 has been associated with Th2-like cells [9]. In a previous study it was shown that T1D patients had a reduced expression of CXCR3 and CCR5 on CD4+ peripheral blood cells at diagnosis [10]. Increased T cells expressing CXCR3 and CCR5 at inflammatory sites in parallel with low levels in peripheral blood and lymph nodes appeared to indicate that these receptors are key mediators in migration of pathogenic T cells to sites of inflammation [11]. The expression of CCR4 was associated primarily with Th2-like cells [9], but was not only restricted to polarized Th2 cells [12]. In the mouse T1D model, CCR4-expressing cells seems to have a central role in the development of pathogenic autoimmune reactions [13].
Another receptor that has defined Th1 cell subsets is CXCR6, defining subsets of activated memory Th1 and Tc1 cells secreting IFN-γ. High expression of CXCR6+ T cells has been observed at inflammation sites in rheumatoid joints [14]. CCR7 is a homing receptor important in T, B and dendritic cell migration into secondary lymphoid organs [15,16]. More recent studies have described multiple roles of CCR7 [17,18], including induction and maintenance of central and peripheral tolerance [19,20]. Its high-affinity ligand 6Ckine is expressed mainly in lymphoid organs, where it mediates homing of both T and B lymphocytes [16,21]. Based on the expression of the two isoforms of CD45 leucocyte, T cells are often characterized as naive and/or effectors CD45RA+ or memory CD45RO+ cells [22]. In a study including identical twins, increased levels of CD4+CD45RO+ cells was associated with protection from T1D [23].
The role of the chemokines and their receptors in T1D has been described mainly in mouse models, and better understanding of the complex network of chemokines and their receptors, as well as the phenotypic T cell subpopulations, is needed. Thus, this study was aimed to determine the chemokine and chemokine receptor profile in CD4+ and CD8+ T lymphocytes from T1D children during the first 18 months after diagnosis, in comparison with healthy children.
Materials and methods
Study population
Venous blood samples were collected from 54 T1D children (aged 10–18 years; 32 girls, 22 boys) with less than 18 months’ disease duration. The patients were recruited from eight diabetes clinics in Sweden during a time-period of approximately 2 months. None of the patients had signs of infection when sampling. Control subjects were 12 healthy schoolchildren (aged 11–15 years; eight girls, four boys), with no family history of T1D, T2D, coeliac disease, goitre, rheumatoid arthritis, asthma or allergy. The T1D children had a fasting C-peptide level above 0·1 pmol/ml. All the participants received written information and consent was obtained according the Declaration of Helsinki. The study was approved by the Regional Ethics Committee for Human Research, Linköping University Hospital, Sweden.
Isolation of peripheral blood mononuclear cells
Peripheral blood mononuclear cells (PBMC) were all separated from blood samples within 24 h of sampling at the Laboratory of Paediatric Diabetes Research, Diabetes Research Center, Linköping. PBMC were isolated using Ficoll Paque density gradient technique (Pharmacia Biotech, Sollentuna, Sweden) and washed in RPMI-1640 (Gibco, Auckland, New Zealand) containing 2% fetal calf serum. One million PBMC from 44 T1D children and 12 healthy reference children were used for flow cytometry analysis of cell surface receptors. One million PBMC from 54 T1D children and 12 reference children were used for 72-h cell culture.
Flow cytometric detection of cell surface receptors
Peripheral blood mononuclear cells were washed in phosphate-buffered saline (PBS) (Medicago AB, Uppsala, Sweden) containing 0·1% bovine serum albumin (BSA) (Sigma-Aldrich, St Louis, MO, USA) and stained with antibodies for flow cytometry. Cells were incubated for 30 min at 4°C in darkness with the antibodies: fluorescein isothiocyanate-conjugated anti-CXCR3, CCR7 (R&D Systems, Minneapolis, MN, USA), CCR5 (PharMingen, San Diego, CA, USA), CD45RA and CCR8 (BD Biosciences, San Jose, CA, USA); phycoerythrin (PE)-conjugated anti-IL-18R, CXCR6 (R&D Systems), IL-12Rβ2, CCR4 (PharMingen) and CD45RO (BD Biosciences); peridinin chlorophyll (PerCP)-conjugated anti-CD8 and allophycocyanin-conjugated anti-CD4 (BD Biosciences). After incubation cells were washed and resuspended in PBS + 0·1% BSA and kept at 4°C in darkness until analysed.
Unstained PBMC and isotype controls were included to estimate amount of autofluorescence and non-specific binding respectively. Cells stained with single antibodies marked with different fluorochromes were used for compensation to adjust for spectrally adjacent dye pairs. Four-colour flow cytometry was performed with a Becton Dickinson fluorescence activated cell sorter (FACSCalibur) (San Diego, CA, USA). Approximately 1 × 10⁴ PBMC were acquired for unstained lymphocytes, isotype and compensation, while 2 × 10⁴ PBMC were acquired for analysis of cell surface receptors. Data were analysed using the CellQuest program (Becton Dickinson Immunocytometry Systems, San Diego, CA, USA). Lymphocytes were gated according to forward- and side-scatter. Results are expressed in percentage of cells expressing each surface molecule.
In vitro culture of PBMC
One million PBMC were cultured in AIM V research-grade serum-free medium (Invitrogen, Carlsbad, CA, USA) supplemented with β-mercaptoethanol (Sigma, Stockholm, Sweden). Cell supernatants were harvested after 72 h culture and frozen at −70°C until analysed.
Detection of chemokines in cell supernatant
Secretion of the chemokines IP-10, MCP-1, MIP-1α, -1β and RANTES were analysed in cell supernatants with Luminex 100 (Luminex Corp, TX, USA) using Bio-Plex™ Cytokine Reagent Kit and human cytokine 5-plex panel (Bio-Rad Laboratories, CA, USA), according to the manufacturer's recommendation. Briefly, 50 µl of sample, standard, blank and colour-coded beads were added to a 96-well microtitre plate. Samples were run in single wells (standards and blank in duplicate). After incubation for 30 min at room temperature (RT) and washing with a vacuum device, 25 µl of biotinylated detection antibody mixture was added and the plate was incubated for another 30 min at RT. After washing, 50 µl streptavidin–PE was added and the plate was incubated for a final 10 min and washed thereafter. The beads were resuspended in 125 µl assay buffer before analysing the samples. Identification and quantification of each chemokine were based on bead colour and fluorescence. Acquisition conditions were set with a minimum of 100 beads per region. Median fluorescence intensity was analysed using Starstation Software version 2·0 (Applied Cytometry Systems, Sheffield, UK) and a five-parameter curve fit was applied to each standard curve in order to obtain sample concentrations.
Secretion of the chemokine 6Ckine in cell supernatants was analysed with Quantikine human CCL21/6Ckine enzyme-linked immunosorbent assay (ELISA) according to the manufacturer's instructions (R&D Systems Europe, Abingdon, UK). Briefly, 100 µl of assay diluent, sample, standard and blank were added to a 96-well microtitre ELISA plate. Samples were run in single wells (standards and blank in duplicate) and the plate was incubated for 2 h at RT on a horizontal orbital shaker. The wells were then washed four times and 200 µl of 6Ckine conjugate was added. The plate was incubated for another 2 h and thereafter washed four times before adding 200 µl substrate solution. The plate was incubated for 20 min at RT, protected from light. Fifty µl of stop solution was added to each well and the optical density was determined within 30 min with a microplate reader set to 450 nm.
Sensitivity of chemokines (pg/ml) analysed by multiplex bead array technique were: 15·04 for IP-10; 1·66 for MCP-1; 0·32 for MIP-1α, 0·47 for MIP-1β? and 0·76 for RANTES respectively. Sensitivity for the analyses of 6Ckine by ELISA was 13·1.
Statistics
As the data were not distributed normally, three or more groups were analysed by Kruskal–Wallis test for unpaired observations and two groups were compared using the Mann–Whitney U-test. Spearman's rank correlation was used for paired non-parametric variables. P-value <0·05 was considered statistically significant. Calculations were made with spss 12.0.1 for Windows (SPSS Inc., Chicago, IL, USA).
Results
Receptor expression on peripheral blood lymphocytes
Receptor expression was quantified by flow cytometry for CD8+ and CD4+ cells from T1D and healthy children. To examine if receptor expression was different at various stage of the disease duration, samples from T1D children were grouped into four categories according to the disease duration at the time of the blood sampling (Table 1).
Table 1.
Characteristics of type 1 diabetes (T1D) and healthy children.
| Type 1 diabetic patients | Healthy controls | ||||
|---|---|---|---|---|---|
| Group A | Group B | Group C | Group D | ||
| Months T1D duration; range (mean) | 0–4 (1·8) | 5–9 (5·8) | 10–14 (12·0) | 15–18 (16·4) | – |
| Age; range (mean) | 11–18 (12) | 12–18 (15) | 10–18 (14) | 12–16 (14) | 11–15 (14) |
| Gender (female/male) | 6/5 | 11/6 | 13/6 | 6/5 | 8/4 |
| Subjects total (n) | 11 | 17 | 19 | 11 | 12 |
| Fasting C-peptide (pmol/ml); median (range) | 0·33 (0·18–0·47) | 0·43 (0·08–0·97) | 0·28 (0·03–0·55) | 0·33 (0·09–0·92) | – |
Cell surface phenotype of CD8+ T cells
Cytotoxic T lymphocytes were defined by their expression of the CD8. Higher percentages of lymphocytes expressing CD8+ CCR7+ were detected in samples from diabetics compared with those from healthy children (Fig. 1a). This was especially true in the group of patients with disease duration of less than 9 months, while in samples from patients with longer disease duration the percentages declined to levels similar to the healthy group (Fig. 1b). Further, CD8+ T cells from diabetics also expressed a higher percentage of CD45RA (Fig. 1c), with the highest percentage in samples from patients with a shorter disease duration. Percentages of CD8+CD45RA+ cells decreased with longer T1D duration to percentages similar to the healthy individuals (Fig. 1d). In contrast, the percentage of CD8+CD45RO+ cells, a phenotype typical of memory T cells, was lower in cells from diabetic individuals (Fig. 1e), and increased with the disease progression, without reaching the same percentages as in the healthy children (Fig. 1f).
Fig. 1.
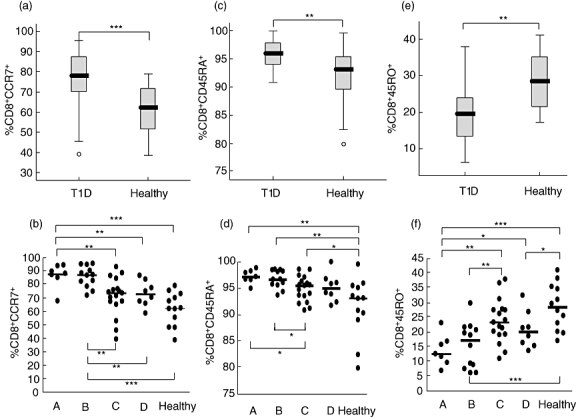
Expression of CCR7, CD45RA and CD45RO receptors on CD8+ cells was determined by flow cytometry. The percentages (%) of cells expressing each receptor in the diabetic (T1D) and healthy groups is shown in box-plots (a,c,e). Horizontal lines represent the median, the box comprises the 25th and 75th percentiles and the error bars the 10th and 90th percentiles. Outliers are indicated. CCR7 (b), CD45RA (d) and CD45RO (f) expression of the receptors on CD8+ cells in relation to duration of T1D in comparison with healthy controls is shown. Patients were grouped according to duration of disease: 0–4 months (A, n = 7); 5–9 months (B, n = 12); 10–14 months (C, n = 17) and 15–18 months (D, n = 8); healthy (n = 12). Asterisks indicate the level of significance: *P < 0·05; **P < 0·01, ***P < 0·001.
As expected, an inverse correlation was observed between CD8+ cells expressing CD45RO and CD8+ cells expressing CD45RA (r = −0·78, P < 0·0001) and CCR7 (r = −0·78, P < 0·0001), while CCR7 and CD45RA on CD8+ cells correlated positively among the patients (r = 0·57; P < 0·0001). In samples from healthy individuals, a weaker correlation was detected between CD8+CD45RA+ and CD8+CCR7+ cells (r = 0·67, P = 0·02), while CD8+ cells expressing CD45RO and CCR7 did not correlate with each other. Further, the inverse correlation between CD8+CD45RA and CD8+CD45RO cells was weaker compared with the same cells in the diabetic group (r = −0·67, P = 0·02).
To test the preferential expression of chemokine receptors on lymphocytes, CXCR3, CCR5, CXCR6 and IL-18 Th1- and CCR4 Th2-associated receptors were analysed on CD8+ cells. No significant differences were seen in any of the Th1-associated receptors, and only the percentages of CD8+ cells expressing the Th2-associated receptor CCR4 was higher in the diabetic group in comparison with healthy individuals (Fig. 2a,b), but not observed on CD4+ cells.
Fig. 2.
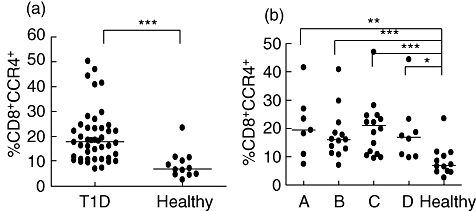
Expression of CCR4 receptors on CD8+ cells was determined by flow cytometry. The percentages (%) of cells expressing CCR4 is shown for each individual in the diabetic (T1D) and healthy groups (a). Patients were grouped according to duration of disease: 0–4 months (A, n = 7); 5–9 months (B, n = 12); 10–14 months (C, n = 17) and 15–18 months (D, n = 8); healthy (n = 12) (b). Horizontal lines represent the median and asterisks indicate the level of significance: *P < 0·05; **P < 0·01, ***P < 0·001.
Cell surface phenotype of CD4+ T cells
T helper lymphocytes were defined for the expression of CD4. In contrast to CD8+ cells, the percentages of CD4+ cells expressing CCR7 was similar in diabetics and healthy subjects. Additionally, the expression of CD4+CD45RA+ and CD4+CD45RO+ cells was similar in samples from T1D and healthy children (data not shown). CD4+CD45RA+ cells correlated strongly with CD4+CCR7+ cells, both in diabetic (r = 0·82, P < 0·0001) and healthy (r = 0·92, P < 0·0001) children. A strong inverse correlation between CD4+ cells expressing CD45RO+ cells and CD8+CD45RA+ (r = −0·78, P < 0·0001) and CD8+CCR7+ (r = −0·77, P < 0·0001) cells was found in the samples from diabetic individuals. In samples from the healthy children, CD4+ CD45RO+ cells was also correlated inversely, even though not to the same strength as in the diabetic group, to CD4+CD45RA+ (r = −0·62, P = 0·03) and CD4+CCR7+ (r = −0·69, P = 0·012) cells.
Further, the expression of chemokine receptors was examined on CD4+ cells. Notably, the percentages of CD4+ cells expressing the Th1-associated receptors CXCR3 and CCR5 were lower in diabetic compared with healthy children (Fig. 3a–d). In addition, CXCR6 considered another classical Th1 receptor was also lower among T1D children (Fig. 3e,f).
Fig. 3.
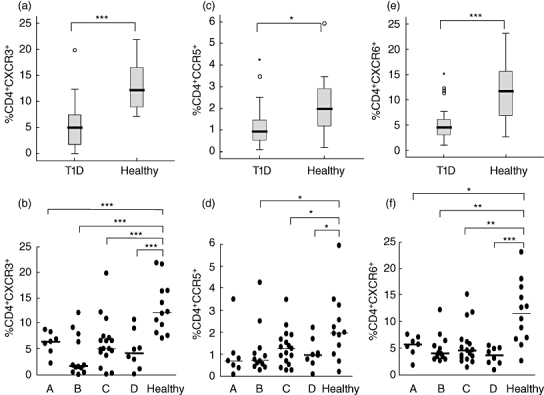
Expression of CXC chemokine receptor 3 (CXCR3), CCR5 and CXCR6 chemokine receptors on CD4+ cells was determined by flow cytometry. The percentages (%) of cells expressing each receptor in the diabetic (T1D) and healthy groups is shown in box-plots (a,c,e). Horizontal lines represent the median, the box comprises the 25th and 75th percentiles and the error bars the 10th and 90th percentiles. Outliers are indicated as CXCR3 (b), CCR5 (d) and CXCR6 (f) expression of the receptors on CD8+ cells in relation to duration of T1D in comparison with healthy controls is shown. Patients were grouped according to duration of disease: 0–4 months (A, n = 7); 5–9 months (B, n = 12); 10–14 months (C, n = 17) and 15–18 months (D, n = 8); healthy (n = 12). Asterisks indicate the level of significance: *P < 0·05; **P < 0·01, ***P < 0·001.
Percentages of CD4+ and CD8+ T cells in lymphocyte gate
Analyses of the percentages of CD4+ cells in T1D and healthy children revealed no differences between samples from T1D (48%) and healthy (44%) children. Additionally, the percentages of CD8+ cells did not differ between the group of diabetics (25%) and healthy children (29%). Even when the percentages of CD4+ and CD8+ cells from diabetic and healthy individuals were not statistically different, the ratio of CD4+/CD8+ was higher in T1D compared with healthy children (P = 0·05) (Fig. 4).
Fig. 4.
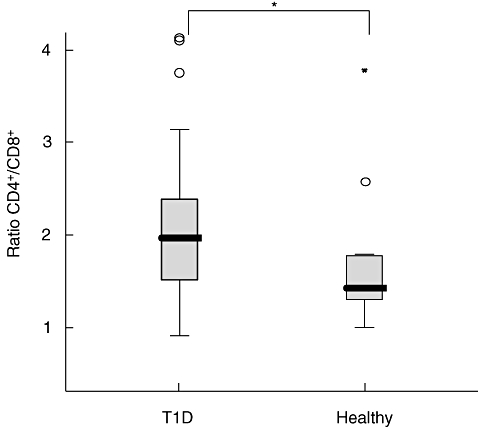
CD4+ and CD8+ cells were analysed by flow cytometry. The ratio of the percentages of CD4+/CD8+ was calculated for each individual. Horizontal lines represent the median, the box comprises the 25th and 75th percentiles and the error bars the 10th and 90th percentiles and outliers are indicated. Asterisk indicates the level of significance: *P < 0·05.
This study also included the analyses of IL-12Rβ and CCR8. However, the expression of both receptors was very low and statistical analysis was thus not performed.
Chemokine secretion in 72-h PBMC culture
Spontaneous secretion of IP-10, MCP1, MIP-1α and MIP-1β in PBMC supernatant was lower in T1D children compared with healthy children (Fig. 5a–d). Chemokine secretion did not increase with longer disease duration. These chemokines also correlated positively with each other (data not shown). Spontaneous secretion of RANTES was similar in the two groups, and correlated with spontaneous secretion of IP-10 (r = 0·31; P < 0·05), MCP-1 (r = 0·44; P = 0·001) and MIP-1α (r = 0·27; P < 0·05). In samples from diabetics, IP-10 secretion correlated with its receptor CXCR3 on both CD4+ (r = 0·51; P < 0·001) and CD8+ cells (r = 0·5; P < 0·002), while in samples from healthy individuals the chemokine correlated with CXCR3 only on CD8+ cells (r = 0·62; P < 0·03). No correlation between CCR5 and any of its ligands MIP-1α, MIP-1β and RANTES was observed. Detectable levels of the CCR7 ligand 6Ckine was observed in only six T1D patients.
Fig. 5.
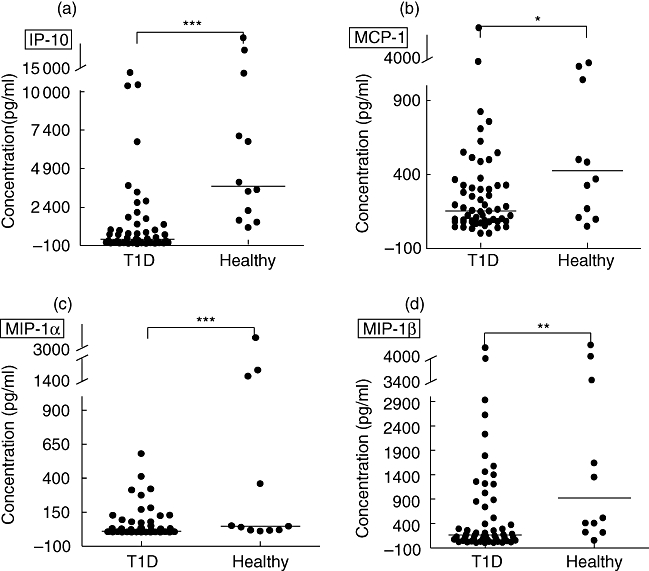
Spontaneous secretion of the chemokines induced protein (IP)-10 (a), monocyte chemoattractant protein (MCP)-1 (b), macrophage inflammatory protein (MIP)-1α (c) and MIP-1β (d) in cell culture supernatant was determined by multiplex fluorochrome technique (Luminex). The chemokine concentrations are expressed as pg/ml. Horizontal lines indicate median values. Asterisks indicate the level of significance: *P < 0·05; **P < 0·01, ***P < 0·001.
Discussion
Despite the fact that chemokines and chemokine receptors are key players in the migration of pathogenic T cells into the islets of non-obese diabetic mice developing T1D [6], few studies have investigated these markers in T1D patients. In this study we found increased percentages of CD8+CCR7+ and CD8+CD45RA Tc cells in peripheral blood of T1D children, especially in those with less than 9 months’ disease duration. This was accompanied by a lower percentage of CD4+ Th cells expressing CXCR3, CXCR6 and CCR5 in samples from the same individuals, together with a reduced secretion of IP-10, MCP-1, MIP-1α and MIP-1β. Collectively, our results demonstrate a reduced Th1 receptor expression on circulating Th but not Tc cells in T1D. We did not observe any difference in the expression of Th1-associated receptors in the CD8+ cell population between T1D and healthy children. However, the Th2-associated chemokine receptor CCR4 was expressed at higher levels in CD8+ cells among diabetics, regardless of disease duration. This might reflect the suppressed Th1 profile observed in the same cell population.
Our finding of reduced expression of CXCR3 and CCR5 on CD4+ but not on CD8+ cells among T1D patients compared with healthy controls is in agreement with previous results [10]. In contrast to Lohmann's study, who demonstrated that the Th1-like receptor expression increased among the patients with disease duration, our results still show a sustained low expression among the diabetics 18 months after diagnosis. However, T1D duration of the patients included in our study was shorter. In addition to the low expression of CXCR3 and CCR5 on CD4+ cells, we also report decreased percentages of CD4+CXCR6+ among T1D patients. CXCR6 has been shown previously to be highly restricted to memory Th1 cells [24], the majority of which lack CCR7 expression [14]. Following the recruitment into inflamed tissues and antigen activation T cells lose CXCR6, and accumulate and produce large amounts of IFN-γ at the inflammation site [25].
Studies in serum from newly diagnosed T1D patients and high-risk individuals for the disease have shown elevated IP-10 levels [26,27]. In contrast, comparable serum concentration of IP-10 between healthy subjects and T1D in another study [28] has suggested that the increased serum IP-10 levels in female type 1 diabetics could be a consequence of the presence of other clinical or subclinical autoimmune diseases, such as chronic thyroiditis and hypothyroidism [29,30]. Increased levels of MIP-1α and MIP-1β have also been detected in serum from T1D patients, in parallel to reduced expression of CCR5 and CXCR3 [10]. Interestingly, in the same study, reduced phytohaemagglutinin (PHA)-stimulated Th1-associated cytokine secretion in PBMC supernatant was observed. In contrast, in a previous study similar spontaneous secretion of RANTES, MCP-1, -2, -3 and monokine induced by IFN-γ (MIG) was detected in PBMC from T1D and healthy children cultured for 48 h [31]. However, our study differs from Stechova et al.'s study in that we included T1D with disease duration between 1 and 18 months, whereas Stechova et al. analysed samples collected 4 days after diagnoses. The divergence of results from different studies might be explained by differences in study populations, detection methods and the fact that we show results from cell culture supernatants after 72 h incubation. Because of the low levels of cytokine production in cell supernatant, their detection is often feasible only after specific or non-specific stimulation. In contrast, chemokines are secreted at higher levels, commonly detectable without further induction by any stimulus. Furthermore, while spontaneous secretion in cell supernatant indicate the in vitro, non-induced ability of the PBMC of secreting chemokines without stimulation, chemokine levels in serum may reflect their production at inflammatory sites by cells other than PBMC. The reduced amount of circulating Th1-like cells in T1D children, together with our previous observation of low secretion of IFN-γ after diagnosis [32,33], might be related to the low secretion of IP-10, and possibly also to the reduced secretion of other chemokines such as MIP-1α, MIP-1β and MCP-1.
There are increasing observations indicating the heterogeneity of the T cell populations in terms of phenotype, function and distribution. Based on their expression of CCR7, CD8+ cells have been subdivided into CCR7+ central memory cells and CCR7– effector memory cells [34], although other studies have revealed multiple roles for the receptor [19,20]. CCR7 define naive and central memory T cells with the ability to circulate repeatedly into lymphoid nodes [35]. The motility of T cells in the T cell areas is also enhanced in the presence of CCR7 signalling, enhancing a faster widespread movement of T cells, and their encounter with resident dendritic cells presenting cognate antigens [36]. CD45 RA and RO phenotypes define naive/effector memory cells and antigen-experienced cells respectively [37]. It has been shown that the percentages of CD4+CD45RA+ cells were higher in prediabetic twins, who later became diabetic, compared with diabetes-protected twins, while diabetes-protected twins had elevated percentages of memory CD4+CD45RO+ cells [23]. In the present study, in parallel to the increased CCR7+ and CD45RA+ Tc phenotype, the peripheral memory CD8+ CD45RO+ cell population was reduced among recent-onset T1D children. However, with duration of disease the CD8+CD45RO+ cells increased in parallel with a decreasing amount of CD8+CD45RA+ cells. Autoantigens have a chemotactic effect on leucocytes, possibly to alert the immune system of tissue damage and facilitate repair [38]. Progression of T1D results in the destruction of the majority of the pancreatic β-cells, with the subsequent reduction of local inflammation and autoantigen release. Lower antigen presentation might lead to the reduction of T cell infiltration into the pancreas area, restoring the effector-memory CD8+ cell balance when the threat disappears. It has been suggested that peripheral CD8+ T cell autoreactivity is suppressed when the vast majority of β cells have been destroyed [39]. This is consistent with our findings of a decreased CD8+expressing CCR7 and CD45RA with duration of disease.
In this study, in parallel with increased percentage of CD8+ cells with CCR7 and CD45RA phenotypes, a reduced expression of the Th1-associated chemokine receptors on CD4+ cells and a lower secretion of the chemokines IP-10, MCP-1, MIP-1α and MIP-1β in cell supernatants were detected in samples from T1D children. In addition to the phenotypic complexity among CD8+ T cells in both mice and humans [40], events that accompany differentiation of naive T cells into activated effector T cells and finally into resting self-renewing memory T cells are determinant in the resulting responses [41]. After antigen encounter, naive CD8+ cells divide and differentiate into CD8+ effector cells. This is followed by a programmed contraction of the CD8+ cells, leading to a population of persisting CD8+ memory cells. Signals from T cell receptors, co-stimulatory molecules and cytokine receptors direct the differentiation process and lineage commitment [42]. CD4+ cells have an important role in guiding the differentiation of CD8+ cells into long-lasting functional memory cells [43], and CD4+ T cell help is required for optimal development of memory CD8+ T cells [44]. In mice, virus infection induced specific CD8+ cells able to proliferate in vivo, and absence of CD4+ T cells exacerbated this deficiency [45]. Chronic infections resulted in a dramatic detriment of T cell function and differentiation, including T cell exhaustion and deletion, and improper memory T cell development [46].
One of the main limitations in T1D studies in humans is the restriction to perform studies exclusively in peripheral blood, leaving only hypotheses to understand the autoimmune inflammatory process at the site in the pancreas. A possible explanation for the reduction of CD4+ cells expressing CXCR6, CXCR3 and CCR5 could be selective recruitment of Th1 cells into the pancreas [11]. In that study lymphocytes were determined by the expression of the CD3+, and phenotypical differences in CD4+ and CD8+ cells were not described. In our study the reduction of Th1-associated chemokine receptor expression was limited to CD4+ cells, while CD8+ cells were characterized by a phenotype related to circulating naive/effector cells. Indeed, reduction of chemokine receptors in circulation does not exclude the accumulation of their ligands in the inflamed organ. Both in human and experimental animal models of inflammation, deficiency of CCR5 was associated with increased levels of its ligand in tissue [47,48], suggesting a different mechanism for the lymphocyte infiltration in the pancreas. In mice, T cells specific for β cell antigens were imprinted with homing receptors for adhesion molecules [49]. We and others have seen previously a decreased Th1-like cytokine response close to the onset of T1D [32,33,50]. Thus, our data could indicate an inadequate suboptimal CD4+ cell function in T1D, leading to impaired function of CD8+ responses.
Percentages of CD4+ and CD8+ cells were similar in samples from diabetic and healthy children, indicating alteration in their phenotype rather than amount of circulating cells. Interestingly, a higher ratio of CD4+/CD8+ cells was observed among T1D compared with healthy children. Activated cytotoxic effector cells and a higher ratio of CD4+/CD8+ cells in peripheral blood of smokers with obstructive pulmonary disease, in parallel with higher percentages of CD8+CD45RA+ cells, suggested a final activation–maturation stage of the CD8+ cells expressing CD45RA, with a correspondingly higher potential for tissue injury [51]. Obstructive pulmonary disease is considered to have an autoimmune component, with a self-perpetuating mechanism similar to autoimmune diseases. Thus, CD8+CD45+ cells result possibly in a similar effect on pancreas injury in T1D.
In conclusion, low Th1-associated receptor expression of CD4+ cells together with an increased amount of CD8+ cells expressing CD45RA and CCR7, and reduced chemokine secretion in the PBMC cultures in T1D patients, suggests suboptimal Th function and impaired Tc responses in children with T1D close to the diagnoses. This could result in continuous recirculation and recruitment of Tc naive/effector cells enhancing the inflammatory state in the pancreas, while the Th1 cell population in peripheral blood is suppressed. Increased knowledge of T cell phenotypes present in the disease process leading to T1D might provide important clues for the development of novel therapeutics for prevention of the disease.
Acknowledgments
This study was supported by the Swedish Child Diabetes Foundation (Barndiabetesfonden), the Swedish Medical Research Council (MFR; Vetenskapsrådet) and the Medical Research Fund of the County of Östergötland.
References
- 1.Eisenbarth GS. Type I diabetes mellitus. A chronic autoimmune disease. N Engl J Med. 1986;314:1360–8. doi: 10.1056/NEJM198605223142106. [DOI] [PubMed] [Google Scholar]
- 2.Liblau RS, Wong FS, Mars LT, Santamaria P. Autoreactive CD8 T cells in organ-specific autoimmunity: emerging targets for therapeutic intervention. Immunity. 2002;17:1–6. doi: 10.1016/s1074-7613(02)00338-2. [DOI] [PubMed] [Google Scholar]
- 3.Loetscher P, Pellegrino A, Gong JH, et al. The ligands of CXC chemokine receptor 3, I-TAC, MIG, and IP-10, are natural antagonists for CCR3. J Biol Chem. 2001;276:2986–91. doi: 10.1074/jbc.M005652200. [DOI] [PubMed] [Google Scholar]
- 4.Schrum S, Probst P, Fleischer B, Zipfel PF. Synthesis of the CC-chemokines MIP-1alpha, MIP-1beta, and RANTES is associated with a type 1 immune response. J Immunol. 1996;157:3598–604. [PubMed] [Google Scholar]
- 5.Taub DD, Lloyd AR, Conlon K, et al. Recombinant human interferon-inducible protein 10 is a chemoattractant for human monocytes and T lymphocytes and promotes T cell adhesion to endothelial cells. J Exp Med. 1993;177:1809–14. doi: 10.1084/jem.177.6.1809. [DOI] [PMC free article] [PubMed] [Google Scholar]
- 6.Bradley LM, Asensio VC, Schioetz LK, et al. Th1, but not Th2, cells secrete multiple chemokines and promote rapid induction of autoimmune diabetes. J Immunol. 1999;162:2511–20. [PubMed] [Google Scholar]
- 7.Ransohoff RM, Hamilton TA, Tani M, et al. Astrocyte expression of mRNA encoding cytokines IP-10 and JE/MCP-1 in experimental autoimmune encephalomyelitis. FASEB J. 1993;7:592–600. doi: 10.1096/fasebj.7.6.8472896. [DOI] [PubMed] [Google Scholar]
- 8.Premack BA, Schall TJ. Chemokine receptors: gateways to inflammation and infection. Nat Med. 1996;2:1174–8. doi: 10.1038/nm1196-1174. [DOI] [PubMed] [Google Scholar]
- 9.D’Ambrosio D, Iellem A, Bonecchi R, et al. Selective up-regulation of chemokine receptors CCR4 and CCR8 upon activation of polarized human type 2 Th cells. J Immunol. 1998;161:5111–15. [PubMed] [Google Scholar]
- 10.Lohmann T, Laue S, Nietzschmann U, et al. Reduced expression of Th1-associated chemokine receptors on peripheral blood lymphocytes at diagnosis of Type 1 diabetes. Diabetes. 2002;51:2474–80. doi: 10.2337/diabetes.51.8.2474. [DOI] [PubMed] [Google Scholar]
- 11.Qin S, Rottman JB, Myers P, et al. The chemokine receptors CXCR3 and CCR5 mark subsets of T cells associated with certain inflammatory reactions. J Clin Invest. 1998;101:746–54. doi: 10.1172/JCI1422. [DOI] [PMC free article] [PubMed] [Google Scholar]
- 12.Teraki Y, Picker LJ. Independent regulation of cutaneous lymphocyte-associated antigen expression and cytokine synthesis phenotype during human CD4+ memory T cell differentiation. J Immunol. 1997;159:6018–29. [PubMed] [Google Scholar]
- 13.Kim SH, Cleary MM, Fox HS, Chantry D, Sarvetnick N. CCR4-bearing T cells participate in autoimmune diabetes. J Clin Invest. 2002;110:1675–86. doi: 10.1172/JCI15547. [DOI] [PMC free article] [PubMed] [Google Scholar]
- 14.Kim CH, Kunkel EJ, Boisvert J, et al. CXCR6 expression defines type 1-polarized T-cell subsets with extralymphoid tissue homing potential. J Clin Invest. 2001;107:595–601. doi: 10.1172/JCI11902. [DOI] [PMC free article] [PubMed] [Google Scholar]
- 15.Forster R, Schubel A, Breitfeld D, et al. CCR7 coordinates the primary immune response by establishing functional microenvironments in secondary lymphoid organs. Cell. 1999;99:23–33. doi: 10.1016/s0092-8674(00)80059-8. [DOI] [PubMed] [Google Scholar]
- 16.Gunn MD, Tangemann K, Tam C, Cyster JG, Rosen SD, Williams LT. A chemokine expressed in lymphoid high endothelial venules promotes the adhesion and chemotaxis of naive T lymphocytes. Proc Natl Acad Sci USA. 1998;95:258–63. doi: 10.1073/pnas.95.1.258. [DOI] [PMC free article] [PubMed] [Google Scholar]
- 17.Hopken UE, Droese J, Li JP, et al. The chemokine receptor CCR7 controls lymph node-dependent cytotoxic T cell priming in alloimmune responses. Eur J Immunol. 2004;34:461–70. doi: 10.1002/eji.200324690. [DOI] [PubMed] [Google Scholar]
- 18.Martin-Fontecha A, Sebastiani S, Hopken UE, et al. Regulation of dendritic cell migration to the draining lymph node: impact on T lymphocyte traffic and priming. J Exp Med. 2003;198:615–21. doi: 10.1084/jem.20030448. [DOI] [PMC free article] [PubMed] [Google Scholar]
- 19.Hugues S, Mougneau E, Ferlin W, et al. Tolerance to islet antigens and prevention from diabetes induced by limited apoptosis of pancreatic beta cells. Immunity. 2002;16:169–81. doi: 10.1016/s1074-7613(02)00273-x. [DOI] [PubMed] [Google Scholar]
- 20.Davalos-Misslitz AC, Rieckenberg J, Willenzon S, et al. Generalized multi-organ autoimmunity in CCR7-deficient mice. Eur J Immunol. 2007;37:613–22. doi: 10.1002/eji.200636656. [DOI] [PubMed] [Google Scholar]
- 21.Nagira M, Imai T, Yoshida R, et al. A lymphocyte-specific CC chemokine, secondary lymphoid tissue chemokine (SLC), is a highly efficient chemoattractant for B cells and activated T cells. Eur J Immunol. 1998;28:1516–23. doi: 10.1002/(SICI)1521-4141(199805)28:05<1516::AID-IMMU1516>3.0.CO;2-J. [DOI] [PubMed] [Google Scholar]
- 22.Summers KL, O'Donnell JL, Hart DN. Co-expression of the CD45RA and CD45RO antigens on T lymphocytes in chronic arthritis. Clin Exp Immunol. 1994;97:39–44. doi: 10.1111/j.1365-2249.1994.tb06576.x. [DOI] [PMC free article] [PubMed] [Google Scholar]
- 23.Peakman M, Alviggi L, Hussain M, Hawwa M, Leslie R, Vergani D. Increased expression of T-cell markers of immunological memory associated with protection from type 1 diabetes. A study of identical twins. Diabetes. 1994;43:712–717. doi: 10.2337/diab.43.5.712. [DOI] [PubMed] [Google Scholar]
- 24.Unutmaz D, Xiang W, Sunshine MJ, Campbell J, Butcher E, Littman DR. The primate lentiviral receptor Bonzo/STRL33 is coordinately regulated with CCR5 and its expression pattern is conserved between human and mouse. J Immunol. 2000;165:3284–92. doi: 10.4049/jimmunol.165.6.3284. [DOI] [PubMed] [Google Scholar]
- 25.Koprak S, Matheravidathu S, Springer M, Gould S, Dumont FJ. Down-regulation of cell surface CXCR6 expression during T cell activation is predominantly mediated by calcineurin. Cell Immunol. 2003;223:1–12. doi: 10.1016/s0008-8749(03)00130-8. [DOI] [PubMed] [Google Scholar]
- 26.Nicoletti F, Conget I, Di Mauro M, et al. Serum concentrations of the interferon-gamma-inducible chemokine IP-10/CXCL10 are augmented in both newly diagnosed type I diabetes mellitus patients and subjects at risk of developing the disease. Diabetologia. 2002;45:1107–10. doi: 10.1007/s00125-002-0879-5. [DOI] [PubMed] [Google Scholar]
- 27.Shimada A, Morimoto J, Kodama K, et al. Elevated serum IP-10 levels observed in type 1 diabetes. Diabetes Care. 2001;24:510–15. doi: 10.2337/diacare.24.3.510. [DOI] [PubMed] [Google Scholar]
- 28.Rotondi M, Lazzeri E, Romagnani P, Serio M. Role of interferon-gamma inducible chemokines in endocrine autoimmunity: an expanding field. J Endocrinol Invest. 2003;26:177–80. doi: 10.1007/BF03345149. [DOI] [PubMed] [Google Scholar]
- 29.Rotondi M, Romagnani P, Brozzetti A, et al. 2002 Serum concentrations of the interferon-alpha-inducible chemokine IP-10/CXCL10 are augmented in both newly-diagnosed Type I diabetes mellitus patients and subjects at risk of developing the disease. Diabetologia. 2003;46:1020–7. doi: 10.1007/s00125-003-1134-4. [DOI] [PubMed] [Google Scholar]
- 30.Antonelli A, Rotondi M, Fallahi P, et al. High levels of circulating CXC chemokine ligand 10 are associated with chronic autoimmune thyroiditis and hypothyroidism. J Clin Endocrinol Metab. 2004;89:5496–9. doi: 10.1210/jc.2004-0977. [DOI] [PubMed] [Google Scholar]
- 31.Stechova K, Bohmova K, Vrabelova Z, et al. T-helper-1 cytokines but low T-helper-3 cytokines, inflammatory cytokines and chemokines in children with high risk of developing type 1 diabetes. Diabetes Metab Res Rev. 2007;23:462–71. doi: 10.1002/dmrr.718. [DOI] [PubMed] [Google Scholar]
- 32.Karlsson MG, Lawesson SS, Ludvigsson J. Th1-like dominance in high-risk first-degree relatives of type I diabetic patients. Diabetologia. 2000;43:742–9. doi: 10.1007/s001250051372. [DOI] [PubMed] [Google Scholar]
- 33.Hedman M, Ludvigsson J, Faresjo MK. Nicotinamide reduces high secretion of IFN-gamma in high-risk relatives even though it does not prevent type 1 diabetes. J Interferon Cytokine Res. 2006;26:207–13. doi: 10.1089/jir.2006.26.207. [DOI] [PubMed] [Google Scholar]
- 34.Sallusto F, Lenig D, Forster R, Lipp M, Lanzavecchia A. Two subsets of memory T lymphocytes with distinct homing potentials and effector functions. Nature. 1999;401:708–12. doi: 10.1038/44385. [DOI] [PubMed] [Google Scholar]
- 35.Worbs T, Forster R. A key role for CCR7 in establishing central and peripheral tolerance. Trends Immunol. 2007;28:274–80. doi: 10.1016/j.it.2007.04.002. [DOI] [PubMed] [Google Scholar]
- 36.Worbs T, Memper T, Bölter J, von Adrian U, Förster R. CCR7 ligands stimulate the intranodal motility of T lymphocytes in vivo. J Exp Med. 2007;204:489–95. doi: 10.1084/jem.20061706. [DOI] [PMC free article] [PubMed] [Google Scholar]
- 37.Merkenschlager M, Terry L, Edwards R, Beverly P. Limiting dilution analysis of proliferative responses in human leukocyte populations defined by the monoclonal antibody UCHL1: implications for differential CD45 expression in T cell memory formation. Eur J Immunol. 1988;18:1027–33. doi: 10.1002/eji.1830181102. [DOI] [PubMed] [Google Scholar]
- 38.Oppenheim JJ, Dong HF, Plotz P, et al. Autoantigens act as tissue-specific chemoattractants. J Leukoc Biol. 2005;77:854–61. doi: 10.1189/jlb.1004623. [DOI] [PubMed] [Google Scholar]
- 39.Pinske G, Tysma O, Bergen C, et al. Autoreactive CD8+ T cells associated with β cell destruction in type 1 diabetes. Proc Natl Acad Sci USA. 2005;102:18425–30. doi: 10.1073/pnas.0508621102. [DOI] [PMC free article] [PubMed] [Google Scholar]
- 40.Sallusto F, Geginat J, Lanzavecchia A. Central memory and effector memory T cell subsets: function, generation and maintenance. Ann Rev Immunol. 2004;22:745–63. doi: 10.1146/annurev.immunol.22.012703.104702. [DOI] [PubMed] [Google Scholar]
- 41.Masopust D, Vezys V, Wherry E, Ahmed R. A brief history of CD8+ T cells. Eur J Immunol. 2007;37:S103, 10. doi: 10.1002/eji.200737584. [DOI] [PubMed] [Google Scholar]
- 42.Hinrichs C, Gattinoni L, Restifo N. Programming CD8+ T cells for effective immunotherapy. Curr Opin Immunol. 2006;18:363–70. doi: 10.1016/j.coi.2006.03.009. [DOI] [PMC free article] [PubMed] [Google Scholar]
- 43.Northorp J, Shen H. CD8+ T-cell memory: only the good ones last. Curr Opin Immunol. 2004;16:451–5. doi: 10.1016/j.coi.2004.05.004. [DOI] [PubMed] [Google Scholar]
- 44.Williams M, Bevan M. Effector and memory CTL differentiation. Ann Rev Immunol. 2007;25:171–92. doi: 10.1146/annurev.immunol.25.022106.141548. [DOI] [PubMed] [Google Scholar]
- 45.Woodland D, Dutton RW. Heterogenicity of CD4+ and CD8+ T cells. Curr Opin Immunol. 2003;15:336–42. doi: 10.1016/s0952-7915(03)00037-2. [DOI] [PubMed] [Google Scholar]
- 46.Shin H, Wherry E. CD8 T cell dysfunction during chronic viral infection. Curr Opin Immunol. 2007;19:408–15. doi: 10.1016/j.coi.2007.06.004. [DOI] [PubMed] [Google Scholar]
- 47.Locati M, Murphy P. Chemokines and chemokine receptors: biology and clinical relevance in inflammation and AIDS. Annu Rev Med. 1999;50:425–40. doi: 10.1146/annurev.med.50.1.425. [DOI] [PubMed] [Google Scholar]
- 48.Carr D, Ash J, Lane T, Kiziel W. Abnormal immune response of CCR5-deficient mice to ocular infection with herpes simplex virus type 1. J Gen Virol. 2006;87:489–99. doi: 10.1099/vir.0.81339-0. [DOI] [PMC free article] [PubMed] [Google Scholar]
- 49.Hänninen A, Nurmela R, Maksimow M, et al. Islet β-cell-specific T cells can use different homing mechanisms to infiltrate and destroy pancreatic islets. J Phatol. 2007;170:240–50. doi: 10.2353/ajpath.2007.060142. [DOI] [PMC free article] [PubMed] [Google Scholar]
- 50.Halminen M, Simell O, Knip M, Ilonen J. Cytokine expression in unstimulated PBMC of children with type 1 diabetes and subjects positive for diabetes-associated autoantibodies. Scand J Immunol. 2001;53:510–13. doi: 10.1046/j.1365-3083.2001.00904.x. [DOI] [PubMed] [Google Scholar]
- 51.Barceló B, Pons J, Ferrer JM, Sauleda J, Fuster A, Agustí AG. Phenotypic characterization of T-lymphocytes in chronic obstructive pulmonary disease: abnormal CD4+CD25+ regulatory T-lymphocyte response to tobacco smoking. Eur Respir J. 2008;31:555–62. doi: 10.1183/09031936.00010407. [DOI] [PubMed] [Google Scholar]