

Abstract
The membrane proteome plays a critical role in electron transport processes in Shewanella oneidensis MR-1, a bacterial organism that has great potential for bioremediation. Biotinylation of intact cells with subsequent affinity-enrichment has become a useful tool for characterization of the membrane proteome. As opposed to these commonly used, water-soluble commercial reagents, we here introduce a family of hydrophobic, cell-permeable affinity probes for extensive labeling and detection of membrane proteins. When applied to S. oneidensis cells, all three new chemical probes allowed identification of a substantial proportion of membrane proteins from total cell lysate without the use of specific membrane isolation method. From a total of 410 unique proteins identified, approximately 42% are cell envelope proteins that include outer membrane, periplasmic, and inner membrane proteins. This report demonstrates the first application of this intact cell biotinylation method to S. oneidensis and presents the results of many identified proteins that are involved in metal reduction processes. As a general labeling method, all chemical probes we introduced in this study can be extended to other organisms or cell types and will help expedite the characterization of membrane proteomes.
Keywords: Membrane proteome, cell surface proteins, biotinylation, intact cell labeling, Shewanella oneidensis, and protein identification
Introduction
Membranes provide an important physical interface between cells and their environment and play crucial roles in fundamental biological processes, such as protein export, electron transmission, signaling pathways, and cell-cell communications. Proteins spanning the membrane lipid bilayers and those associated with membranes are essential components regulating these biological functions. Some estimates suggest that approximately 20–30% of all open reading frames encode for membrane proteins.1,2 And importantly, more than 50% of current targets for therapeutic intervention and drug discovery target are membrane proteins because of their accessibility.3,4
The organism of interest for this study is Shewanella oneidensis MR-1,5 a gram-negative facultatively anaerobic bacterium. S. oneidensis can use a variety of terminal electron acceptors, including both soluble and insoluble, organic and inorganic compounds, for anaerobic respiration.6,7 Many of these compounds, especially those with metals such as uranium and chromium, are toxic to humans and other organisms when concentrated in the environment. Thus, S. oneidensis has a great potential for bioremediation because of its ability to reduce and precipitate these toxic compounds from solution and prevent them from spreading. Like other gram-negative bacteria, the cell envelope of S. oneidensis includes 3 layers: outer membrane, periplasmic space (peptidoglycan), and inner membrane (plasma membrane). The versatile respiratory capabilities of S. oneidensis are resultant from its multi-component branched electron transport system, which includes primarily membrane proteins associated with all three layers of the cell envelope. In particular, those cell surface exposed proteins have direct roles in the metal reducing activities of this organism. For example, c-type cytochromes comprise one of the most important multi-component complexes involved in electron transport in S. oneidensis. 80% of the membrane-bound c-type heme is localized to the outer membrane,8 indicating the anaerobic respiratory activities of S. oneidensis are facilitated by direct contact between surface proteins and extracellular electron acceptors. Therefore, defining these membrane proteins, especially surface-exposed outer membrane proteins, is crucial for better understanding the versatile electron transport mechanisms of this organism.
Although membrane proteins are of considerable importance for fundamental biology, biomedical applications, and bioremediation efforts, the hydrophobic nature and relatively low abundance of most membrane proteins have imposed extreme challenges for proteomic analysis to determine their identity and function. Numerous efforts have targeted these inherent difficulties with membrane proteins. These methods include either enrichment of membrane proteins by subcellular fractionation, e.g., sucrose density centrifugation9 and differential centrifugation,10 or increasing solubility of membrane proteins with inclusion of organic acid,11 organic solvent,12 or low level detergent13 that is compatible with subsequent proteolysis and mass spectrometric analysis. 2D SDS-PAGE methods, though effective in separation of complex protein mixtures, have been problematic in analyzing membrane proteins since many are prone to precipitation at their isoelectric point.14 Replacement of the first dimensional IEF with anion exchange chromatography15 or with acidic discontinuous PAGE by using cationic detergent (BAC)16 has shown significant improvement in membrane protein identifications. LC/MS-based shotgun methods,17 as alternative to gel-based methods, are becoming the technique of choice for high-throughput and large-scale proteomics analysis. The Yates group demonstrated the first proteome-wide application of the MudPIT method for profiling proteins from isolated yeast membranes.11 Later, they reported an improved method, using high pH and non-specific proteolysis, for efficient profiling membrane proteins from brain homogenate.18 Although the large-scale shotgun approaches can effectively identify abundant proteins, low-abundance proteins are often under-represented due to dynamic range limitations.
Alternatively, selective enrichment of membrane proteins by biotinylation labeling and subsequent affinity purification can further improve the throughput of detection of low-abundance membrane proteins. With this strategy, many applications have recently shown improved coverage and selectivity in profiling membrane proteome.19–28 Though it was reported earlier that both water-soluble and insoluble forms of chemical probes label outer membrane, periplasmic, and inner membrane proteins in E. coli cells,29 most recent applications exploited water-soluble forms of chemical probes that are commercially available. For example, Zhao et al. employed sulfo-NHS-SS-biotin (primary amine reactive) for labeling of intact human cancer cells followed by 1D-SDS-PAGE separation and LC/MS/MS analysis. They identified 14 membrane proteins out of 33 total proteins in the initial application22 and 526 membrane proteins out of total 781 proteins with improved membrane fractionation procedure and high-salt buffer washes.27 Smith et al. applied a water-soluble, sulfhydryl reactive labeling reagent iodoacetyl-PEO-biotin for enriching membrane proteins from bacterial cells and they identified 89 proteins, of which 40 were membrane proteins.24 In another application, they used sulfo-NHS-LC-biotin, a primary amine reactive, water-soluble labeling reagent to HMEC cells and identified 45 membrane proteins.25 Very recently, Nunomura et al. applied the same reagent, sulfo-NHS-LC-biotin, for cell surface labeling of mouse stem cells and identified 200 membrane protein among 324 total proteins with specific membrane isolation.28 Conceptually at least, water-soluble chemical reagent are cell-impermeable and thus, preferentially label cell surface proteins. However, in nearly all the membrane protein profiling studies published to date, a substantial proportion of cytosolic proteins were inevitably observed presumably due to contamination.
In contrast to these previous proteomic affinity labeling methods, we report here our results using novel hydrophobic cell-permeable chemical probes, which were designed and synthesized in house on a modular scaffold, for profiling membrane proteome of S. oneidensis. We believe that after cell penetration the hydrophobic labeling probes likely remain close to membranes rather than soluble cytosols and hence, preferentially react with membrane and membrane-associated proteins. Our data demonstrated identification of both membrane and soluble proteins with the use of these new affinity probes. Importantly, a substantial proportion of membrane proteins were identified without the need for tedious membrane fraction preparations. This report presents the first application of affinity labeling method for extensive profiling cell surface and membrane proteins in S. oneidensis bacterial cells.
Experimental Procedures
Materials
All chemicals were purchased from Sigma (St. Louis, MO) unless otherwise noted. Fmoc-protected amino acids and HMPB-MBHA resins used for synthesis of affinity chemical probe were purchased from Novabiochem (San Diego, CA). Water used for making buffer and solution was 18-ΩM deionized water prepared with a Barnstead Nanopure Water System.
Synthesis of affinity chemical probes
Three affinity chemical probes PIR-I, PIR-II, and PIR-III (Figure 1) are synthesized using a 431A Peptide Synthesizer (Applied Biosystem, Foster City, CA, USA) with solid phase peptide synthesis chemistry. Glycine was coupled to HMPB-MBHA (4-hydroxymethyl-3-methoxyphenoxybutyric acid) resin using the standard symmetric anhydride method. For PIR-I, the biotin group was introduced in the form of N-α-Fmoc-N-ε-biotinyl-L-lysine using standard coupling reactions. The synthesis of PIR-II and PIR-III and other details are described elsewhere.30
Figure 1.

Structure of three new affinity chemical probes, named PIR-I, PIR-II, and PIR-III. Each compound includes a biotin group as affinity tag (highlighted in yellow) and two reactive NHS groups (in blue). Additional features of these compounds are also highlighted in the figure, such as low-energy mass spectrometry cleavable bonds (red dashed lines), a PEG hydrophilic side chain in PIR-II and PIR-III (in green), and a photo-cleavable group (in pink, cleavable bond as specified by blue dashed lines) for PIR-III.
Sample preparation
The general strategy used in this study is outlined in Figure 2. S. oneidensis MR-1 cells, ATCC 700550, were obtained from American Type Culture Collection (Manassas, VA) and maintained in Luria Bertani (LB) broth. 200 mL sterile LB broth was inoculated with 4 mL of overnight culture in 1 L flask and incubated with a rotary shaker at 100 rpm at room temperature. Cells were harvested at mid-log phase (OD600 = 1.2) by centrifuging at 2,000 × g for 20 min. Pelleted cells were washed three times in 40 mL ice-chilled PBS buffer (150 mM sodium phosphate, 100 mM NaCl, pH 7.5). After final wash, the cells were resuspended in 1 mL PBS and the PIR compound was added to cell suspension to a final concentration of 1 mM. The reactions were carried out at room temperature with shaking for 5 min and then terminated with quenching by 50 μL 1 M Tris buffer (pH 7.5). The labeled cells were washed with 1 mL PBS buffer 5 times to remove excessive, unreacted PIR compounds and secreted proteins. The cells were then lysed in 1 mL PBS/2% NP-40 (v/v) by sonication for 2 min. The lysed cells were centrifuged at 16,000 × g at 4°C for 40 min. The pellets were discarded and supernatants were collected in a clean tube. The labeled cell lysates were passed through a Dextran de-salting column (Pierce, Rockford, IL) to further remove unreacted PIR compounds and salts. The labeled proteins were then captured and separated from whole cell lysate by an immobilized monomeric avidin column (Pierce, Rockford, IL) in a 0.5 mL volume. After incubation of labeled cell lysate in avidin column for 30 min, the column was washed extensively with 1 mL buffer A (150 mM NaCl, 10 mM Tris, 2 mM EDTA, 0.1% NP-40, and 0.1% Triton X-100, pH 7.5) 4 times, 1 mL buffer B (500 mM NaCl, 10 mM Tris, 2 mM EDTA, 0.1% NP-40, and 0.1% Triton X-100, pH 7.5) 3 times, and 1 mL buffer C (10mM Tris, pH 7.5) 3 times. The labeled proteins were then eluted with 1 mL of elution buffer (8 M urea, 2% SDS, and 5 mM d-biotin). The eluent was TCA precipitated to remove salts and detergent. The washed pellet was resuspended in a 100 μL digestion buffer (100 mM NH4HCO3, pH 7.8, and 8 M urea). Proteins are reduced with DTT at final concentration of 5 mM and alkylated with iodoacetamide at final concentration of 25 mM. Then the solution was diluted 4 times with 100 mM NH4HCO3 buffer and 20 μg trypsin (Promega, Madison, WI) was added for overnight digestion at 37°C. 100 μL of tryptic digest was used for C18 ZipTip® (Millipore, Billerica, MA) to remove salts. The concentrated peptides were finally resuspended in 20 μL 0.1% formic acid for 2D LC/MS/MS analysis.
Figure 2.

Schematic illustration of the strategy used to profile membrane proteomes.
SDS-PAGE and Western blot analysis
SDS-PAGE and Western blot analyses were used to optimize labeling reaction conditions and biotin-avidin affinity purification conditions. For SDS-PAGE analysis, the same amount of cell lysate prepared from the equal amount of cells with and without PIR compound labeling after affinity purification were separated by 8% SDS-PAGE and visualized with Coomassie Blue R250 (Bio-Rad, Hercules, CA, USA). For Western blot analysis, proteins were separated by 8% SDS-PAGE gel and then transferred to a nitrocellulose membrane (Whatman, Sanford, ME) with a Trans-Blot® semidry transfer cell (BioRad, Hercules, CA). After transferring, the membrane was blocked with 5% nonfat milk in TBS overnight at 4°C followed by incubation with the primary antibody anti-biotin (Sigma, St. Louis, MO) at 1:5000 dilution for 1 h at room temperature. And finally the membrane was probed by HRP-conjugated secondary antibody and chemiluminescence peroxidase substrate (Sigma, St. Louis, MO).
Electron microscopy (EM) cell imaging
S. oneidensis MR-1 cells in PBS suspension with or without compound PIR labeling were loaded onto the carbon-coated nickel grids for immunogold EM detection of surface proteins labeling. Fixation buffer (2% paraformaldehyde, 1.25% glutaraldehyde, 0.05 M phosphate buffer, pH 7.2) was used to incubate with sample grids for 15 min with subsequent PBS washing 2 times. The residual aldehyde was then quenched by incubation with 0.02 M glycine in PBS for 5 min. Anti-biotin monoclonal antibody (Sigma, St. Louis, MO) was added in PBS-BSA (20 mM phosphate, 500 mM NaCl, 0.5% BSA, 0.1% Gelatin, 0.05% Tween20, pH 7.4) at 1:25 ratio for primary antibody incubation for 10 min with occasional shaking at room temperature. After washing with PBS-BSA 3 times, 10 nm colloidal gold particle-conjugated with goat-anti-mouse IgGs (Sigma, St. Louis, MO) at 1:50 ratio in PBS-BSA was added for secondary antibody incubation for 30 min. Cells were washed 3 times with PBS-BSA before the final fixation of cells and antibodies using 1% glutaraldehyde in PBS for 15 min. The fixatives were removed by buffer (20 mM phosphate, 150 mM NaCl, 4% BSA, 2 mM NaN3, pH 7.4). The sample grids were examined by EM using JEOL 1200 EX transmission electron microscope after staining with uranyl acetate for contrast enhancement. To ascertain membrane permeability of the PIR compound, the immunogold EM assay was also carried out using thin sections of S. oneidensis MR-1 cells. The labeled and unlabeled cells were treated with a fixation buffer (2% paraformaldehyde, 1.25% glutaraldehyde, 0.05 M phosphate buffer, pH 7.2) for 1 h. Sample dehydration was performed in a series of graded ethanol treatment steps (10%, 25%, 50%, 75%, 90%, and 100%) for consecutive overnight periods. The dehydrated samples were embedded in an LR White resin for infiltration and polymerization. The thin sections were generated with a diamond knife mounted in an ultracut microtome for loading onto carbon-coated nickel grids. First, the grids were floated on a drop of water for 10 min. PBS-BSA was then incubated with sample grids for 5 min to block non-specific binding. A solution of 1:25 diluted anti-biotin monoclonal antibody was added in PBS-BSA for 1 h incubation with section grids. After rinsing with PBS-BSA 3 times, 10 nm colloidal gold particle-labeled goat-anti-mouse IgGs at 1:50 dilution ratio were incubated with sample grids for 30 min. Sections were then washed with PBS 3 times and post-fixed by 1% glutaraldehyde in PBS for 3 min. Deionized water droplets were used to rinse the section grids for 10 min before EM examination. Uranyl acetate was also used to increase the contrast of section images. Negative controls include the unlabeled cells and the labeled cells without primary antibody incubation. JEOL 1200 EX transmission electron microscope was utilized to perform EM imaging.
2D LC/MS/MS
Data-dependent nano 2D LC/MS/MS was performed using ion trap mass spectrometer (Esquire HCT, Bruker Daltonics, Billerica, MA) equipped with a nano-ESI source and nano-HPLC systems (Ultimate, Dionex, Sunnyvale, CA). For 2D LC/MS/MS, a strong cation exchange (SCX) cartridge (500 μm × 15 mm, 5 μm, Dionex) was used for the first dimension separation and a nano C18 reversed phase column (C18 PepMap, 75 μm × 150 mm, 3 μm, 100 Å, Dionex) was used for the second dimension separation. 10 μL salt plug (10, 25, 50, 100, 250, 500, and 1000 mM ammonium acetate in 0.1% formic acid and 2% acetonitrile) was used for each salt step elution of the SCX cartridge. Samples and salt plugs were injected to the SCX cartridge by autosampler and the eluent from SCX cartridge was trapped in a micro pre-column (C18 PepMap, 300 μm × 1 mm, 5 μm, Dionex). The pre-column was washed with solvent A (0.1% formic acid, 2% acetonitrile in water) at a flow rate of 50 μL/min for 3 min and then peptides were eluted at a flow rate of 200 nL/min to the reversed phase nano-column and separated using the following gradient: 0% B for 0–3 min, 0–15% B for 3–15 min, 15–25% B for 15–60 min, 25–40% B for 60–90 min, 95% B for 90–105 min, and 0% B for 105–120 min. Solvent B was 0.1% formic acid in 95% acetonitrile.
Data analysis
Bruker Daltonics DataAnalysis software (version 3.1) and BioTools software (version 2.2) were used for data analysis and protein identification. A data processing script provided by Bruker Daltonics was used to generate one .mgf file compiled from the entire 2D LC/MS/MS run. The .mgf file was then used to search database using the Mascot program (version 2.1.0, MatrixScience Ltd, London) licensed in house. The database containing the complete genome of S. oneidensis MR-1 (4,854 ORFs) was downloaded in FASTA file format from The Institute for Genomic Research (TIGR) (http://www.tigr.org/). Search parameters were set as follows: enzyme, trypsin; allowed miss cleavage up to 3; fixed modifications, carbamidomethyl (C); variable modifications, oxidation (M); peptide tolerance, 3 Da; and MS/MS tolerance, 0.8 Da. Auto-hits option was selected to allow reporting all the protein hits with the probability-based Mowse scores that exceeded their thresholds (p < 0.05), indicating significance at the 95% confidence level.31 The output of search result was further filtered using more stringent MudPIT scoring and ions score cut-off of 0.1, which removed all the peptides with expect value (E) > 0.1. Those proteins identified with more than 2 peptides which had minimal peptide ion score > 30 were accepted as true identifications without additional manual spectral inspection. For those proteins identified with a single peptide, if E was < 0.01 (99% confidence level), the protein hit was accepted as true identification without further manual inspection; if E was between 0.01 and 0.05, the protein hit was accepted only when > 3 consecutive y or b ions were observed in the MS/MS spectrum; any other single peptide hits with E > 0.05 were discarded.
Results
Features of new affinity chemical probes
We previously reported a new class of chemical cross-linkers, which we call protein interaction reporters (PIRs),32 for study of protein-protein interactions. The name PIR was retained for the current affinity chemical probes, since they were the same family of compounds designed and synthesized on the same modular scaffold using solid-phase Fmoc peptide synthesis chemistry. The structure of the PIR compound can be readily modified with incorporation of various building blocks. For current goal of intact cell labeling and affinity purifications, two N-hydroxysuccinimide (NHS) esters as reactive groups and a biotin group as affinity tag were included in the structure (Figure 1). Aside from these common features that can be used as affinity labeling reagents, these compounds include additional properties such as low-energy mass spectrometry cleavable bonds (highlighted by the red dashed lines in Figure 1) and cross-linking capabilities provided by the double NHS groups for protein-protein interaction studies. A hydrophilic side chain PEG group was incorporated in compound PIR-II and PIR-III to provide better solubility. PIR-III includes an additional photo-cleavable group which could be used for elution of captured biotinylated proteins from avidin beads by breaking the photo-cleavable bond. These additional features for compound PIR-I, II, and III were evaluated and reported elsewhere.30 In the present study, our efforts were focused on exploring these compounds as affinity labeling probes for profiling cell envelope proteins in Shewanella oneidensis MR-1. In general all three compounds are hydrophobic because of multi-aromatic rings and NHS ester groups. PIR-II and PIR-III have relatively better solubility than PIR-I due to incorporation of a hydrophilic side chain. In addition, all three new probes are relatively large as compared to the commercial water-soluble labeling reagent, sulfo-NHS-LC-biotin (MW 556.59), a most commonly used chemical probe for characterizing membrane proteins. Despite the fact that our compounds possess features very different from the commercial, water-soluble labeling reagents, the present study demonstrated all three compounds can effectively label and enrich surface and membrane proteins. PIR-I was primarily used for most studies. The results from initial on-cell applications of PIR-II and III were also presented.
Optimizing cell labeling with PIR-I
SDS-PAGE and anti-biotin Western blot analysis were used for optimization of PIR-I labeling conditions and affinity purification conditions, which included compound concentration, pH of reaction buffer, reaction time, washing buffer, number of washes, lysis buffer, elution buffer used for dissociation of biotinylated proteins from the monomeric avidin column, etc. Based on observations of labeled protein intensities on SDS-PAGE and Western blot images as compared to control, we obtained the optimal conditions as follows: 1 mM PIR-I reaction concentration, 5-min reaction time at room temperature, reaction buffer using PBS buffer (pH 7.2), 5 washes of labeled cells in PBS buffer prior to cell lysis, lysis buffer including 2% NP-40 in PBS, and elution buffer for affinity purification using 8 M urea/2% SDS/5 mM d-biotin. Figure 3 shows selected results from optimization experiments. Many proteins were consistently observed for PIR-I labeled samples and not observed in parallel control samples using both SDS-PAGE (Figure 3a and 3b) and Western blot analysis (Figure 3c). Three major bands observed in the control lane (highlighted in white box in Figure 3b) were identified as acetyl-CoA carboxylase multienzyme complex (SO0840) (168 kD), acetyl-CoA carboxylase (SO1894) (76 kD), and translation elongation factor Tu (SO0217) (44 kD) with in-gel digestion and LC/MS/MS analysis. The first two proteins are endogenously biotinylated proteins which can serve as good internal control for affinity purification experiments. Protein translation elongation factor is one of the most abundant proteins in S. oneidensis cells, which was observed as contamination by others as well.33 More proteins were labeled with the use of 1 mM PIR-I than 0.1 mM PIR-I (Figure 3a). Further increasing PIR-I concentration did not show further improvement. Figure 3c shows the Western blot results of labeled cell lysate (1 mM PIR-I was used) at two different reaction times versus control cell lysates, which indicates that the labeling reaction approached completion in 5 min and further extending reaction time to 30 min did not produce more labeled proteins. We also characterized the rates of hydrolysis of the PIR-I compound at pH 3.0 and pH 7.2 and found the half-life was 8 h and 10 min, respectively (see Supplemental Figure 1). Thus, we further performed labeling experiments by adding PIR-I stock solution in DMSO multiple times to the cell suspension at another 5-min reaction time for each addition. However, multiple addition experiments did not generate significantly more labeled proteins (Figure 3b), indicating the exposed sites that can be labeled by PIR-I are close to saturation from a single reaction period. In addition, we performed anti-biotin Western blot analysis to investigate if PIR-labeled proteins were present in the PBS labeling buffer and in subsequent washing buffers after on-cell labeling. Western blot analysis of the washing solutions showed that significant levels of anti-biotin reactivity were observed in the first couple of washes after labeling. This could be the result of cell lysis during labeling or from active protein secretion by S. oneidensis cells. However, by the 3rd wash most reactivity on the Western blot was eliminated (Figure 3d). Thus, at least 5 washing steps were taken prior to cell lysis to reduce this contamination.
Figure 3.
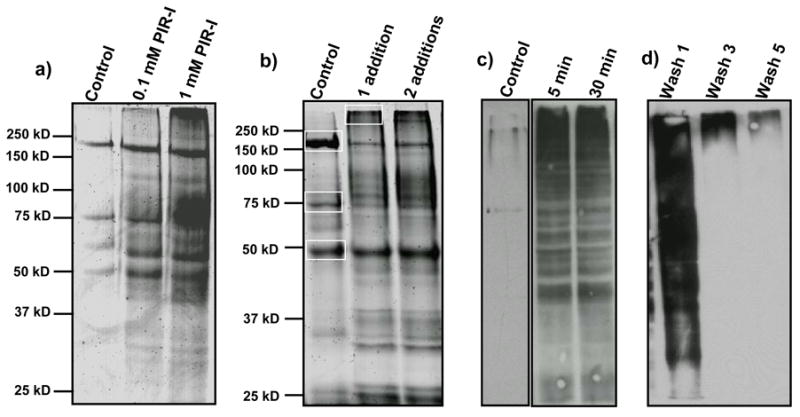
Optimization of cell labeling experiments with PIR-I. (a) SDS-PAGE of avidin-enriched proteins from control cell lysates (without PIR-I labeling) and labeled cell lysate using 0.1 mM and 1 mM PIR-I. (b) SDS-PAGE of avidin-enriched proteins from control cell lysates and labeled cell lysates prepared by adding 10 μL, 100 mM PIR-I to 1 mL cell suspension once and twice. (c) Anti-biotin Western blot image of control cell lysate and PIR-I labeled cell lysate at two reaction times: 5 min and 30 min. (d) Anti-biotin Western blot image of washing solutions after PIR-I labeling of cells.
Cell permeability of PIR-I
In most previous studies, water-soluble reagents have been used for selective labeling of cell surface membrane proteins.21,22,25,28 It is believed that the charged groups in the water soluble reagents prevent the reagents from penetrating the lipid bilayers of the membranes; therefore these reagents are considered to be membrane impermeable and primarily react with surface membrane proteins. However, in all the previous applications which employed water-soluble labeling probes, a significant proportion of cytosolic proteins (50% in average) were observed along with membrane proteins regardless of subcellular membrane enrichments and stringent washes. It was thought these cytosolic proteins could come from contamination22 or non-viable cells.28 We do not eliminate these possibilities for our case although we washed labeled cells extensively prior to cell lysis (Figure 3d). However, our PIR compound is cell membrane-permeable due to its hydrophobic nature and thus we think the identification of some cytosolic proteins is the result of labeling inside the cells. To verify this, we carried out electron microscopy (EM) imaging analysis of labeled cells. These experiments included both whole cell EM imaging and thin section EM imaging to determine if proteins on the cell membranes and in the cytoplasm were labeled with PIRs. Figure 4 illustrates EM images generated from S. oneidensis cells that were reacted with PIR and from control cells that were not treated with PIR. Anti-biotin primary antibodies and immunogold nanoparticle-conjugated secondary antibodies were used to determine if proteins were effectively labeled with PIR. Only those proteins that are PIR-labeled or endogenously biotinylated are expected to react with the anti-biotin antibody and immunogold nanoparticles to result in detected signals (dark dots in the images). Since the thin sections are much smaller than the average cell dimensions, these experiments allow the interrogation of the inside of the cells. As shown in Figure 4, the control cells exhibited very little reactivity with the immunogold nanoparticles, while the PIR-treated cells showed significant levels of reactivity on both exposed cell surfaces and thin-sections. An additional control experiment performed with PIR-labeled cells that involved the same immunogold nanoparticle treatment, but excluded the anti-biotin antibody treatment, resulted in no observed reactivity. Therefore, these data indicate that PIR-I is able to penetrate S. oneidensis cell membranes and label both cell surface proteins and cytosolic proteins in intact cells.
Figure 4.

EM immunogold detection of PIR-labeled proteins on S. oneidensis cells. (a) control cell surface; (b) PIR-labeled cell surface; (c) control cell thin section; and (d) PIR-labeled cell thin section. The bar scale in each image is 200 nm. Dark dots indicate the detection of nanoparticles. To help better visualization, white circles were used to highlight several detected nanoparticles.
Protein identification by 2D LC/MS/MS
After cell labeling using PIR-I with optimized conditions, tryptic proteolysis was performed with the enriched, biotinylated proteins from unfractionated total cell lysate. The tryptic digest was subsequently analyzed by automated 2D LC/MS/MS with a total run time of ~20 h. The peak lists from each salt step elution were extracted at the threshold of 30,000 counts. Then the peak lists from all salt steps in a single 2D LC/MS/MS analysis were compiled to give rise to final composite peak lists in a single .mgf text file, which was used for Mascot search. A total number of 367 proteins were identified with PIR-I labeling experiments from three independent sample preparations (three different batches of cell culture). Initial attempts to label cells with PIR-II and PIR-III compounds using the conditions optimized for PIR-I also resulted in significant amount of proteins identified from a single sample preparation, which were 187 and 163, respectively. Overall, 410 unique proteins were identified from all three compound labeling experiments. A complete list of proteins identified from PIR-I, II, and III labeling experiments is provided in Supplemental Table 1, Table 2, and Table 3, respectively. These results are tabulated according to protein identification guidelines suggested by Bradshaw et al..34 For those proteins and peptides identified more than once, the maximum protein or peptide score and corresponding expect value were reported. Note that we further performed the searches against NCBI human database which has approximately 146,000 protein sequences with all the other parameters remaining the same. On the basis of the same criteria described above, most searches produced no positive protein hits and some searches resulted in identifications of various forms of keratins, which were commonly observed contaminations introduced during sample preparations.
Characterizing the identified proteins
We first analyzed all 410 identified proteins based on their subcellular locations. PSORTb v.2.035 (http://www.psort.org/psortb/index.html) and CELLO v.2.536 (http://cello.life.nctu.edu.tw/) programs were used to help classify protein subcellular locations. The pie chart representation of the distribution of all 410 identified proteins in S. oneidensis cells is shown in Figure 5. Among the total identified proteins, 174 (42%) proteins are the constituents of cell envelope proteins including: 64 (16%) outer membrane proteins, 39 (10%) periplasmic proteins, 64 (16%) inner membrane proteins, and 7 (2%) extracellular proteins. Of the cell envelope proteins, 56 (32%) proteins are predicted to be integral membrane proteins with transmembrane domains ranging from 1 to 15 by using TMHMM Server v. 2.0 (http://www.cbs.dtu.dk/services/TMHMM/).37 Cytochrome c-type biogenesis protein CcmF (ccmF-1) (SO0266) has 15 TMDs and it was identified with 2 unique peptides. It should be noted that TMHMM program can only predict integral proteins that have α-helices. However in gram-negative bacteria, the integral inner membrane proteins primarily consist of α-helices while integral outer membrane proteins generally have multiple β-strands which form β-barrels.38,39 Many proteins identified from our PIR labeling experiments are known to have transmembrane β-barrels such as OmpA family protein40 (SO3545) and outer membrane porin proteins41 (SO1821) and (SO3896). Therefore, the total number of identified integral membrane proteins is underrepresented by the bioinformatics methods mentioned above. In summary, a select subset of cell envelope proteins is presented in Table 1. Other proteins include 42% cytosolic proteins, 3% membrane-associated proteins, and 12% unclassified proteins. Out of all the identified cytosolic proteins, some may be due to contamination of abundant proteins as also reported by others, but a majority of them are the result of PIR labeling as shown in Figure 4d.
Figure 5.

Pie diagram representation of the subcellular locations of 410 identified proteins.
Table 1.
Select subset of the identified cell envelope proteins in S. oneidensis.
| Accessiona | Protein Description | MW (Da) | Scoreb | Locc | TMDsd |
|---|---|---|---|---|---|
| SO0004 | inner membrane protein, 60 kDa | 60469 | 59 | IM | 5 |
| SO0108 | conserved hypothetical protein | 44635 | 60 | IM | 10 |
| SO0162 | phosphoenolpyruvate carboxykinase (ATP) (pckA) | 56190 | 103 | P | 0 |
| SO0251 | preprotein translocase, SecY subunit (secY) | 48709 | 178 | IM | 10 |
| SO0265 | conserved hypothetical protein | 45291 | 60 | IM | 2 |
| SO0266 | cytochrome c-type biogenesis protein CcmF (ccmF-1) | 72323 | 53 | IM | 15 |
| SO0347 | acyltransferase family protein | 34624 | 37 | IM | 1 |
| SO0404 | hypothetical protein | 129383 | 713 | OM | 0 |
| SO0405 | transcription termination factor Rho (rho) | 47189 | 196 | IM | 0 |
| SO0424 | pyruvate dehydrogenase complex, E1 component (aceE) | 99781 | 320 | IM | 0 |
| SO0426 | pyruvate dehydrogenase complex, E3 component (lpdA) | 50733 | 599 | IM | 0 |
| SO0578 | hypothetical protein | 88218 | 36 | OM | 1 |
| SO0605 | hflK protein (hflK) | 42627 | 272 | OM | 1 |
| SO0606 | hflC protein (hflC) | 33184 | 166 | OM | 1 |
| SO0609 | ubiquinol-cytochrome c reductase, cytochrome b (petB) | 45979 | 38 | IM | 10 |
| SO0610 | ubiquinol-cytochrome c reductase, cytochrome c1 (petC) | 26071 | 35 | OM | 1 |
| SO0719 | TonB-dependent receptor, putative | 84248 | 298 | OM | 0 |
| SO0815 | TonB-dependent receptor C-terminal domain protein | 71571 | 299 | OM | 0 |
| SO0904 | NADH:ubiquinone oxidoreductase, Na translocating, γ subunit (nqrC-1) | 29153 | 35 | IM | 1 |
| SO0970 | fumarate reductase flavoprotein subunit precursor | 62865 | 206 | P | 0 |
| SO1016 | NADH dehydrogenase I, G subunit (nuoG) | 101099 | 159 | P | 0 |
| SO1065 | FKBP-type peptidyl-prolyl cis-trans isomerase FkpA (fkpA) | 27741 | 203 | OM | 0 |
| SO1066 | extracellular nuclease | 93863 | 61 | OM | 1 |
| SO1103 | NADH:ubiquinone oxidoreductase, Na translocating, α subunit (nqrA-2) | 47999 | 506 | IM | 0 |
| SO1108 | NADH:ubiquinone oxidoreductase, Na translocating, β subunit (nqrF-2) | 46573 | 77 | IM | 1 |
| SO1197 | cell division protein FtsH (ftsH) | 71353 | 293 | IM | 2 |
| SO1201 | preprotein translocase, SecG subunit (secG) | 11554 | 100 | IM | 2 |
| SO1295 | major outer membrane lipoprotein, putative | 9235 | 122 | OM | 0 |
| SO1424 | hypothetical protein | 83796 | 115 | OM | 0 |
| SO1429 | anaerobic dimethyl sulfoxide reductase, A subunit (dmaA-1) | 91916 | 1045 | P | 0 |
| SO1482 | TonB-dependent receptor, putative | 90371 | 137 | OM | 0 |
| SO1580 | TonB-dependent heme receptor | 82653 | 52 | OM | 0 |
| SO1642 | lipid A disaccharide synthase (lpxB) | 42832 | 47 | IM | 1 |
| SO1682 | 3-hydroxyisobutyrate dehydrogenase (mmsB) | 31085 | 288 | P | 0 |
| SO1683 | 3-oxoacyl-(acyl-carrier-protein) reductase, putative | 26564 | 41 | IM | 1 |
| SO1776 | outer membrane protein precursor MtrB (mtrB) | 77743 | 694 | OM | 0 |
| SO1778 | decaheme cytochrome c (omcB) | 72503 | 433 | OM | 0 |
| SO1779 | decaheme cytochrome c (omcA) | 79992 | 4484 | OM | 0 |
| SO1798 | peptidyl-prolyl cis-trans isomerase D (ppiD) | 67456 | 63 | P | 1 |
| SO1825 | MotA/TolQ/ExbB proton channel family protein | 48740 | 591 | IM | 3 |
| SO1826 | TonB system transport protein ExbB2 (exbB2) | 18104 | 177 | IM | 3 |
| SO1827 | TonB system transport protein ExbD2 (exbD2) | 14602 | 38 | IM | 1 |
| SO1829 | TPR domain protein | 46578 | 68 | OM | 1 |
| SO1896 | 3-methylcrotonyl CoA carboxylase, beta subunit (pccB-1) | 58462 | 326 | IM | 0 |
| SO1928 | succinate dehydrogenase, flavoprotein subunit (sdhA) | 64872 | 131 | IM | 0 |
| SO1930 | 2-oxoglutarate dehydrogenase, E1 component (sucA) | 105483 | 324 | IM | 0 |
| SO1931 | 2-oxoglutarate dehydrogenase, E2 component (sucB) | 42804 | 297 | IM | 0 |
| SO2001 | 5-nucleotidase (ushA) | 61353 | 602 | P | 0 |
| SO2361 | cytochrome c oxidase, cbb3-type, subunit III (ccoP) | 35338 | 72 | OM | 2 |
| SO2363 | cytochrome c oxidase, cbb3-type, subunit II (ccoO) | 23530 | 150 | OM | 1 |
| SO2397 | oxidoreductase, short-chain dehydrogenase/reductase family | 28477 | 165 | IM | 1 |
| SO2427 | TonB-dependent receptor, putative | 92130 | 63 | OM | 1 |
| SO2469 | conserved hypothetical protein | 97928 | 55 | OM | 1 |
| SO2492 | oxidoreductase, acyl-CoA dehydrogenase family | 83772 | 154 | IM | 1 |
| SO2593 | conserved hypothetical protein | 183017 | 2401 | OM | 0 |
| SO2629 | isocitrate dehydrogenase, NADP-dependent (icd) | 80679 | 180 | P | 0 |
| SO2796 | conserved hypothetical protein | 117008 | 56 | OM | 1 |
| SO2881 | superoxide dismutase, Fe (sodB) | 21539 | 152 | E | 0 |
| SO2886 | Na+/H+ antiporter (nhaB) | 58506 | 33 | IM | 9 |
| SO2907 | TonB-dependent receptor domain protein | 95930 | 236 | OM | 1 |
| SO2912 | formate acetyltransferase (pflB) | 85205 | 289 | IM | 0 |
| SO2916 | phosphate acetyltransferase (pta) | 78203 | 102 | IM | 1 |
| SO3111 | protein-export membrane protein SecD (secD-2) | 66508 | 251 | IM | 6 |
| SO3157 | lipoprotein, putative | 26308 | 161 | OM | 0 |
| SO3190 | polysaccharide biosynthesis protein | 47603 | 103 | IM | 1 |
| SO3193 | polysaccharide biosynthesis protein | 100313 | 68 | OM | 1 |
| SO3286 | cytochrome d ubiquinol oxidase, subunit I (cydA) | 58135 | 402 | IM | 9 |
| SO3310 | conserved hypothetical protein | 22261 | 49 | P | 1 |
| SO3340 | conserved hypothetical protein | 29984 | 149 | IM | 3 |
| SO3441 | CTP synthase (pyrG) | 60453 | 92 | IM | 1 |
| SO3545 | OmpA family protein | 40271 | 159 | OM | 0 |
| SO3669 | heme transport protein (hugA) | 76438 | 177 | OM | 0 |
| SO3690 | ABC transporter, permease protein | 44303 | 34 | IM | 4 |
| SO3706 | NupC family protein | 44460 | 72 | IM | 10 |
| SO3772 | conserved hypothetical protein | 20142 | 76 | OM | 1 |
| SO3779 | ABC transporter, ATP-binding protein CydC (cydC) | 64719 | 49 | IM | 6 |
| SO3780 | ABC transporter, ATP-binding protein CydD (cydD) | 70547 | 58 | IM | 6 |
| SO3844 | peptidase, M13 family | 77272 | 79 | P | 0 |
| SO3870 | disulfide bond formation protein | 24278 | 34 | IM | 4 |
| SO3896 | outer membrane porin, putative | 39874 | 509 | OM | 0 |
| SO3906 | conserved hypothetical protein | 35988 | 39 | OM | 1 |
| SO3942 | serine protease, HtrA/DegQ/DegS family | 46522 | 329 | P | 1 |
| SO3952 | mce-related protein | 16919 | 78 | OM | 1 |
| SO4012 | hypothetical protein | 10465 | 34 | IM | 1 |
| SO4077 | TonB-dependent receptor, putative | 78344 | 98 | OM | 0 |
| SO4105 | MSHA pilin protein MshA (mshA) | 17759 | 67 | OM | 1 |
| SO4202 | Sec-independent protein translocase protein TatA (tatA) | 9333 | 61 | E | 1 |
| SO4215 | cell division protein FtsZ (ftsZ) | 40910 | 133 | P | 0 |
| SO4473 | outer membrane protein, putative | 20074 | 104 | OM | 0 |
| SO4513 | formate dehydrogenase, alpha subunit | 106403 | 122 | P | 0 |
| SO4557 | methyl-accepting chemotaxis protein | 67264 | 157 | IM | 2 |
| SO4602 | glycerol-3-phosphate acyltransferase (plsB) | 91846 | 133 | IM | 0 |
| SO4719 | conserved hypothetical protein | 29348 | 131 | P | 0 |
| SOA0048 | prolyl oligopeptidase family protein | 72242 | 72 | P | 1 |
| SOA0099 | conserved hypothetical protein | 63665 | 164 | P | 0 |
| SOA0106 | methyl-accepting chemotaxis protein | 59803 | 49 | IM | 2 |
| SOA0161 | zinc-binding dehydrogenase | 40772 | 48 | IM | 1 |
Accession no of proteins according to TIGR annotation (http://www.tigr.org/).
Mascot protein score.
Subcellular location. E denotes extracellular; IM denotes inner membrane; OM denotes outer membrane; and P denotes periplasmic.
Predicted number of transmembrane helices according to TMHMM (http://www.cbs.dtu.dk/services/TMHMM/).
We further grouped the proteins identified in this study in their corresponding functional categories using the “clusters of orthologous groups of proteins” (COG) classification systems (http://www.ncbi.nlm.nih.gov/sutils/coxik.cgi?gi=261).42,43 The pie chart diagram of COG classification of all 410 proteins is shown in Figure 6. We have identified proteins in all functional categories including information storage and processing, cellular processes, and metabolism. The identified proteins involved in translation (J) are in the largest group which includes 66 proteins, corresponding to 17% of the total identified proteins. The second largest group was energy production and conversion (C) consisting of 55 proteins (14% of total identified proteins). The proportions of identified proteins in group J and C both significantly exceed their corresponding proportions in entire genome of S. oneidensis, which are 5% and 4%, respectively. This could be due to high abundance of proteins in these two groups. However, approximately three-fold enrichment of these two groups of proteins also suggests their high accessibility to our labeling probes. Another major category of proteins is cell wall/membrane biogenesis (M) including approximately 8% of total identified proteins (30 proteins), which is twice as high as its corresponding percentage in the whole genome (~4%). Cell wall and biogenesis proteins are primarily composed of cell envelope proteins, thus these appear highly accessible to labeling reagents.
Figure 6.

Pie diagram representation of 410 identified proteins, classified by COG functional category.
Discussion
Biotinylation of exposed residues in proteins has become a useful tool for enriching and profiling low-abundance membrane proteins. Water-soluble reagents are commonly employed in most applications since presumably these reagents are cell-impermeable and thus, only react with exposed regions of proteins on cell surface. However, in addition to successful identification of large proportion of cell surface proteins with water-soluble reagents, significant amount of cytosolic proteins are also observed in spite of subcellular membrane enrichment and stringent washes.27,28 In this report, we present the first application of hydrophobic labeling probes for extensive profiling membrane proteins. All three biotin-tagged probes used in this research allow efficient labeling and enrichment of a large fraction of membrane proteins with minimal need for sample preparation. In the present study, unfractionated total cell lysate was directly subjected to affinity purification to enrich biotinylated proteins after intact cell labeling. In summary, we identified 410 unique proteins in S. oneidensis with the use of three PIR compounds. Of these, approximately 42% of proteins are cell envelope proteins located in all three membrane regions of the cells. In particular, out of 174 cell envelope proteins identified, approximately 41% are cell surface proteins including both extracellular and outer membrane proteins. Since all three PIR compounds are highly hydrophobic, we speculate after cell penetration, these compounds probably remain closely associated with the lipid bilayers of the membranes, or sub-organelle membranes rather than the hydrophilic environment of the cytoplasm. Thus, it is very likely that these compounds preferentially react with membrane proteins or proteins associated with membranes. Another point worth mentioning is that the three PIR probes used in this study do have slightly different structures and hydrophobicities, which could lead to different labeling selectivity. We found 23 proteins were identified only from PIR-II labeling experiments and 15 proteins were unique to PIR-III labeling. However, these comparisons are only preliminary in the current study since the labeling conditions were not individually optimized for PIR-II and PIR-III. In addition, variations could occur from different batches of cell cultures as observed by us as well as others.25,28
It is believed that cell envelope proteins, especially the cell surface proteins, play a critical role in electron transfer and metal reduction in S. oneidensis. Recently, Giometti et al.44 and Ruebush et al.45 reported the results from 2D SDS-PAGE analysis of isolated membrane fractions in S. oneidensis. Nearly all the membrane proteins observed in their studies were repeatedly observed in our study as well. For example, among the 21 membrane proteins reported in Ruebush’s study,45 we observed 18 of them such as outer membrane precursor MtrB (SO1776), TonB-dependent receptor (SO2907), OmpA family protein (SO3545), and peptidase M13 family (SO0429). In addition, all three membrane proteins in the membrane fraction reported in Giometti’s study,44 i.e., periplasmic nitrate reductase (napA) (SO0848), periplasmic glucan biosynthesis protein (SO1051), and fumarate reductase (SO0790), were also observed in our study with high Mascot scores. In addition, we have identified a large number of membrane proteins that are ascribed to energy production and conversion category by COG, such as cytochrome c oxidase (SO2361 and SO 2363), ATP synthase (SO4747, SO4748, and SO4749), NADH: ubiquinone oxidoreductase (SO0904, SO1103, and SO1108), ABC transporter (ATP-binding protein) (SO3779 and SO3780), etc. Other proteins we observed such as outer membrane cytochromes OmcA (SO1779) and OmcB (SO1778) have been reported to be exposed on the outer membrane surfaces to allow direct electron transfer to extracellular electron acceptors;46 and outer membrane protein MtrB (SO1776) is required for proper localization of OmcA and OmcB to the outer membrane of the cells.47 Very recently Shi et al. reported that OmcA and OmcB form a complex to facilitate electron transport in S. oneidensis.48 In our experiments using SDS-PAGE separation of affinity purified, PIR labeled cell lysate, we repeatedly observed high MW (> 250 kD) bands as highlighted in the white box in Figure 3b. In-gel digestion and LC/MS/MS analysis identified both OmcA (MW 80 kD) and OmcB (MW 73 kD) proteins in this band. Since our PIR probes do possess cross-linking capabilities, observation of both OmcA and OmcB in the high MW band indicates cross-linking of these two interacting proteins as well as other proteins in the complex. However, further experiments need to be performed to validate these results. Taken together, biotinylation of intact cells with our compounds showed great promise for efficient labeling cell surface proteins and membrane proteins. To our knowledge, this report represents the most extensive profiling of the membrane proteome of S. oneidensis cells.
In addition to membrane protein labeling, the cell-permeable nature of these PIR probes allows concurrent labeling proteins in the cytoplasm as verified by immuno-gold EM experiments (Figure 4d). In our study, approximately 42% of the identified proteins are cytosolic proteins. Some of these cytosolic proteins are probably the results of contamination, as also observed by others.27,28 However we believe a majority of these cytosolic proteins are the consequence of labeling reactions that occurred after PIR compounds penetrate into the cells. As mentioned above, we speculate that after penetration, most PIR compounds likely remain close to the inner surface of the inner membranes or sub-organelle membranes such as endoplasmic reticulum membranes instead of hydrophilic environment of cytoplasm. Thus, labeling soluble proteins is most likely to occur when cytosolic proteins are in proximity to membranes or when they interact with membranes. For example, we have identified ~72% (39 identified, 54 total in entire genome) of the ribosomal proteins in S. oneidensis. It is known that ribosomes interact with membrane-bound receptors to facilitate translocation of membrane proteins and secretory proteins.49
In summary, we present the first demonstration of extensive analysis of membrane proteins using low water-solubility labeling probes. With application of these hydrophobic, novel chemical probes to S. oneidensis cell systems, we identified large proportion of cell envelope proteins with minimal sample preparation requirement. These probes can be extendable to other types of cells and organisms, or a particular subgroup of proteins of interest such as inner membrane proteins and outer membrane proteins, with the aid of subcellular fractionation. Moreover, these chemical probes can be modified to include stable isotope for quantitative measurement of changes occurring on cell surfaces and membranes with response to specific perturbations.
Supplementary Material
Measured hydrolysis of PIR-I in 0.1% formic acid solution (pH 3.0) (a) and in PBS buffer (pH 7.2) (b). Half life for hydrolysis at this pH 3.0 and pH 7.2 is approximately 8 h and 10 min, respectively.
Acknowledgments
We thank Nikola Tolic and Gordon A. Anderson (PNNL) for support of data sorting and formatting. This research was supported by the Office of Science (BER), U.S. Department of Energy, Grant No. DE-FG02-04ER63924.
References
- 1.Wallin E, von Heijne G. Genome-wide analysis of integral membrane proteins from eubacterial, archaean, and eukaryotic organisms. Protein Sci. 1998;7:1029–1038. doi: 10.1002/pro.5560070420. [DOI] [PMC free article] [PubMed] [Google Scholar]
- 2.Stevens TJ, Arkin IT. Do more complex organisms have a greater proportion of membrane proteins in their genomes? Proteins. 2000;39:417–420. doi: 10.1002/(sici)1097-0134(20000601)39:4<417::aid-prot140>3.0.co;2-y. [DOI] [PubMed] [Google Scholar]
- 3.Reiss T. Drug discovery of the future: the implications of the human genome project. Trends Biotechnol. 2001;19:496–499. doi: 10.1016/s0167-7799(01)01811-x. [DOI] [PubMed] [Google Scholar]
- 4.Hopkins AL, Groom CR. The druggable genome. Nat Rev Drug Discov. 2002;1:727–730. doi: 10.1038/nrd892. [DOI] [PubMed] [Google Scholar]
- 5.Venkateswaran K, Moser DP, Dollhopf ME, Lies DP, Saffarini DA, et al. Polyphasic taxonomy of the genus Shewanella and description of Shewanella oneidensis sp. nov. Int J Syst Bacteriol. 1999;49(Pt 2):705–724. doi: 10.1099/00207713-49-2-705. [DOI] [PubMed] [Google Scholar]
- 6.Beliaev AS, Thompson DK, Khare T, Lim H, Brandt CC, et al. Gene and protein expression profiles of Shewanella oneidensis during anaerobic growth with different electron acceptors. Omics. 2002;6:39–60. doi: 10.1089/15362310252780834. [DOI] [PubMed] [Google Scholar]
- 7.Heidelberg JF, Paulsen IT, Nelson KE, Gaidos EJ, Nelson WC, et al. Genome sequence of the dissimilatory metal ion-reducing bacterium Shewanella oneidensis. Nat Biotechnol. 2002;20:1118–1123. doi: 10.1038/nbt749. [DOI] [PubMed] [Google Scholar]
- 8.Myers CR, Myers JM. Localization of cytochromes to the outer membrane of anaerobically grown Shewanella putrefaciens MR-1. J Bacteriol. 1992;174:3429–3438. doi: 10.1128/jb.174.11.3429-3438.1992. [DOI] [PMC free article] [PubMed] [Google Scholar]
- 9.Blonder J, Terunuma A, Conrads TP, Chan KC, Yee C, et al. A proteomic characterization of the plasma membrane of human epidermis by high-throughput mass spectrometry. J Invest Dermatol. 2004;123:691–699. doi: 10.1111/j.0022-202X.2004.23421.x. [DOI] [PubMed] [Google Scholar]
- 10.Simpson RJ, Connolly LM, Eddes JS, Pereira JJ, Moritz RL, et al. Proteomic analysis of the human colon carcinoma cell line (LIM 1215): development of a membrane protein database. Electrophoresis. 2000;21:1707–1732. doi: 10.1002/(SICI)1522-2683(20000501)21:9<1707::AID-ELPS1707>3.0.CO;2-Q. [DOI] [PubMed] [Google Scholar]
- 11.Washburn MP, Wolters D, Yates JR., 3rd Large-scale analysis of the yeast proteome by multidimensional protein identification technology. Nat Biotechnol. 2001;19:242–247. doi: 10.1038/85686. [DOI] [PubMed] [Google Scholar]
- 12.Blonder J, Goshe MB, Moore RJ, Pasa-Tolic L, Masselon CD, et al. Enrichment of integral membrane proteins for proteomic analysis using liquid chromatography-tandem mass spectrometry. J Proteome Res. 2002;1:351–360. doi: 10.1021/pr0255248. [DOI] [PubMed] [Google Scholar]
- 13.Han DK, Eng J, Zhou H, Aebersold R. Quantitative profiling of differentiation-induced microsomal proteins using isotope-coded affinity tags and mass spectrometry. Nat Biotechnol. 2001;19:946–951. doi: 10.1038/nbt1001-946. [DOI] [PMC free article] [PubMed] [Google Scholar]
- 14.Bunai K, Yamane K. Effectiveness and limitation of two-dimensional gel electrophoresis in bacterial membrane protein proteomics and perspectives. J Chromatogr B Analyt Technol Biomed Life Sci. 2005;815:227–236. doi: 10.1016/j.jchromb.2004.08.030. [DOI] [PubMed] [Google Scholar]
- 15.Schluesener D, Fischer F, Kruip J, Rogner M, Poetsch A. Mapping the membrane proteome of Corynebacterium glutamicum. Proteomics. 2005;5:1317–1330. doi: 10.1002/pmic.200400993. [DOI] [PubMed] [Google Scholar]
- 16.Zahedi RP, Meisinger C, Sickmann A. Two-dimensional benzyldimethyl-n-hexadecylammonium chloride/SDS-PAGE for membrane proteomics. Proteomics. 2005;5:3581–3588. doi: 10.1002/pmic.200401214. [DOI] [PubMed] [Google Scholar]
- 17.MacCoss MJ, McDonald WH, Saraf A, Sadygov R, Clark JM, et al. Shotgun identification of protein modifications from protein complexes and lens tissue. Proc Natl Acad Sci U S A. 2002;99:7900–7905. doi: 10.1073/pnas.122231399. [DOI] [PMC free article] [PubMed] [Google Scholar]
- 18.Wu CC, MacCoss MJ, Howell KE, Yates JR., 3rd A method for the comprehensive proteomic analysis of membrane proteins. Nat Biotechnol. 2003;21:532–538. doi: 10.1038/nbt819. [DOI] [PubMed] [Google Scholar]
- 19.Sabarth N, Lamer S, Zimny-Arndt U, Jungblut PR, Meyer TF, et al. Identification of surface proteins of Helicobacter pylori by selective biotinylation, affinity purification, and two-dimensional gel electrophoresis. J Biol Chem. 2002;277:27896–27902. doi: 10.1074/jbc.M204473200. [DOI] [PubMed] [Google Scholar]
- 20.Shin BK, Wang H, Yim AM, Le Naour F, Brichory F, et al. Global profiling of the cell surface proteome of cancer cells uncovers an abundance of proteins with chaperone function. J Biol Chem. 2003;278:7607–7616. doi: 10.1074/jbc.M210455200. [DOI] [PubMed] [Google Scholar]
- 21.Jang JH, Hanash S. Profiling of the cell surface proteome. Proteomics. 2003;3:1947–1954. doi: 10.1002/pmic.200300563. [DOI] [PubMed] [Google Scholar]
- 22.Zhang W, Zhou G, Zhao Y, White MA. Affinity enrichment of plasma membrane for proteomics analysis. Electrophoresis. 2003;24:2855–2863. doi: 10.1002/elps.200305569. [DOI] [PubMed] [Google Scholar]
- 23.Zhao Y, Zhang W, White MA. Capillary high-performance liquid chromatography/mass spectrometric analysis of proteins from affinity-purified plasma membrane. Anal Chem. 2003;75:3751–3757. doi: 10.1021/ac034184m. [DOI] [PubMed] [Google Scholar]
- 24.Goshe MB, Blonder J, Smith RD. Affinity labeling of highly hydrophobic integral membrane proteins for proteome-wide analysis. J Proteome Res. 2003;2:153–161. doi: 10.1021/pr0255607. [DOI] [PubMed] [Google Scholar]
- 25.Chen WN, Yu LR, Strittmatter EF, Thrall BD, Camp DG, 2nd, et al. Detection of in situ labeled cell surface proteins by mass spectrometry: application to the membrane subproteome of human mammary epithelial cells. Proteomics. 2003;3:1647–1651. doi: 10.1002/pmic.200300468. [DOI] [PubMed] [Google Scholar]
- 26.Gauthier DJ, Gibbs BF, Rabah N, Lazure C. Utilization of a new biotinylation reagent in the development of a nondiscriminatory investigative approach for the study of cell surface proteins. Proteomics. 2004;4:3783–3790. doi: 10.1002/pmic.200300860. [DOI] [PubMed] [Google Scholar]
- 27.Zhao Y, Zhang W, Kho Y. Proteomic analysis of integral plasma membrane proteins. Anal Chem. 2004;76:1817–1823. doi: 10.1021/ac0354037. [DOI] [PubMed] [Google Scholar]
- 28.Nunomura K, Nagano K, Itagaki C, Taoka M, Okamura N, et al. Cell surface labeling and mass spectrometry reveal diversity of cell surface markers and signaling molecules expressed in undifferentiated mouse embryonic stem cells. Mol Cell Proteomics. 2005;4:1968–1976. doi: 10.1074/mcp.M500216-MCP200. [DOI] [PubMed] [Google Scholar]
- 29.Bradburne JA, Godfrey P, Choi JH, Mathis JN. In vivo labeling of Escherichia coli cell envelope proteins with N-hydroxysuccinimide esters of biotin. Appl Environ Microbiol. 1993;59:663–668. doi: 10.1128/aem.59.3.663-668.1993. [DOI] [PMC free article] [PubMed] [Google Scholar]
- 30.Chowdhury SM, Munske GR, Tang X, Bruce JE. CAD and ECD of Several Mass Spectrometry-Identifiable Chemical Cross-Linkers. Anal Chem. 2006 doi: 10.1021/ac060789h. accepted. [DOI] [PubMed] [Google Scholar]
- 31.Perkins DN, Pappin DJ, Creasy DM, Cottrell JS. Probability-based protein identification by searching sequence databases using mass spectrometry data. Electrophoresis. 1999;20:3551–3567. doi: 10.1002/(SICI)1522-2683(19991201)20:18<3551::AID-ELPS3551>3.0.CO;2-2. [DOI] [PubMed] [Google Scholar]
- 32.Tang X, Munske GR, Siems WF, Bruce JE. Mass spectrometry identifiable cross-linking strategy for studying protein-protein interactions. Anal Chem. 2005;77:311–318. doi: 10.1021/ac0488762. [DOI] [PubMed] [Google Scholar]
- 33.Mayer MU, Shi L, Squier TC. One-step, non-denaturing isolation of an RNA polymerase enzyme complex using an improved multi-use affinity probe resin. Molecular BioSystems. 2005;1:53–56. doi: 10.1039/b500950b. [DOI] [PubMed] [Google Scholar]
- 34.Bradshaw RA, Burlingame AL, Carr S, Aebersold R. Protein Identification: The Good, the Bad, and the Ugly. Mol Cell Proteomics. 2005;4:1221–1222. [PubMed] [Google Scholar]
- 35.Gardy JL, Laird MR, Chen F, Rey S, Walsh CJ, et al. PSORTb v.2.0: expanded prediction of bacterial protein subcellular localization and insights gained from comparative proteome analysis. Bioinformatics. 2005;21:617–623. doi: 10.1093/bioinformatics/bti057. [DOI] [PubMed] [Google Scholar]
- 36.Yu CS, Lin CJ, Hwang JK. Predicting subcellular localization of proteins for Gram-negative bacteria by support vector machines based on n-peptide compositions. Protein Sci. 2004;13:1402–1406. doi: 10.1110/ps.03479604. [DOI] [PMC free article] [PubMed] [Google Scholar]
- 37.Krogh A, Larsson B, von Heijne G, Sonnhammer EL. Predicting transmembrane protein topology with a hidden Markov model: application to complete genomes. J Mol Biol. 2001;305:567–580. doi: 10.1006/jmbi.2000.4315. [DOI] [PubMed] [Google Scholar]
- 38.Schulz GE. [beta]-Barrel membrane proteins. Current Opinion in Structural Biology. 2000;10:443–447. doi: 10.1016/s0959-440x(00)00120-2. [DOI] [PubMed] [Google Scholar]
- 39.Tamm LK, Arora A, Kleinschmidt JH. Structure and Assembly of beta -Barrel Membrane Proteins. J Biol Chem. 2001;276:32399–32402. doi: 10.1074/jbc.R100021200. [DOI] [PubMed] [Google Scholar]
- 40.Pautsch A, Schulz GE. High-resolution structure of the OmpA membrane domain. Journal of Molecular Biology. 2000;298:273–282. doi: 10.1006/jmbi.2000.3671. [DOI] [PubMed] [Google Scholar]
- 41.Saier MH., Jr A Functional-Phylogenetic Classification System for Transmembrane Solute Transporters. Microbiol Mol Biol Rev. 2000;64:354–411. doi: 10.1128/mmbr.64.2.354-411.2000. [DOI] [PMC free article] [PubMed] [Google Scholar]
- 42.Tatusov RL, Koonin EV, Lipman DJ. A genomic perspective on protein families. Science. 1997;278:631–637. doi: 10.1126/science.278.5338.631. [DOI] [PubMed] [Google Scholar]
- 43.Tatusov R, Fedorova N, Jackson J, Jacobs A, Kiryutin B, et al. The COG database: an updated version includes eukaryotes. BMC Bioinformatics. 2003;4:41. doi: 10.1186/1471-2105-4-41. [DOI] [PMC free article] [PubMed] [Google Scholar]
- 44.Giometti CS, Khare T, Tollaksen SL, Tsapin A, Zhu W, et al. Analysis of the Shewanella oneidensis proteome by two-dimensional gel electrophoresis under nondenaturing conditions. Proteomics. 2003;3:777–785. doi: 10.1002/pmic.200300406. [DOI] [PubMed] [Google Scholar]
- 45.Ruebush SS, Brantley SL, Tien M. Reduction of soluble and insoluble iron forms by membrane fractions of Shewanella oneidensis grown under aerobic and anaerobic conditions. Appl Environ Microbiol. 2006;72:2925–2935. doi: 10.1128/AEM.72.4.2925-2935.2006. [DOI] [PMC free article] [PubMed] [Google Scholar]
- 46.Meyer TE, Tsapin AI, Vandenberghe I, de Smet L, Frishman D, et al. Identification of 42 possible cytochrome C genes in the Shewanella oneidensis genome and characterization of six soluble cytochromes. Omics. 2004;8:57–77. doi: 10.1089/153623104773547499. [DOI] [PubMed] [Google Scholar]
- 47.Myers CR, Myers JM. MtrB is required for proper incorporation of the cytochromes OmcA and OmcB into the outer membrane of Shewanella putrefaciens MR-1. Appl Environ Microbiol. 2002;68:5585–5594. doi: 10.1128/AEM.68.11.5585-5594.2002. [DOI] [PMC free article] [PubMed] [Google Scholar]
- 48.Shi L, Chen B, Wang Z, Elias DA, Mayer MU, et al. Isolation of high-affinity functional protein complex between OmcA and MtrC: two outer membrane decaheme c-type cytochromes of Shewanella oneidensis MR-1. Journal of Bacteriology. 2006;188:4705–4714. doi: 10.1128/JB.01966-05. [DOI] [PMC free article] [PubMed] [Google Scholar]
- 49.Luirink J, Sinning I. SRP-mediated protein targeting: structure and function revisited. Biochimica et Biophysica Acta (BBA) Molecular Cell Research Protein Export/Secretion in Bacteria. 2004;1694:17–35. doi: 10.1016/j.bbamcr.2004.03.013. [DOI] [PubMed] [Google Scholar]
Associated Data
This section collects any data citations, data availability statements, or supplementary materials included in this article.
Supplementary Materials
Measured hydrolysis of PIR-I in 0.1% formic acid solution (pH 3.0) (a) and in PBS buffer (pH 7.2) (b). Half life for hydrolysis at this pH 3.0 and pH 7.2 is approximately 8 h and 10 min, respectively.