A mechanistic understanding of enzymatic and electron transfer processes catalyzed by transition metal-containing proteins depends crucially on identification of the oxidation states of the participating redox centers. This information is typically obtained through various spectroscopic techniques, while X-ray crystallography provides the basic structural information but remains blind towards the subtle differences of one or two electrons that distinguish a reduced from an oxidized state. One spectroscopic method sensitive to oxidation state is X-ray absorption spectroscopy (XAS); although the position of an X-ray absorption edge depends primarily on the element and coordination environment, it is also sensitive to oxidation state, since oxidation will shift the absorption edge to higher energy, as each of the remaining electrons experiences an increased interaction with the unchanged nuclear charge. For example, the edge positions between ferrous and ferric iron in various compounds can shift by approximately +1 to +5 eV.1–3 Due to spectral overlap, assignment of oxidation states to specific centers by XAS can be problematic for complex metalloproteins containing multiple copies of a given metal.
Absorption effects contribute to a wavelength dependence of the atomic scattering factor for X-rays, f(λ), according to
where Δf′(λ) and Δf″(λ), related by a Kramers-Kronig transformation4, correspond to the respective real (dispersive) and imaginary (absorption) corrections to the scattering factor f 0 that would be observed in the absence of absorption effects. These wavelength dependent effects are commonly referred to as “anomalous scattering”, although it has been noted that there is nothing “anomalous” about this effect as it is indeed the normal state of affairs.4 In macromolecular crystallography, the wavelength dependence of the scattering factors is routinely used to identify substructures of scatterers for solving the phase problem and calculate electron density maps. The information contained in the detailed structure and position of the absorption edge is typically not utilized. As described by Coppens et al., however, if data sets are collected at suitably spaced energies around the absorption edge, it is possible to refine values of Δf′ and Δf″ for the individual scatterers of the element in question and derive the X-ray absorption curve for each individual atom, thereby allowing the individual oxidation states to be deduced.5
The complex structure factor can be calculated as a summation over all individual atomic scattering factors fm, for m atoms in the crystal unit cell and it may be expressed as an amplitude |F| and a phase angle α or by its real and imaginary components, A and B:
where r⃗ and h⃗ are positional vectors in real and reciprocal space, respectively.
The contributions of n absorbing (“heavy”) atoms to the overall structure factor at a given wavelength, highlighting the effects of variations in Δf′(λ) and Δf″(λ), can be formally separated from the contributions of the non-absorbing atoms in a protein:
Denoting the phase of the wavelength-independent scattering by
the respective anomalous and dispersive differences,
may be expressed as:6
Since α(h⃗), an(h⃗) and bn(h⃗) can be calculated from the coordinates for a protein of known structure, the experimentally observed differences are linear functions of and which can then be obtained as the least squares solution to the series of observational equations. The results of the procedure are individual values of and for each anomalous scatterer at the X-ray energy where the data were collected. Our analysis shows that while the relative magnitudes of the values are rather dependent on the choice of the reference data set and are sensitive to occupancies and temperature factors of the refined structures, the values are very robust.
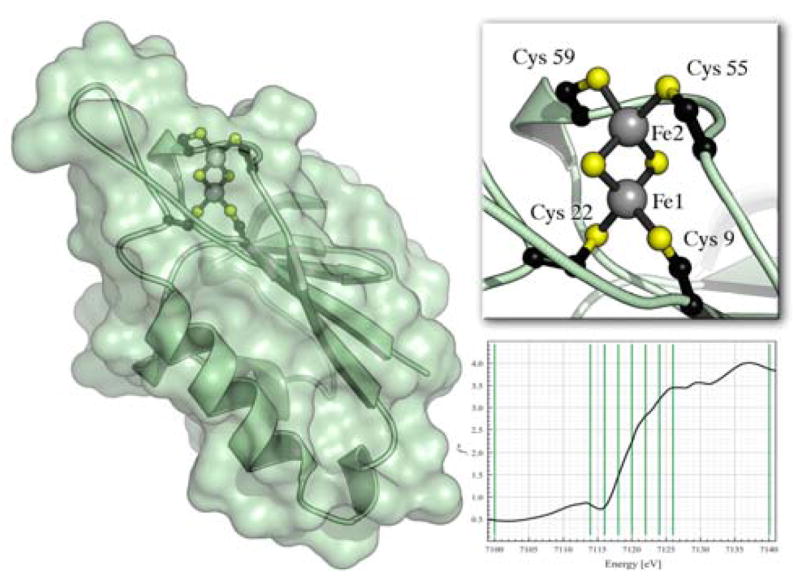
This method should be generally applicable to X-ray data collected at an absorption edge and in contrast to methods such as diffraction anomalous fine structure7, it can be straightforwardly applied to crystals of large metalloproteins. To test the feasibility of the procedure, we have carried out measurements with the [2Fe:2S] cluster containing ferredoxin Fd4 from Aquifex aeolicus 8, 9 The iron atoms of the cluster are antiferromagnetically coupled, yielding spin states of S = 0 for the oxidized (Fe(III)/Fe(III)) and S = 1/2 for the reduced (Fe(II)/Fe(III)) form, whereby the additional electron in the reduced state is localized to one of the metal centers (Fig. 1).
Figure 1.

Structure of the ferredoxin Fd4 from A. aeolicus. The iron-sulfur cluster is coordinated by four thiolate sulfurs. Fel points towards the inside of the protein while Fe2 is located close to the protein surface, and Cys 55 and Cys 59 even form part of this surface, providing a probable electron transfer site. The diagram shows the choice of 9 wavelengths for data collection along the iron K-edge on a fluorescence scan of Fd4.
Crystals of Fd4 were grown under anaerobic conditions in the presence of 2 mM sodium dithionite. They belong to space group C2 and contain two monomers per asymmetric unit, such that two independent [2Fe:2S] clusters are present and should yield identical results. Complete diffraction data sets were collected at 9 energies along the iron K-edge (see supplementary material). From an X-ray fluorescence scan, energies were chosen to comprise high and low energy references (7100 eV and 7140 eV) as well as seven data sets around the edge (7114, 7116, 7118, 7120, 7122, 7124 and 7126 eV) (Fig. 1). A model of Fd4, refined to a resolution of 1.8 Å against the data collected at 7140 eV, was used to calculate the real and imaginary parts, a and b, of structure factors for the light atoms (C, N and O), all sulfur atoms, two cadmium ions from the crystallization buffer, and each of the four individual iron atoms within the asymmetric unit. Sulfur and cadmium showed a distinct anomalous scattering contribution but no edge feature and provided a useful internal standard.
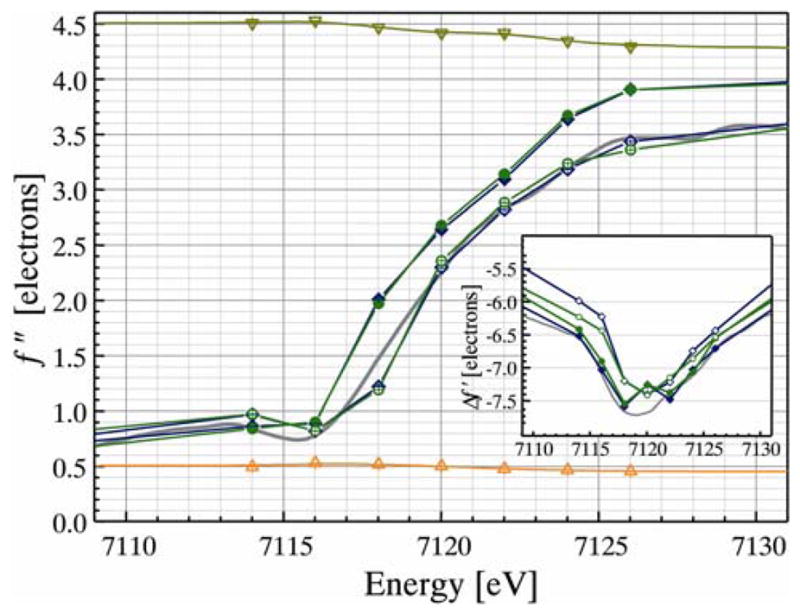
A computer program was written for reading coordinates of the refined protein structure and pre-scaled reflection data to calculate structure factors and solve the linear least squares problem. The resulting, refined Δf″ values showed an increase of anomalous signal in excellent accord with the fluorescence scan taken previously, while the sulfur and cadmium contributions remained stable (Fig. 2). The equivalent iron atoms in the two protein monomers of the asymmetric unit of the crystal yielded virtually identical results, while the two iron atoms within the same cluster showed significant differences (Fig. 2). The course of the Δf″ values is clearly shifted to lower energies for the iron atoms closer to the surface (Fe2 and Fe4), indicating a reduced Fe(II) state, while the iron atoms more buried within the protein (Fe1 and Fe3) show an edge at higher energies and are presumed to be in the Fe(III) state. The finding that the iron atom closer to the surface is the one that accepts and releases an electron is consistent with previous inferences.8, 9 We further note that the Fe(III) ions even seem to reflect the XAS pre-edge feature at 7114 eV that is present in the oxidized state only.
Figure 2.

Refined values of Δf″ for Fd4. The asymmetric unit contains two monomers and the iron sulfur clusters in monomers A (Fe1 (◇) and Fe2 (◆) and B (Fe3 (○) and Fe4 (●)) show consistent differences between their iron atoms. A fluorescence scan taken from the same crystal before data collection is shown in grey. All sulfur (△) and cadmium (▽) atoms in the structure were each refined as a single anomalous species; the refined values of ~4.4 and 0.5 electrons may be compared to tabulated values of 5.7 and 0.7 e−, respectively.4 The insert shows the refined Δf′ values, where Fe2 and Fe4 yield a curve with two minima.
The assignment of redox states in metal clusters promises to be a robust and versatile tool to examine the electronic structure of these moieties. While further optimizations for issues such as the minimal resolution and amount of data required and photoreduction effects in oxidized samples will be necessary, the method should be generally applicable to complex metalloproteins such as nitrogenase, carbon monoxide dehydrogenase or multiheme c cytochromes. The information gained from the position and shape of the absorption edge for individual metals will provide an experimental assessment of the oxidation states and should serve to both guide and validate theoretical calculations.
Supplementary Material
X-ray diffraction data statistics. This material is available free of charge via the Internet at http://pubs.acs.org.
Acknowledgments
Diffraction data were collected at SSRL, Stanford, and EMBL/DESY, Hamburg, Germany. This work was supported in part by EMBO YIP (OE), DFG (OE, SLAA), CNRS and UJF (JM) and by Nffl grant GM45162 (DCR).
References
- 1.Shulman RG, Yafet Y, Eisenberger P, Blumberg WE. Proc Natl Acad Sci U S A. 1976;73:1384–1388. doi: 10.1073/pnas.73.5.1384. [DOI] [PMC free article] [PubMed] [Google Scholar]
- 2.George GN, Pickering IJ, Prince RC, Zhou ZH, Adams MWW. J Biol Inorg Chem. 1996;1:226–230. [Google Scholar]
- 3.Musgrave KB, Angove HC, Burgess BK, Hedman B, Hodgson KO. J Am Chem Soc. 1998;120:5325–5326. [Google Scholar]
- 4.Creagh DC, McAuley WJ. In: International Tables for Crystallography. Wilson AJC, editor. C. Kluwer Academic Publishers; Dordrecht: 1992. pp. 206–222. [Google Scholar]
- 5.Wu G, Zhang Y, Ribaud L, Coppens P, Wilson C, Iversen BB, Larsen FK. Inorg Chem. 1998;37:6078–6083. doi: 10.1021/ic980556b. [DOI] [PubMed] [Google Scholar]
- 6.Drenth J. Principles of Protein X-ray Crystallography. Springer; New York: 1994. [Google Scholar]
- 7.Sorensen LB, Cross JO, Newville M, Ravel B, Rehr JJ, Straiger H, Bouldin CE, Woicik JC. In: Resonant Anomalous X-Ray Scattering: Theory and Applications. Materlik G, Sparks CJ, Fischer K, editors. North Holland: 1994. pp. 389–420. [Google Scholar]
- 8.Yeh AP, Chatelet C, Soltis SM, Kuhn P, Meyer J, Rees DC. J Mol Biol. 2000;300:587–595. doi: 10.1006/jmbi.2000.3871. [DOI] [PubMed] [Google Scholar]
- 9.Yeh AP, Ambroggio XI, Andrade SLA, Einsle O, Chatelet C, Meyer J, Rees DC. J Biol Chem. 2002;237:34499–34507. doi: 10.1074/jbc.M205096200. [DOI] [PubMed] [Google Scholar]
Associated Data
This section collects any data citations, data availability statements, or supplementary materials included in this article.
Supplementary Materials
X-ray diffraction data statistics. This material is available free of charge via the Internet at http://pubs.acs.org.


