

Abstract
The oncogenic kinase Bcr-Abl is thought to cause chronic myelogenous leukemia (CML) by altering the transcription of specific genes with growth- and survival-promoting functions. Recently Bcr-Abl has also been shown to activate an important regulator of protein synthesis, the mammalian target of rapamycin (mTOR), which suggests that dysregulated translation may also contribute to CML pathogenesis. In this study, we found that both Bcr-Abl and the rapamycin-sensitive mTORC1 complex contribute to the phosphorylation (inactivation) of 4E-BP1, an inhibitor of the eIF4E translation initiation factor. Experiments with rapamycin and the Bcr-Abl inhibitor, imatinib mesylate, in Bcr-Abl-expressing cell lines and primary CML cells indicated that Bcr-Abl and mTORC1 induced formation of the translation initiation complex, eIF4F. This was characterized by reduced 4E-BP1- and increased eIF4G-binding to eIF4E, two events that lead to assembly of eIF4F. One target transcript is cyclin D3, which is regulated in Bcr-Abl-expressing cells by both Bcr-Abl and mTORC1 in a translational manner. In addition, the combination of imatinib and rapamycin was found to act synergistically against committed CML progenitors from chronic and blast phase patients. These experiments establish a novel mechanism of action for Bcr-Abl, and they provide insights into the modes of action of imatinib mesylate and rapamycin in treatment of CML. They also suggest that aberrant cap-dependent mRNA translation may be a therapeutic target in Bcr-Abl-driven malignancies.
Keywords: CML, eIF4F, mTOR, cap-dependent translation
Introduction
Chronic myelogenous leukemia (CML) is characterized by the presence of a specific chromosomal translocation, t(9; 22) (Rowley, 1973), which results in the production of a 210 kDa fusion protein termed Bcr-Abl. As compared to c-Abl, Bcr-Abl, has elevated tyrosine kinase activity (Lugo et al., 1990), and has been shown to be central to the pathogenesis of CML (Daley et al., 1990; Heisterkamp et al., 1990). Indeed, the clinical use of imatinib mesylate, an inhibitor of Bcr-Abl kinase, has resulted in remarkable clinical responses in the majority of patients in chronic phase (Kantarjian et al., 2002; O’Brien et al., 2003). However, patients in advanced stages of the disease are less likely to respond to imatinib, and frequently develop imatinib resistance (Ottmann et al., 2002; Sawyers et al., 2002). Recent studies have since identified three mechanisms of resistance, including mutations in the Abl kinase domain, amplification of Bcr-Abl, and overexpression of LYN kinase (Donato et al., 2003; Gorre et al., 2001). A rational approach to increase responses to imatinib, as well as to overcome resistance, is to target signaling pathways and/or cellular processes which are aberrantly activated by Bcr-Abl, and which contribute to the leukemic phenotype.
One such target is the mTOR pathway, since work by us and others have shown that two mTOR effectors, 4E-BP1 and S6K, are activated in a Bcr-Abl kinase-dependent manner in Bcr-Abl-expressing cell lines (Ly et al., 2003; Mohi et al., 2004; Parmar et al., 2005). mTOR is a 289 kDa serine/threonine kinase that regulates cell growth and proliferation in response to growth factors and the availability of nutrients (Gingras et al., 2001b). mTOR performs these functions by promoting protein synthesis, metabolism, transcription and ribosome biogenesis (Jacinto & Hall, 2003; Um et al., 2004; Wullschleger et al., 2006). Recent work has also revealed that mTOR function is mediated by two distinct multimeric protein complexes termed mTORC1 and mTORC2. The kinase activity of mTORC1 is rapamycin sensitive, while that of mTORC2 is not. Also mTORC1 has been shown to regulate cap-dependent translation via its ability to phosphorylate 4E-BP1. 4E-BP1 is a translation inhibitor and is phosphorylated in response to growth signals. Upon phosphorylation, 4E-BP1 dissociates from eukaryotic initiation factor 4E (eIF4E). eIF4E is then able to form a complex of three proteins which together are termed eIF4F. eIF4F consists of: (a) eIF4E which binds the cap structure (m7G(5′)ppp(5′)N) present at the 5′ end of mRNAs; (b) eIF4G, a scaffolding protein with binding sites for eIF4E, eIF4A, eEF3, and PABP; and (c) eIF4A, an RNA-dependent ATPase and RNA helicase. The formation of eIF4F at the 5′-end of mRNA leads to the melting of secondary structures within the mRNA, and allows for the binding of the 43S preinitiation complex. This allows the 43S preinitiation complex to begin scanning towards the initiation codon, and translation to proceed (Haghighat et al., 1995). eIF4E function is particularly important for a subset of genes that are poorly translated in resting cells, but are recruited to ribosomes following a proliferative signal. The differing translation efficiencies for these mRNAs, appear to be a result of highly structured 5′ untranslated regions (UTR), or the presence of multiple open reading frames, both of which inhibit efficient scanning. Examples of genes with long, highly structured 5′ UTRs include those encoding growth factors, growth factor receptors, tyrosine kinases, and transcription factors (Kozak, 1991).
Recent work has emphasized the importance of dysregulated translation in a wide range of human tumors, and underlined the important role that mTOR and its effectors have in oncogenesis (Huang & Houghton, 2003; Majumder et al., 2004; Ruggero et al., 2004; Sawyers, 2003; Wendel et al., 2004). Since combined inhibition of the mTOR and Bcr-Abl kinases leads to increased killing of CML cells by imatinib (Ly et al., 2003; Mohi et al., 2004; Parmar et al., 2005), it is plausible that dysregulated translation is also important in the pathogenesis of CML. These observations led us to hypothesize that Bcr-Abl and mTOR may function cooperatively in CML cells to regulate cap-dependent mRNA translation, a general cellular process that has not been previously explored in Bcr-Abl-driven malignancies (Deininger et al., 2000; Perrotti et al., 2005). To test this hypothesis we examined the status of the cap-binding complex in Bcr-Abl-containing cells, as well as examined a number of candidate genes for evidence of translational regulation by Bcr-Abl. Our studies show that Bcr-Abl and mTORC1 activity each contribute to phosphorylation of 4E-BP1. We also find that Bcr-Abl and mTORC1 cooperate to form a translationally active form of the cap-binding complex, and identify cyclin D3 as a transcript whose translation is enhanced by mTORC1 and BCR-Abl activity. Together, our data demonstrate that in addition to its known functions, Bcr-Abl is to promote the translation of specific genes, and suggest novel therapeutic strategies for targeting downstream functions of Bcr-Abl related to mRNA translation.
Results
Bcr-Abl and mTORC1 contribute to 4E-BP1 phosphorylation in CML cells
Using immunoblot, we first determined the phosphorylation status of 4E-BP1 in the K562 cell line, which was originally derived from a patient in blast crisis CML. In these cells, we found that both imatinib and rapamycin had similar activity in terms of inhibiting 4E-BP1 phosphorylation. Specifically, we found that both drugs had equivalent activity in increasing the ratio of less phosphorylated to more phosphorylated forms of 4E-BP1, and that combined treatment was required to abolish the formation of the hyperphosphorylated γ form (Fig. 1A). We also used a phosphospecific antibody [p(Thr37/46)4E-BP1] that recognizes phosphorylated threonine at positions 37 and 46 in 4E-BP1 on stripped blots, and confirmed these findings (Fig. 1A). However, because the p(Thr37/46)4E-BP1 antibody continued to detect the phosphorylated threonine(s) in all forms (α, β, □ □ □ γ bands) of 4E-BP1 on the immunoblot, and because 4E-BP1 is sequentially phosphorylated at other residues (Gingras et al., 2001a), we were unable to conclude from these data if phosphorylation at Thr37/46 specifically was regulated by Bcr-Abl or mTORC1.
Figure 1.

Bcr-Abl and mTORC1 contribute to 4E-BP1 phosphorylation in CML cells. (a) K562 cells were treated for 24 hrs with diluent (DMSO) alone, imatinib (2 and 5 μM), rapamycin (10 ng/ml), or both. Western analysis was performed on whole cell lysates using antibodies to total 4E-BP1, phospho(Thr37/46)4E-BP1, and c-Abl as a loading control. The antibody to total 4E-BP1 recognizes all forms of 4E-BP1. The α, β, and γ bands correspond to increasingly phosphorylated forms of 4E-BP1. (b) Parental Ba/F3, Ba/F3-Bcr-Abl and Ba/F3-Bcr-Abl-T315I cells were treated for 4 hrs with diluent alone, imatinib (2 μM), rapamycin (10 ng/ml), or both. Immunoblot was performed as described above. Anti-actin was used as a loading control. (c) Ba/F3-Bcr-Abl cells were treated with or without inhibitors for 4 hrs in the presence or absence of IL3, and immunoblot performed. For IL3-treated cells, 10 ng/ml of the cytokine was added 12–16 hrs before the addition of inhibitors. (d) Primary CML cells from patients in blast and chronic phase CML obtained at the time of presentation were grown in serum-free media and GF’s. Cells were incubated with the indicated inhibitors for 24 hrs, and immunoblot analysis performed on cell lysates. Antibody to actin was used as a loading control.
Parallel experiments were also performed using three cell lines in the Ba/F3 system: parental Ba/F3 cells, Bcr-Abl-expressing Ba/F3 cells (Ba/F3-Bcr-Abl), and Ba/F3 cells expressing an imatinib-resistant form of Bcr-Abl (Ba/F3-Bcr-Abl-T315I) (La Rosee et al., 2002). First, we found that the presence of Bcr-Abl in the Ba/F3-Bcr-Abl and Ba/F3-Bcr-Abl-T315I resulted in an increase in the most phosphorylated γ form of 4E-BP1 when compared to parental Ba/F3 cells (compare lane 1 to lanes 5 and 9, Fig. 1B). This increase was dependent on Bcr-Abl kinase activity, since imatinib treatment of Ba/F3-Bcr-Abl, resulted in a return to the phosphorylation pattern seen in parental Ba/F3 cells (compare lane 5 to lane 6, Fig. 1B). Unlike K562 cells, rapamycin treatment resulted in a greater decrease in 4E-BP1 phosphorylation than imatinib (compare the amount of the least phosphorylated α form in lane 7 to lane 6, Fig. 1B), although, as in the K562 cell line, inhibition of both kinases was required to maximally decrease 4E-BP1 phosphorylation (compare lane 8 to lanes 6 and 7, Fig. 1B). Importantly, in both the parental Ba/F3 and Ba/F3-Bcr-Abl-T315I cells, imatinib had no effect on 4E-BP1 phosphorylation (compare lane 1 with lane 2, and lane 9 with 10), indicating that imatinib’s effects on Ba/F3-Bcr-Abl cells were Bcr-Abl-specific. Rapamycin, on the other hand, was able to decrease 4E-BP1 phosphorylation, in both parental Ba/F3 and Ba/F3-Bcr-Abl-T315I cells (compare lane 1 to 3, and lane 9 to 11), although the decrease in phosphorylation was less in the Bcr-Abl-containing cell lines (compare lane 3 to lanes 7 and 11, Fig. 1B), presumably because Bcr-Abl kinase remains active in these cells. Because Bcr-Abl and IL3 activate similar signaling pathways that control cell growth and survival (Sattler & Salgia, 1997), we repeated the experiments in the Ba/F3-Bcr-Abl cell lines in the presence or absence of IL3 to determine if signals from Bcr-Abl and IL3 also converge at the point of 4E-BP1 phosphorylation. We found that the addition of IL3 for 24 hours prior to addition of inhibitors, partially prevented the imatinib-mediated inhibition of 4E-BP1 phosphorylation (Fig 1C.). From these results, we conclude that the signaling pathways mediating Bcr-Abl-dependent phosphorylation of 4E-BP1 overlap in part with IL3-mediated signaling.
Lastly, we conducted similar experiments in primary cells derived from patients with CML in both blast and chronic phase grown in physiological conditions (serum-free media supplemented with growth factors) (Chu et al., 2004). For both phases of disease, we found that, as in Ba/F3-Bcr-Abl cells grown in IL3, that imatinib treatment was less able to inhibit 4E-BP1 phosphorylation compared to rapamycin, although combined treatment was still required to maximally inhibit formation of the most phosphorylated γ band (Fig. 1D).
Bcr-Abl reduces 4E-BP1 and increases eIF4G in the cap-binding complex
Because phosphorylation of 4E-BP1 is a key regulatory step in the control of cap-dependent translation, we assessed the role of these kinases in the formation of the translationally active cap-binding complex eIF4F. To determine the effects of the Bcr-Abl and mTOR kinases on the binding of 4E-BP1 and eIF4G to eIF4E, we used the cap analog, m7-GTP-Sepharose, to capture eIF4E and its binding partners from cell lysates in cell lines and primary CML cells. Bound fractions were then assessed for the presence of eIF4E, 4E-BP1, and eIF4G by immunoblot (Avdulov et al., 2004).
In the cap-analog-bound fractions from K562 cell lysates, we found equivalent amounts of eIF4E under the various conditions (Fig. 2A). We also found that the most phosphorylated form of 4E-BP1, corresponding to the γ isoform (Fig. 2A), was present in the whole cell lysate but not in the cap analog-bound fractions, confirming that this form is less able to bind the eIF4E/cap analog complex. We also found that treatment with either imatinib or rapamycin resulted in an increase in 4E-BP1 binding to eIF4E, while combined treatment resulted in an additive effect (Fig. 2A). These results demonstrate that both Bcr-Abl and mTORC1 activity inhibit the binding of 4E-BP1 to eIF4E in hematopoietic cells. Since we found that imatinib or rapamycin increased the binding of 4E-BP1 to the cap complex, we expected to find a corresponding decrease in the formation of eIF4F. To determine if this was the case, the same blots were probed with antibody to eIF4G. As expected, we found a reciprocal relationship between the amount of 4E-BP1 and eIF4G that bound to the cap-binding complex (Fig. 2B), with the presence of either inhibitor resulting in a decrease of cap-bound eIF4G, and with the combination causing a greater effect than with either drug alone. To control for any caspase 3-mediated degradation of eIF4G that might be induced by imatinib treatment (Bushell et al., 2000), we also examined the levels of eIF4G in whole cell lysates, and found them to be unchanged (Fig. 2B).
Figure 2.
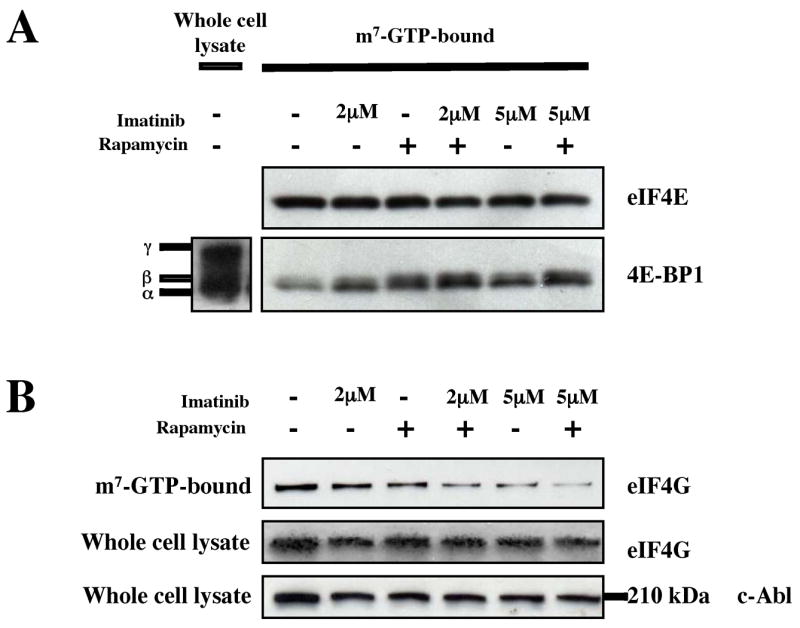
Bcr-Abl and mTORC1 induce the formation of eIF4F in K562 cells. (a) K562 cells treated with imatinib with or without rapamycin (10 ng/ml) for 24 hrs. Cap-bound proteins were brought down by incubation with m7-GTP-Sepharose. The amount of cap-bound eIF4E and 4E-BP1 was then assessed by immunoblot with the appropriate antibodies. (b) The amount of cap-bound eIF4G and whole cell eIF4G was examined in K562 cells. Anti-c-Abl was used to assess equal loading for whole cell lysates.
Next, we repeated these experiments in the Ba/F3 system. As in K562 cells, in the cap-analog-bound fractions of Ba/F3 cells, we found equivalent amounts of eIF4E for all three cell types treated under the various conditions (Fig. 3A, left-hand panel). We also found that the most phosphorylated form of 4E-BP1, corresponding to the γ isoform (Fig. 3A), was present in the whole cell lysate (lane 1) but not in the cap analog-bound fractions (Fig. 3A, lanes 2–13). Next, we found that imatinib treatment of BaF/3-Bcr-Abl cells resulted in an increase in the total amount of 4E-BP1 that was bound to eIF4E, together with an increase in the ratio of less phosphorylated to more phosphorylated forms of 4E-BP1 (compare lane 7 to lane 6, Fig. 3A). Treatment with single agent rapamycin also resulted in an increase in the ratio (compare lane 8 to lane 6, Fig. 3A), while combined treatment led to an additive effect (compare lane 9 to lanes 7 and 8, Fig. 3A). These results were confirmed by densitometric analyses which showed that imatinib produced a statistically significant three-fold increase in 4E-BP1 binding to the eIF4E/cap complex, and that imatinib’s effect was additive to that of rapamycin (Fig. 3A, right-hand panel). For both the parental Ba/F3 and Ba/F3-Bcr-Abl-T315I cell lines, imatinib treatment had no effect (compare lanes 2 and 3, and 10 and 11), while rapamycin was able to increase the amount of 4E-BP1 as well as the ratio of less phosphorylated to more phosphorylated forms of 4E-BP1(compare lanes 2 and 4, and 10 and 12). We also found that in Ba/F3-Bcr-Abl cells that treatment with either imatinib or rapamycin resulted in a decrease in the amount of eIF4G binding to eIF4E (compare lanes 6 and 7 to lane 5 in Fig. 3B, left-hand panel), and that the use of both drugs resulted in a greater inhibition of eIF4G binding (Fig. 3B, compare lane 8 to lanes 6 and 7). Importantly, the combined effects of imatinib and rapamycin on eIF4G binding were not seen in the parental Ba/F3 and Ba/F3-Bcr-Abl-T315I cells (Fig. 3B, compare lane 4 to lane 3, and lane 12 to 11). As in the case of 4E-BP1-binding to the cap complex, densitometric analyses confirmed statistically significant decreases in eIF4G-binding to the cap complex, in the presence of imatinib, rapamycin, or both (Fig. 3B, right-hand panel). Finally, because we found that the presence of IL3 attenuated the effect of imatinib on inhibiting 4E-BP1 phosphorylation (Fig. 1C), we repeated the cap-binding assay in Ba/F3-Bcr-Abl cells in the presence and absence of IL3. We found that the presence of IL3 only partially inhibited the effect of imatinib on the cap complex. Thus the amount of 4E-BP1 bound to the cap-analog continued to increase in the presence of imatinib, but less so than when cells were incubated in IL3-free media (Fig. 3C, compare lanes 2 to 3, and 6 to 7). For cap bound eIF4G, we found similar effects, with the presence of IL3 attenuating the effect of imatinib on cap-bound eIF4G (Fig. 3D).
Figure 3.

Bcr-Abl induces the formation of eIF4F in Ba/F3-Bcr-Abl, but not parental Ba/F3 or Ba/F3-Bcr-Abl-T315I cells. (a) Left-hand panel: Bcr-Abl and mTOR decrease the amount cap-bound 4E-BP1 in Ba/F3-Bcr-Abl cells. Parental Ba/F3, Ba/F3-Bcr-Abl and Ba/F3-Bcr-Abl-T315I cells were treated for 4 hrs with diluent alone, imatinib (2 μM), rapamycin (10 ng/ml), or both. Right-hand panel: Quantitation of cap-bound 4E-BP1 in Ba/F3-Bcr-Abl cells. Bars indicate standard errors calculated from three independent experiments. (b) Left-hand panel: Bcr-Abl and mTOR promote the binding of eIF4G to cap-bound eIF4E. The same blots described in (a) were probed with antibody recognizing eIF4G. In addition, immunoblot of whole cell lysates were probed to assess total levels of eIF4G. Equal loading was assessed by an anti-actin antibody. Right-hand panel: Quantitation of cap-bound eIF4G in Ba/F3-Bcr-Abl cells. Bars indicate standard errors calculated from three independent experiments. (c) and (d) Addition of IL3 partially abrogates the inhibitory effect of imatinib on eIF4F formation in Ba/F3-Bcr-Abl cells. Ba/F3-Bcr-Abl cells were treated and analyzed as in (a) and (b), but in the presence and absence of IL3. For IL3-treated cells, 10 ng/ml of the cytokine was added 12–16 hrs before the addition of inhibitors.
We also observed similar results in primary CML cells, and found that the addition of either imatinib or rapamycin resulted in an increase in the total amount of cap-bound 4E-BP1, and that combined treatment resulted in a further increase in cap-bound 4E-BP1 (Fig. 4). We were not able to detect eIF4G in whole cell lysates from primary CML cells (presumably because of rapid protein degradation (Bushell et al., 2000)). However, given the results in Figs. 2 and 3, it seems likely that a similar effect on cap-bound eIF4G exists in primary CML cells. Furthermore, prior work has shown that 4E-BP1 and eIF4G compete for the same binding site on eIF4E (Altmann et al., 1997). Together, these results demonstrate that Bcr-Abl and mTORC1 both contribute to the formation of a translationally active cap-binding complex in hematopoietic cells. The effect of imatinib on the integrity of the complex also indicates that a novel mechanism of action of this drug may be to impair the cap-dependent translation of specific genes.
Figure 4.
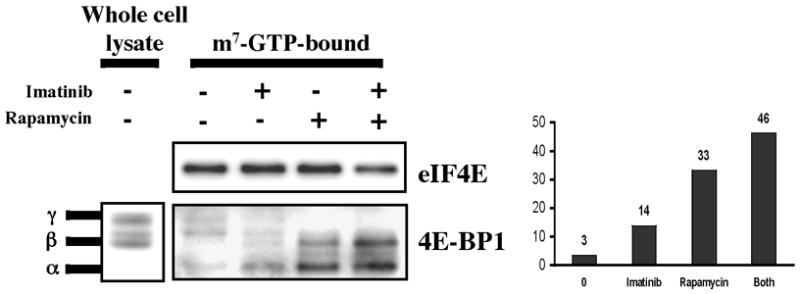
Bcr-Abl and mTORC1 induce the formation of eIF4F in primary chronic phase CML cells. Left hand panel: primary CML cells obtained at presentation from a patient in chronic phase were grown in GF-supplemented serum-free media, and treated with or without imatinib (2μM), rapamycin (10 ng/ml), or both for 24 hrs. Cap-bound eIF4E and 4E-BP1 were assessed by immunoblot. Right hand panel: densitometric analysis of cap-bound 4E-BP1 was performed, and data plotted as an average from two independent experiments.
Cyclin D3 is translationally regulated by Bcr-Abl and mTORC1
The above findings led us to search for candidate genes that might be regulated by Bcr-Abl at the level of translation in hematopoietic cells. While almost all cellular RNAs are translated in a cap-dependent manner (Johannes et al., 1999), we focused our attention on two cyclins: D2 and D3, since work in other cell types indicated that these genes were translationally regulated by the phosphoinositide 3-kinase (PI3K)/AKT and mTOR signaling pathways (Hleb et al., 2004; Rajasekhar et al., 2003). In addition, recent work by others have shown an important role of cyclin D3 in other human leukemias (Decker et al., 2003; Sicinska et al., 2003). Studies in Ba/F3-Bcr-Abl cells have also shown that while both cyclins are induced by Bcr-Abl, the mechanism of cyclin D3 induction appears to be at the post-transcriptional level (Jena et al., 2002; Parada et al., 2001). In time course experiments, we measured protein and total RNA levels of both cyclins following exposure to imatinib. We found that cyclin D3 protein levels decreased following treatment with imatinib, while cyclin D3 mRNA showed a slight but statistically insignificant increase (Fig. 5A). In contrast, we found that both cyclin D2 protein and mRNA decreased in a statistically significant manner following treatment with imatinib (Fig. 5B), confirming the results of a prior study (Parada et al., 2001). To determine the post-transcriptional mechanism of cyclin D3 regulation, we conducted metabolic labeling experiments using Ba/F3-Bcr-Abl cells in the presence or absence of imatinib, rapamycin or both. We found that both imatinib and rapamycin inhibited the incorporation of 35S-met into cyclin D3 in Ba/F3-Bcr-Abl cells, and that the combination of both inhibitors decreased 35S-met incorporation more than either agent alone (Fig. 5C). To confirm that the imatinib- and rapamycin-mediated decrease in labeled cyclin D3 was not due to an effect on protein stability, we also examined cyclin D3 protein levels in untreated and inhibitor-treated Ba/F3-Bcr-Abl cells in the presence of the protein synthesis inhibitor cycloheximide. We found that the presence of imatinib or rapamycin did not decrease the protein stability of cyclin D3 (Fig. 5D). Together, these results demonstrate that Bcr-Abl and mTORC1 regulate cyclin D3 protein expression at the translational level. To further confirm that Bcr-Abl and mTOR were cooperating in regulating expression of cyclin D3, we determined the effect of imatinib, rapamycin, or both on cyclin D3 and D2 protein levels in Ba/F3-Bcr-Abl cells. For cyclin D3, both agents were individually able to decrease protein levels, and when combined, produced at least an additive effect (Fig. 5E). In contrast, cyclin D2 protein levels were unaffected by rapamycin as a single agent or in combination with imatinib (Fig. 5E). In line with our studies in Ba/F3 cells, BP CML cells also demonstrated decreased expression of cyclin D3 protein, but not mRNA (not shown), in the presence of imatinib and rapamycin, and particularly when both inhibitors were combined (Fig. 5F).
Figure 5.

Bcr-Abl and mTORC1 regulate cyclin D3, but not cyclin D2, translation. (a) Ba/F3-Bcr-Abl cells were incubated with 2 μM imatinib, and sampled every 2 hrs for 8 hrs. Western analysis of cell lysates and Q-PCR of total RNA was performed to assess cyclin D3 protein and mRNA levels. Bars indicate standard errors calculated from three independent experiments. (b) Cyclin D2 protein and mRNA levels were also assessed as in A. Bars indicate standard errors calculated from three independent experiments. (c) Ba/F3-Bcr-Abl cells were incubated in serum- and methionine-free media for 3 hrs, following which they were metabolically labeled with S35-methionine, and treated with or without imatinib, rapamycin, or both for 3 hrs. Cyclin D3 was immunoprecipitated, separated by SDS-PAGE, and S35-labelled cyclin D3 visualized by autoradiography. The intensity of the band corresponding to cyclin D3 was averaged from three independent experiments and plotted as a bar graph. Bars indicate standard errors. (d) Ba/F-Bcr-Abl cells were pretreated with diluent, 2 μM imatinib, or 10 ng/ml rapamycin for one hour to ensure kinase inhibition, following which 20 μg/ml cycloheximide was added. Cells were then harvested and lysed at the indicated times. Cyclin D3 protein levels were assessed by immunoblot. Actin levels were used as a loading control. (e) Ba/F-Bcr-Abl cells were treated with 2 μM imatinib, 10 ng/ml rapamycin, or both over 8 hrs. Cyclin D2 and cyclin D3 protein levels were assessed by immunoblot. (f) Primary CML cells were grown in GF-supplemented serum-free media, and treated with or without imatinib (2μM), rapamycin (10 ng/ml), or both for 24 hrs. Immunoblot for cyclin D3 and actin was performed on lysates obtained from these cells.
Because the above effects of Bcr-Abl and mTOR on cyclin D3 might be a consequence of a general inhibitory effect of imatinib and/or rapamycin on cell proliferation rather than a direct effect on cyclin D3 translation per se, we also we performed cell cycle analysis on Ba/F3-Bcr-Abl cells in identically treated cells. We found that the earliest time point at which a decrease in the S-phase fraction was observed was 6 hours following treatment with either single agent imatinib or rapamycin or both (Fig. 6). In contrast, the decrease in expression of cyclin D3 protein preceded the effects of single agent imatinib or rapamycin on cell proliferation by at least 2 hours, and the effects of combined inhibitors on proliferation by at least 4 hours (Figs. 5A and 5E). Thus, the decrease in cyclin D3 protein we observed was not a result of decreased cell proliferation, but instead may have contributed to it.
Figure 6.
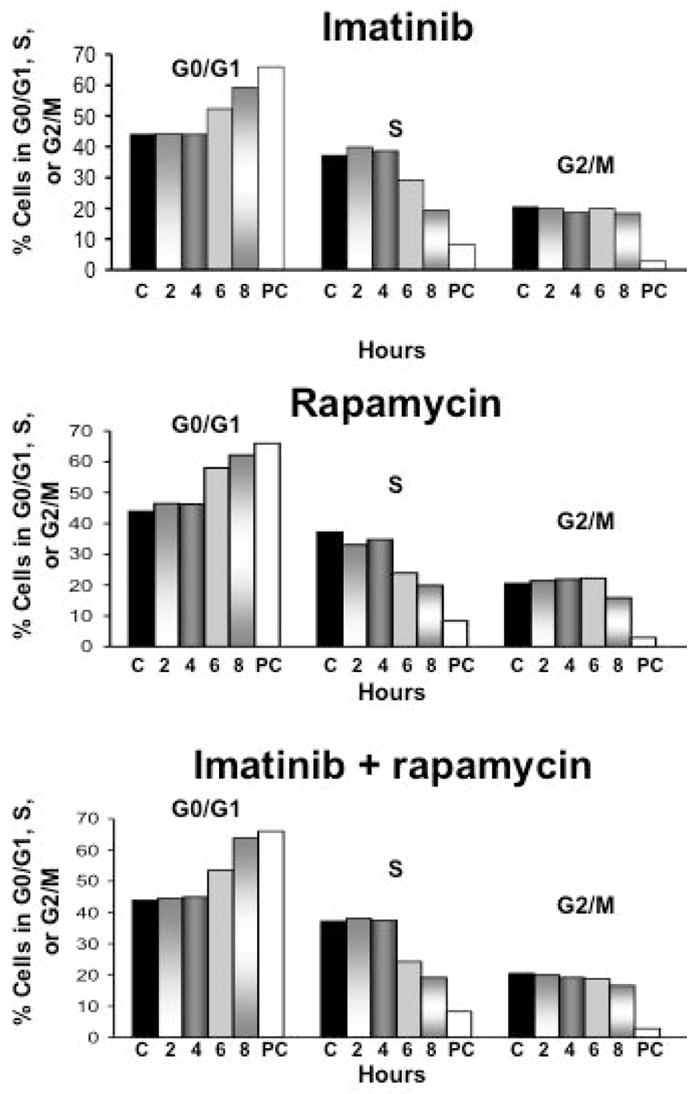
Decreases in cyclin D protein levels precede the cell cycle arrest caused by imatinib and rapamycin. Ba/F3-Bcr-Abl cells were treated with 2 μM imatinib, 10 ng/ml rapamycin, or both and harvested at the indicated time points. Fixed cells were then stained with PI, and analyzed on a FACSCalibur flow cytometer. The relative percentages of cells in G0/G1, S, G2/M were calculated using FlowJo software. ‘C’ indicates cells that were treated with diluent only, and ‘PC’ cells that were treated with 5 μM imatinib and harvested at 24 hours to serve as a positive control. The data displayed are representative of three independent experiments.
Combined inhibition of Bcr-Abl and mTORC1 acts synergistically against primary CML progenitor cells
The findings that Bcr-Abl and mTORC1 cooperate to form a translationally active form of the cap-binding complex led us to investigate if the combination of imatinib and rapamycin act synergistically against primary CML progenitor cells. Also, while prior work has shown this combination to be at least additive in effect, no formal demonstration of synergy has been shown in primary CML cells (Parmar et al., 2005). Accordingly, peripheral blood was obtained from patients with chronic phase CML at the time of disease presentation (CML-CP) and during complete cytogenetic or molecular remission (CCR). As expected, we found that CML colony forming cells (CFC) were differentially sensitive to imatinib when compared to normal CFCs obtained from patients in CCR (Fig. 7A). We also found that CML CFCs were also slightly more sensitive than normal CFCs to treatment with 1 ng/ml of rapamycin alone, which were reduced to 46 % vs 63% (p=0.003) respectively compared to untreated cells. However, when 1 ng/ml rapamycin was used in combination with 1 μM imatinib, we found that numbers of CML progenitors were markedly reduced when compared to normal progenitors: to 15 % and 67% respectively of untreated cells (p=0.0002). To determine if the combination was acting synergistically, primary CML cells from a patient in CP (CML-CP3) were incubated with rapamycin and imatinib at four different concentrations individually, and in combination. Log transformed median dose plots are depicted in Fig. 7B. The median dose for rapamycin as a single agent was 0.76 nM, while imatinib’s median dose was 3.98 μM. The combination of these agents was highly synergistic, with a 4.7-fold reduction of the median dose of rapamycin to 0.162 nM, and a 20-fold reduction of imatinib’s median dose to 0.20 μM. The Chou plot, shown in Fig. 7B, demonstrated that all combination index points were significantly less than 1.0, the minimum criteria for synergy. Since we showed that primary myeloid blast phase cells also exhibit Bcr-Abl and mTORC1-dependent signaling to 4E-BP1 (Fig. 1C), we went on to test the imatinib/rapamycin combination against progenitor cells derived from a patient in myeloid blast crisis. As in CP cells, we found that the addition of rapamycin further enhanced the effect of imatinib (Fig. 7C). Together, these data indicate that in both CP and BP CML, that signals emanating from mTORC1 contribute to the persistence and survival of Bcr-Abl-transformed progenitor cells.
Figure 7.
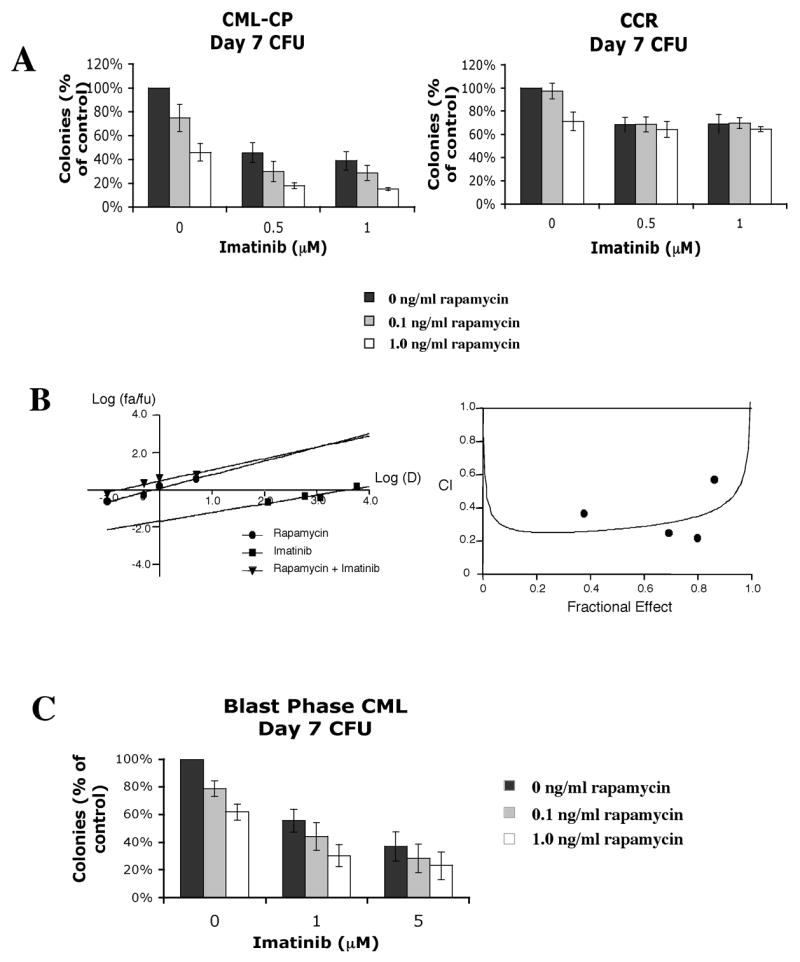
Rapamycin acts synergistically with imatinib against chronic and blast phase CML but not normal progenitors. (a) Effect of imatinib and rapamycin on colony forming units (CFU) from patients in CP CML (n=3), and CP CML patients in complete cytogenetic or molecular remission (CCR) (n=3). Cells were incubated in GF-containing media with increasing concentrations of imatinib and/or rapamycin for 96 hrs. Cells were then plated in methylcellulose, and colonies counted by two independent observers at day 7. Bars indicate standard errors. (b) Left hand panel: median effect plot of rapamycin, imatinib and their combination on CML-CP cells. Log dose (D) is plotted against log fraction affected/fraction unaffected (fa/fu). Right hand panel: CI plot demonstrating synergy at four different dose combinations. (c) PB MNC’s from a patient in myeloid blast crisis were also obtained, and tested for sensitivity to imatinib and rapamycin using the CFA in three independent experiments. Bars indicate standard errors.
Discussion
The combination of imatinib and mTORC1 inhibitors are already in clinical trials, but the precise mechanism by which these drugs target CML cells remains unclear. Here, we describe for the time, a direct effect of Bcr-Abl on the cap-dependent translation machinery and mRNA translation, as well as the role of imatinib and rapamycin in inhibiting these processes. First, we demonstrate that Bcr-Abl and mTORC1 phosphorylate 4E-BP1, which in turn is associated with decreased binding to eIF4E, and the formation of eIF4F. These results indicate that in CML cells, Bcr-Abl and mTORC1 induce a translationally active state that would favor the initiation of cap-dependent translation. Next, we identified cyclin D3 as a gene that is translationally regulated by both Bcr-Abl and mTORC1. We also show that the combination of imatinib and rapamycin is able to inhibit translation to a greater extent than either agent alone, and that this is associated with a more profound effect on protein expression. Finally, we demonstrate that the combination acts synergistically against committed CML progenitor cells at concentrations that are achievable in patients for both drugs (Deininger & Druker, 2003; Meier-Kriesche & Kaplan, 2000).
Phosphorylation of 4E-BP1 plays a major role in regulating cap-dependent translation by allowing the formation of eIF4F and thence recruitment of the translation initiation machinery to mRNA. The rapamycin-sensitive mTORC1 complex (comprising mTOR, raptor and mLST8) is thought to be the major kinase responsible for 4E-BP1 phosphorylation (Choi et al., 2003; Nojima et al., 2003; Schalm et al., 2003). mTORC1 is in turn activated by the PI3K/Akt and Ras/Erk pathways (Wullschleger et al., 2006). Our data indicate that both Bcr-Abl- and mTORC1-dependent signals contribute to the phosphorylation of 4E-BP1 in a variety of Bcr-Abl-expressing cells. Because Bcr-Abl also activates the PI3K/Akt and Ras pathways, the simplest explanation is that Bcr-Abl contributes to mTORC1 activation via these pathways. However, because phosphorylation at both rapamycin-insensitive and rapamycin-sensitive sites on 4E-BP1 may be important in releasing it from eIF4E (Gingras et al., 1998; Gingras et al., 2001a), it is also possible that Bcr-Abl activates a kinase which phosphorylates the rapamycin-insensitive sites. Indeed, the existence of a rapamycin-resistant kinase which contributes to phosphorylation of 4E-BP1 is suggested by the work of others using a dominant negative form of mTOR (Edinger et al., 2003). Our data also demonstrate that yet another common target of cytokine- and Bcr-Abl-mediated signaling is 4E-BP1 (Fig. 1C, 3C), and is in line with the prevailing understanding that Bcr-Abl-containing malignancies ‘co-opt’ existing cytokine-mediated signaling pathways to gain a proliferative/survival advantage over their normal counterparts (Deininger et al., 2000; Ghaffari et al., 1999). In primary CML cells, we observed that the effect of imatinib on inhibiting 4E-BP1 phosphorylation and induction of eIF4F was less dramatic than in Ba/F3-Bcr-Abl and K562 cells, although combined inhibition of Bcr-Abl and mTORC1 was still required for maximal inhibition of 4E-BP1 phosphorylation, eIF4F formation, and cyclin D3 protein expression (Fig. 1D, 4, and 5F). These findings are consistent with the notion that, since primary CML cells remain growth-factor dependent, the presence of Bcr-Abl provides only a slight proliferative and/or survival advantage in vivo, but that over time this slight advantage is sufficient to eventually result in the clinical picture of CML (Deininger et al., 2000).
The contribution of dysregulated translation to transformation has received much attention recently. In addition, the role of altered mRNA translation in CML has recently been reviewed (Perrotti et al., 2005). Specific mechanisms have included increased activity of RNA binding proteins that regulate translation (Iervolino et al., 2002; Trotta et al., 2003), as well as effects on IRES-mediated translation (Notari et al., 2005). However, there has been no prior work that has demonstrated a role for Bcr-Abl in regulating cap-dependent translation. Here we describe a direct effect of Bcr-Abl on promoting assembly of eIF4F. Interestingly, this function of Bcr-Abl occurs in cooperation with mTORC1, and may explain why combined inhibition of these two kinases is particularly effective against CML cells. Indeed, the synergistic activity of the imatinib/rapamycin combination against CML cells may be explained by this finding alone. This is because when both agents are used together, there is almost complete disappearance of the translationally active, eIF4G-containing form (see Figs. 2B and 3B), which is essential to recruiting the translational machinery to mRNA and the initiation of translation (Hentze, 1997; Morley et al., 1997).
Since the majority of eukaryotic mRNA species are capped, our findings also suggest that dysregulated cap-dependent translation may affect a significant number of genes. However, because cap-dependent translation represents only one step in the process of protein expression, other factors will likely influence the expression of specific genes. For example, while others find that cyclin D2 is regulated at a translational level in glioma cells (Parada et al., 2001; Rajasekhar et al., 2003), we and another group find that it is transcriptionally regulated by Bcr-Abl in the Ba/F3 system (Parada et al., 2001; Rajasekhar et al., 2003). Thus, there are significant cell type-dependent differences which determine whether specific transcripts are primarily under transcriptional versus translational control. These observations, together with the fact that patients are able to tolerate prolonged periods of therapy with rapamycin or its analogs (Dancey, 2002), suggest that the therapeutic effects of these drugs rely on modulating expression of a subset of genes which are critical to transformation. This is likely to be the case in CML also, since we find that normal progenitors are not as sensitive to the effects of rapamycin as CML progenitors (Fig. 7). The identity of the actual mRNA’s that are under translational control by Bcr-Abl/mTORC1 in primary CML progenitor cells remains to be determined, and is the subject of ongoing work in our laboratory.
Recent work has also raised a theoretical concern about the use of mTORC1 inhibitors in cancer. This relates to the finding that activation of the mTOR pathway results in attenuation of the growth factor-stimulated PI3K/Akt axis. This occurs by mTORC1/S6K1-dependent phosphorylation and inactivation of insulin receptor substrate (IRS) proteins that lie upstream of PI3K/Akt (Um et al., 2004; Wullschleger et al., 2006), and may be important for situations when mTOR is inappropriately activated. Thus, pharmacologic interruption of mTORC1/S6K1 signaling may lead to activation of the PI3K/Akt axis and exacerbation of the tumor. Our studies indicate that such a feedback loop may not be clinically important in Bcr-Abl-driven malignancies, as evidenced by the activity of rapamycin against committed CML progenitors from patients in both CP and BP (Fig. 7). One explanation for this might be because the PI3K/Akt axis is already maximally activated by Bcr-Abl, and thus cannot be further activated by this feedback loop.
In conclusion, our data provide strong evidence to support a model by which Bcr-Abl and mTORC1 promote the translation of specific genes by activating the cap-dependent translation initiation machinery. This model provides a better understanding of the mechanisms mediating the activity of imatinib and rapamycin in CML, and suggests several rational and novel points for therapeutic intervention in CML, including agents that interfere with the process of cap-dependent translation (Bordeleau et al., 2005; Kentsis et al., 2004; Low et al., 2005).
Materials and methods
Cell lines and cell culture conditions
The murine hematopoietic cell line, Ba/F3, was cultured in RPMI 1640 medium supplemented with 10% fetal bovine serum (FBS) and 10 ng/ml murine interleukin-3 (IL-3). Ba/F3 cells stably transfected with full length wild-type p210 (Ba/F3-Bcr-Abl) and those containing the T315I mutation (La Rosee et al., 2002) were grown in RPMI 1640 medium supplemented with 10% FBS. The K562 cell line was obtained from ATCC and grown in RPMI supplemented with 10% FBS.
Patient samples and cell processing
Peripheral blood (PB) samples were obtained with appropriate consent and IRB approval from patients with CML at the University of California at Irvine. PB mononuclear cells (MNCs) were obtained by centrifugation through Ficoll-Hypaque, washed in PBS, and cryopreserved. To expand CML cells in vitro, cells were thawed and washed in media supplemented with 10% FBS. Following this, cells were incubated in liquid culture for 72–96 hrs, at 37°C in a humidified atmosphere with 5% CO2 in serum-free medium (SFM) (StemCell Technologies, Vancouver, BC, Canada) supplemented with growth factors (GF) at concentrations similar to that found in stroma-conditioned medium (Chu et al., 2004). All cytokines were from PeproTech, Rocky Hills, NJ, except for GM-CSF (sargramostim, Immunex, Seattle, WA), and G-CSF (filgrastim, Amgen, Thousand Oaks, CA).
Western blotting
Western analysis was performed as previously described (Ly et al., 2003). The following antibodies were used for immunoblotting: eIF4E (Cell Signaling Technology, Beverly, MA), 4E-BP1 (Cell Signaling), phospho(Thr37/46)4E-BP1 (Cell Signaling), CrkL (Cell Signaling), actin (Santa Cruz Biotechnology, Santa Cruz, CA), cyclin D2 (M-20, Santa Cruz), cyclin D3 (D-7, Santa Cruz), and eIF4G (N-20, Santa Cruz). Immunoblotting was performed according to the manufacturers’ instructions. Immunoreactive bands were visualized by enhanced chemiluminescence (Pierce, Rockford, IL) after incubation with secondary antibody.
Quantitative real-time PCR (Q-PCR)
Q-PCR was performed as previously described (Fruman et al., 2002). Briefly, total RNA was isolated using Trizol LS reagent (Invitrogen, Carlsbad, CA). Contaminating genomic DNA was removed by treatment with RNase-free DNase (Promega, Madison, WI). First-strand cDNA was synthesized by using a kit (Promega) and oligo-dT priming. Genes of interest were detected by using primers that had been optimized to generate a single amplicon of 75-200 nucleotides. Q-PCR was performed by using an iCycler (Bio-Rad) and SyBr green detection. Mouse β-actin primers were used in parallel for each run. The relative expression of the gene of interest was determined by calculating the ratio of the extrapolated concentration of that gene to the extrapolated concentration of β-actin. Primer sequences are available on request.
Cap-binding assay
Analysis of the cap-binding complex was performed by adapting a previously described protocol (Avdulov et al., 2004). Following incubation with inhibitors, 4–5 × 10⁶ cells were lysed by three freeze-thaw cycles in freeze-thaw lysis buffer (Avdulov et al., 2004). 100–200 μg of protein from the lysates was then incubated with a suspension of 7 Methyl-GTP-Sepharose 4B beads (Amersham, Piscataway, NJ), and placed on a rocker at room temperature. After one hour, the beads were pelleted and washed twice with lysis buffer. The beads were then boiled in running buffer for five minutes, separated by SDS-PAGE, transferred to nitrocellulose membranes, and subjected to Western analysis.
Metabolic labeling
5 × 10⁶ Ba/F3-Bcr-Abl cells were incubated in methionine free media. After three hrs, 200 μCi/ml S35-methionine was added with or without 2 μM imatinib, 10 ng/ml rapamycin, or both for another three hrs. Following the labeling period, the cells were harvested and lysed as described for Western analysis. 200 μg of cell lysate was precleared with normal mouse IgG. Antibody to cyclin D3 was then incubated with the cleared lysate overnight at 4°C. The protein-antibody complex was then pelleted by incubation with protein G-agarose, boiled, and separated by SDS PAGE. After drying, the gel was placed in a Storage Phosphor Screen (Molecular Dynamics, Amersham Biosciences, Piscataway, NJ), and the amount of incorporated S35 measured on a Typhoon 9400 Variable Mode Imager (Molecular Dynamics) using ImageQuant 5.2 software. The identity of the band corresponding to labeled cyclin D3 was confirmed by comparison to an immunoblot from a parallel sample run on the same gel probed with antibody to cyclin D3.
Cell cycle analysis
1 × 10⁶ Ba/F3-Bcr-Abl cells were treated with inhibitors, and at each time point cells were harvested, fixed in ethanol, washed, and stained in propidium iodide (PI)-staining solution (10% Na Citrate, 10% NP-40, 50 μg/ml PI, and 50 μg/ml RNase A. Cells were then analyzed on a FACSCalibur flow cytometer (San Jose, CA), and cell cycle analysis performed using FlowJo software v.5.7.2 (Ashland, OR).
Colony forming assays
MNCs were obtained as described above. To overcome the potential numerical limitations of performing CFA’s using peripheral blood mononuclear cells (PB MNC), we adapted protocols that were kindly provided by Drs. Junia Melo and Ravi Bhatia (Deininger et al., 1997; Holtz et al., 2002). The Bhatia protocol calls for a 96 hour pre-incubation period in liquid culture with the inhibitors of interest, followed by plating in methylcellulose. This two-step procedure allows specific drug effects on committed progenitors to be assessed, as opposed to any drug effects on the progeny of committed progenitors when drugs are added to the methylcelluose. In addition, the pre-incubation period allowed us to incubate large numbers (150–500 × 103) of PB MNCs for each condition, and resulted in numbers of colony forming units being that were within the ideal 2-log range for the Melo CFA which employs a 96-well plate format. In brief, after thawing, cells were grown in RPMI supplemented with a growth factor cocktail (GF) consisting of 20 ng/ml rhGM-CSF, recombinant IL-3 (PeproTech, Rocky Hill, NJ), recombinant human stem cell factor (PeproTech, Rocky Hill, NJ), and 100 ng/ml rhG-CSF for 96 hrs in the presence or absence of drug or diluent. Cells were then harvested and washed twice in RPMI, and plated in 100 μl of ‘complete’ methylcellulose medium (Methocult H4434; Stemcell Technologies Inc, Vancouver, Canada) in a 96-well plate. All clonogenic assays were performed in duplicate or triplicate. Colonies were scored under an inverted microscope. The scoring criteria for colonies required at least 50 cells per colony on day 7. Counting was performed by two independent observers.
Analysis of combined drug effects
To assess drug synergy, a dose response analysis was performed according to the method of Chou using CalcuSyn software (Version 1.1, Biosoft, Ferguson, MO) (Chou, 1994). The drugs were considered to act by mutually exclusive mechanisms. A fixed concentration ratio of rapamycin to imatinib of 1:1200 was employed. The dose response curves for the single agents and their combination were performed in triplicate in three independent experiments and averaged for analysis.
Acknowledgments
We thank Drs. Aimee Edinger, Hung Fan, David Fruman, Eric Stanbridge and Craig Walsh for valuable discussions about the work. We are also indebted to Drs. Vitaly Polunovsky and Junia Melo for providing the protocols for the cap-binding and colony forming assays respectively, as well as Dr. Brain Druker for the kind gift of theBa/F3- Ba/F3-Bcr-Abl-T315I cells. Financial support: 1RO1 CA107041, 1R21 CA112936, 1R21 CA105514, RO1 EB004436, and the Waltmar Foundation.
References
- Altmann M, Schmitz N, Berset C, Trachsel H. Embo J. 1997;16:1114–21. doi: 10.1093/emboj/16.5.1114. [DOI] [PMC free article] [PubMed] [Google Scholar]
- Avdulov S, Li S, Van M, Burrichter D, Peterson M, Perlman DM, Manivel JC, Sonenberg N, Yee D, Bitterman PB, Polunovsky VA. Cancer Cell. 2004;5:553–63. doi: 10.1016/j.ccr.2004.05.024. [DOI] [PubMed] [Google Scholar]
- Bordeleau ME, Matthews J, Wojnar JM, Lindqvist L, Novac O, Jankowsky E, Sonenberg N, Northcote P, Teesdale-Spittle P, Pelletier J. Proc Natl Acad Sci U S A. 2005;102:10460–5. doi: 10.1073/pnas.0504249102. [DOI] [PMC free article] [PubMed] [Google Scholar]
- Bushell M, Poncet D, Marissen WE, Flotow H, Lloyd RE, Clemens MJ, Morley SJ. Cell Death Differ. 2000;7:628–36. doi: 10.1038/sj.cdd.4400699. [DOI] [PubMed] [Google Scholar]
- Choi KM, McMahon LP, Lawrence JC., Jr J Biol Chem. 2003;278:19667–73. doi: 10.1074/jbc.M301142200. [DOI] [PubMed] [Google Scholar]
- Chou TC. Contrib Gynecol Obstet. 1994;19:91–107. [PubMed] [Google Scholar]
- Chu S, Holtz M, Gupta M, Bhatia R. Blood. 2004;103:3167–74. doi: 10.1182/blood-2003-04-1271. [DOI] [PubMed] [Google Scholar]
- Daley GQ, Van Etten RA, Baltimore D. Science. 1990;247:824–30. doi: 10.1126/science.2406902. [DOI] [PubMed] [Google Scholar]
- Dancey JE. Hematol Oncol Clin North Am. 2002;16:1101–14. doi: 10.1016/s0889-8588(02)00051-5. [DOI] [PubMed] [Google Scholar]
- Decker T, Hipp S, Ringshausen I, Bogner C, Oelsner M, Schneller F, Peschel C. Blood. 2003;101:278–85. doi: 10.1182/blood-2002-01-0189. [DOI] [PubMed] [Google Scholar]
- Deininger MW, Druker BJ. Pharmacol Rev. 2003;55:401–23. doi: 10.1124/pr.55.3.4. [DOI] [PubMed] [Google Scholar]
- Deininger MW, Goldman JM, Lydon N, Melo JV. Blood. 1997;90:3691–8. [PubMed] [Google Scholar]
- Deininger MW, Goldman JM, Melo JV. Blood. 2000;96:3343–56. [PubMed] [Google Scholar]
- Donato NJ, Wu JY, Stapley J, Gallick G, Lin H, Arlinghaus R, Talpaz M. Blood. 2003;101:690–8. doi: 10.1182/blood.V101.2.690. [DOI] [PubMed] [Google Scholar]
- Edinger AL, Linardic CM, Chiang GG, Thompson CB, Abraham RT. Cancer Res. 2003;63:8451–60. [PubMed] [Google Scholar]
- Fruman DA, Ferl GZ, An SS, Donahue AC, Satterthwaite AB, Witte ON. Proc Natl Acad Sci U S A. 2002;99:359–64. doi: 10.1073/pnas.012605099. [DOI] [PMC free article] [PubMed] [Google Scholar]
- Ghaffari S, Daley GQ, Lodish HF. Leukemia. 1999;13:1200–6. doi: 10.1038/sj.leu.2401467. [DOI] [PubMed] [Google Scholar]
- Gingras AC, Kennedy SG, O’Leary MA, Sonenberg N, Hay N. Genes Dev. 1998;12:502–13. doi: 10.1101/gad.12.4.502. [DOI] [PMC free article] [PubMed] [Google Scholar]
- Gingras AC, Raught B, Gygi SP, Niedzwiecka A, Miron M, Burley SK, Polakiewicz RD, Wyslouch-Cieszynska A, Aebersold R, Sonenberg N. Genes Dev. 2001a;15:2852–64. doi: 10.1101/gad.912401. [DOI] [PMC free article] [PubMed] [Google Scholar]
- Gingras AC, Raught B, Sonenberg N. Genes Dev. 2001b;15:807–26. doi: 10.1101/gad.887201. [DOI] [PubMed] [Google Scholar]
- Gorre ME, Mohammed M, Ellwood K, Hsu N, Paquette R, Rao PN, Sawyers CL. Science. 2001;293:876–80. doi: 10.1126/science.1062538. [DOI] [PubMed] [Google Scholar]
- Haghighat A, Mader S, Pause A, Sonenberg N. Embo J. 1995;14:5701–9. doi: 10.1002/j.1460-2075.1995.tb00257.x. [DOI] [PMC free article] [PubMed] [Google Scholar]
- Heisterkamp N, Jenster G, ten Hoeve J, Zovich D, Pattengale PK, Groffen J. Nature. 1990;344:251–3. doi: 10.1038/344251a0. [DOI] [PubMed] [Google Scholar]
- Hentze MW. Science. 1997;275:500–1. doi: 10.1126/science.275.5299.500. [DOI] [PubMed] [Google Scholar]
- Hleb M, Murphy S, Wagner EF, Hanna NN, Sharma N, Park J, Li XC, Strom TB, Padbury JF, Tseng YT, Sharma S. J Biol Chem. 2004;279:31948–55. doi: 10.1074/jbc.M400638200. [DOI] [PubMed] [Google Scholar]
- Holtz MS, Slovak ML, Zhang F, Sawyers CL, Forman SJ, Bhatia R. Blood. 2002;99:3792–800. doi: 10.1182/blood.v99.10.3792. [DOI] [PubMed] [Google Scholar]
- Huang S, Houghton PJ. Curr Opin Pharmacol. 2003;3:371–7. doi: 10.1016/s1471-4892(03)00071-7. [DOI] [PubMed] [Google Scholar]
- Iervolino A, Santilli G, Trotta R, Guerzoni C, Cesi V, Bergamaschi A, Gambacorti-Passerini C, Calabretta B, Perrotti D. Mol Cell Biol. 2002;22:2255–66. doi: 10.1128/MCB.22.7.2255-2266.2002. [DOI] [PMC free article] [PubMed] [Google Scholar]
- Jacinto E, Hall MN. Nat Rev Mol Cell Biol. 2003;4:117–26. doi: 10.1038/nrm1018. [DOI] [PubMed] [Google Scholar]
- Jena N, Deng M, Sicinska E, Sicinski P, Daley GQ. Cancer Res. 2002;62:535–41. [PubMed] [Google Scholar]
- Johannes G, Carter MS, Eisen MB, Brown PO, Sarnow P. Proc Natl Acad Sci U S A. 1999;96:13118–23. doi: 10.1073/pnas.96.23.13118. [DOI] [PMC free article] [PubMed] [Google Scholar]
- Kantarjian H, Sawyers C, Hochhaus A, Guilhot F, Schiffer C, Gambacorti-Passerini C, Niederwieser D, Resta D, Capdeville R, Zoellner U, Talpaz M, Druker B, Goldman J, O’Brien SG, Russell N, Fischer T, Ottmann O, Cony-Makhoul P, Facon T, Stone R, Miller C, Tallman M, Brown R, Schuster M, Loughran T, Gratwohl A, Mandelli F, Saglio G, Lazzarino M, Russo D, Baccarani M, Morra E. N Engl J Med. 2002;346:645–52. doi: 10.1056/NEJMoa011573. [DOI] [PubMed] [Google Scholar]
- Kentsis A, Topisirovic I, Culjkovic B, Shao L, Borden KL. Proc Natl Acad Sci U S A. 2004;101:18105–10. doi: 10.1073/pnas.0406927102. [DOI] [PMC free article] [PubMed] [Google Scholar]
- Kozak M. J Cell Biol. 1991;115:887–903. doi: 10.1083/jcb.115.4.887. [DOI] [PMC free article] [PubMed] [Google Scholar]
- La Rosee P, Corbin AS, Stoffregen EP, Deininger MW, Druker BJ. Cancer Res. 2002;62:7149–53. [PubMed] [Google Scholar]
- Low WK, Dang Y, Schneider-Poetsch T, Shi Z, Choi NS, Merrick WC, Romo D, Liu JO. Mol Cell. 2005;20:709–22. doi: 10.1016/j.molcel.2005.10.008. [DOI] [PubMed] [Google Scholar]
- Lugo TG, Pendergast AM, Muller AJ, Witte ON. Science. 1990;247:1079–82. doi: 10.1126/science.2408149. [DOI] [PubMed] [Google Scholar]
- Ly C, Arechiga AF, Melo JV, Walsh CM, Ong ST. Cancer Res. 2003;63:5716–22. [PubMed] [Google Scholar]
- Majumder PK, Febbo PG, Bikoff R, Berger R, Xue Q, McMahon LM, Manola J, Brugarolas J, McDonnell TJ, Golub TR, Loda M, Lane HA, Sellers WR. Nat Med. 2004;10:594–601. doi: 10.1038/nm1052. [DOI] [PubMed] [Google Scholar]
- Meier-Kriesche HU, Kaplan B. Clin Ther. 2000;22(Suppl B):B93–100. doi: 10.1016/s0149-2918(00)89026-8. [DOI] [PubMed] [Google Scholar]
- Mohi MG, Boulton C, Gu TL, Sternberg DW, Neuberg D, Griffin JD, Gilliland DG, Neel BG. Proc Natl Acad Sci U S A. 2004 doi: 10.1073/pnas.0400063101. [DOI] [PMC free article] [PubMed] [Google Scholar]
- Morley SJ, Curtis PS, Pain VM. Rna. 1997;3:1085–104. [PMC free article] [PubMed] [Google Scholar]
- Nojima H, Tokunaga C, Eguchi S, Oshiro N, Hidayat S, Yoshino K, Hara K, Tanaka N, Avruch J, Yonezawa K. J Biol Chem. 2003;278:15461–4. doi: 10.1074/jbc.C200665200. [DOI] [PubMed] [Google Scholar]
- Notari M, Neviani P, Santhanam R, Bradley BW, Chang JS, Galietta A, Willis AE, Roy DC, Caligiuri MA, Marcucci G, Perrotti D. Blood. 2005 doi: 10.1182/blood-2005-09-3732. [DOI] [PMC free article] [PubMed] [Google Scholar]
- O’Brien SG, Guilhot F, Larson RA, Gathmann I, Baccarani M, Cervantes F, Cornelissen JJ, Fischer T, Hochhaus A, Hughes T, Lechner K, Nielsen JL, Rousselot P, Reiffers J, Saglio G, Shepherd J, Simonsson B, Gratwohl A, Goldman JM, Kantarjian H, Taylor K, Verhoef G, Bolton AE, Capdeville R, Druker BJ. N Engl J Med. 2003;348:994–1004. doi: 10.1056/NEJMoa022457. [DOI] [PubMed] [Google Scholar]
- Ottmann OG, Druker BJ, Sawyers CL, Goldman JM, Reiffers J, Silver RT, Tura S, Fischer T, Deininger MW, Schiffer CA, Baccarani M, Gratwohl A, Hochhaus A, Hoelzer D, Fernandes-Reese S, Gathmann I, Capdeville R, O’Brien SG. Blood. 2002;100:1965–71. doi: 10.1182/blood-2001-12-0181. [DOI] [PubMed] [Google Scholar]
- Parada Y, Banerji L, Glassford J, Lea NC, Collado M, Rivas C, Lewis JL, Gordon MY, Thomas NS, Lam EW. J Biol Chem. 2001;276:23572–80. doi: 10.1074/jbc.M101885200. [DOI] [PubMed] [Google Scholar]
- Parmar S, Smith J, Sassano A, Uddin S, Katsoulidis E, Majchrzak B, Kambhampati S, Eklund EA, Tallman MS, Fish EN, Platanias LC. Blood. 2005 doi: 10.1182/blood-2004-10-4003. [DOI] [PMC free article] [PubMed] [Google Scholar]
- Perrotti D, Turturro F, Neviani P. Cell Death Differ. 2005 doi: 10.1038/sj.cdd.4401606. [DOI] [PubMed] [Google Scholar]
- Rajasekhar VK, Viale A, Socci ND, Wiedmann M, Hu X, Holland EC. Mol Cell. 2003;12:889–901. doi: 10.1016/s1097-2765(03)00395-2. [DOI] [PubMed] [Google Scholar]
- Rowley JD. Nature. 1973;243:290–3. doi: 10.1038/243290a0. [DOI] [PubMed] [Google Scholar]
- Ruggero D, Montanaro L, Ma L, Xu W, Londei P, Cordon-Cardo C, Pandolfi PP. Nat Med. 2004;10:484–6. doi: 10.1038/nm1042. [DOI] [PubMed] [Google Scholar]
- Sattler M, Salgia R. Cytokine Growth Factor Rev. 1997;8:63–79. doi: 10.1016/s1359-6101(96)00047-0. [DOI] [PubMed] [Google Scholar]
- Sawyers CL. Cancer Cell. 2003;4:343–8. doi: 10.1016/s1535-6108(03)00275-7. [DOI] [PubMed] [Google Scholar]
- Sawyers CL, Hochhaus A, Feldman E, Goldman JM, Miller CB, Ottmann OG, Schiffer CA, Talpaz M, Guilhot F, Deininger MW, Fischer T, O’Brien SG, Stone RM, Gambacorti-Passerini CB, Russell NH, Reiffers JJ, Shea TC, Chapuis B, Coutre S, Tura S, Morra E, Larson RA, Saven A, Peschel C, Gratwohl A, Mandelli F, Ben-Am M, Gathmann I, Capdeville R, Paquette RL, Druker BJ. Blood. 2002;99:3530–9. doi: 10.1182/blood.v99.10.3530. [DOI] [PubMed] [Google Scholar]
- Schalm SS, Fingar DC, Sabatini DM, Blenis J. Curr Biol. 2003;13:797–806. doi: 10.1016/s0960-9822(03)00329-4. [DOI] [PubMed] [Google Scholar]
- Sicinska E, Aifantis I, Le Cam L, Swat W, Borowski C, Yu Q, Ferrando AA, Levin SD, Geng Y, von Boehmer H, Sicinski P. Cancer Cell. 2003;4:451–61. doi: 10.1016/s1535-6108(03)00301-5. [DOI] [PubMed] [Google Scholar]
- Trotta R, Vignudelli T, Candini O, Intine RV, Pecorari L, Guerzoni C, Santilli G, Byrom MW, Goldoni S, Ford LP, Caligiuri MA, Maraia RJ, Perrotti D, Calabretta B. Cancer Cell. 2003;3:145–60. doi: 10.1016/s1535-6108(03)00020-5. [DOI] [PubMed] [Google Scholar]
- Um SH, Frigerio F, Watanabe M, Picard F, Joaquin M, Sticker M, Fumagalli S, Allegrini PR, Kozma SC, Auwerx J, Thomas G. Nature. 2004;431:200–5. doi: 10.1038/nature02866. [DOI] [PubMed] [Google Scholar]
- Wendel HG, De Stanchina E, Fridman JS, Malina A, Ray S, Kogan S, Cordon-Cardo C, Pelletier J, Lowe SW. Nature. 2004;428:332–7. doi: 10.1038/nature02369. [DOI] [PubMed] [Google Scholar]
- Wullschleger S, Loewith R, Hall MN. Cell. 2006;124:471–84. doi: 10.1016/j.cell.2006.01.016. [DOI] [PubMed] [Google Scholar]