Abstract
We investigated sleep ontogenesis in the ferret—a placental mammal that is highly altricial compared to other mammalian species. Because altriciality is linked with elevated REM sleep amounts during infancy, it was expected that ferret kits would display very high levels of this state. Longitudinal polysomnographic measurements were made from 8 ferret kits from approximately eye-opening (postnatal day [P]30)-P50 using an experimental routine that minimized the effects of maternal separation. These data were compared to values from 8 adult ferrets (>3 months of age) and 6 neonatal cats (mean age: P31.7). We find that the polygraphic features of rapid-eye-movement (REM) and non-REM (NREM) sleep are present by at least P30. Over the next 2 weeks, REM sleep amounts slightly declined while wakefulness and NREM sleep amounts increased. However, a comparison to published values from developing cats and rats showed that the ferret did not exhibit a disproportionate amount of REM sleep at similar postnatal ages or relative to a common developmental milestone (eye-opening).
1. Introduction
The ferret Mustela putorius furo is a member of the family mustelidae which evolved approximately 10 – 20 million years before the appearance of modern mammals like the cat and monkey [6,11,23,28,40,43,52,57]. Sleep and sleep regulation have recently been characterized in this species [26,38]. Ferrets display the typical mammalian stages of rapid-eye-movement (REM) and non-REM (NREM) sleep and show compensatory changes in sleep amounts and sleep intensity following sleep deprivation. These findings show that ferret sleep is similar in most respects to sleep in other mammals. There are, however, two interesting oddities about ferret sleep. First, REM sleep amounts in adult ferrets are greater than in any other placental mammal—occupying approximately 35% of total sleep time. Second, ferrets exhibit a second REM-like state (termed “REM-2”[26,38]) that bears a striking resemblance to certain REM-sleep states reported in the egg-laying monotrematous platypus [26,51].
The high amount of REM sleep in the ferret may be linked to its phylogenetic status and level of altriciality. REM sleep amounts in the platypus and certain marsupial mammals, like the opossum, are much higher than in modern placental species [26,50,60]. In addition, mammals that are born with very immature nervous systems at birth (i.e. altricial species) have more REM sleep during infancy and as adults than species that complete much of their neural development in utero (i.e. precocial species) [60]. Ferrets are in fact among the most altricial of placental mammals based on comparative measures of gestation [9] and neural development [9,25,37].
In order to better characterize sleep in this species we performed a preliminary investigation of sleep ontogenesis in 8 ferret kits. We incorporated techniques previously used in studies of infant rats that permit longitudinal electroencephalograph (EEG) and electromyograph (EMG) recordings while minimizing the effects of maternal separation [17,18]. This allowed us to measure ontogenetic changes in sleep and wakefulness and vigilance state EEGs across postnatal development spanning the pre-weaning and post-weaning periods. These data were compared to measurements made in neonatal cats and adult ferrets and published values in other developing mammals to provide additional phylogenetic and ontogenetic comparisons.
2. Materials and methods
2.1. Subjects
Subjects were five male and three female ferret kits obtained from 4 time-plugged Jills (Marshall Farms). Prior to surgery and during post-operative recovery, they remained with their siblings and Jill in our colony room and were maintained on a 12:12 light-dark (L: D) cycle (lights on at 7 am) at 26–27° C ambient. The Jills and weaned kits were provided food and water ad lib. All procedures were approved by the Institutional Animal Care and Use Committee of the University of Pennsylvania.
2.2 Surgical Procedures
At postnatal (P) day P18–20 (n=2) or at P25 (n=6), ferret kits were surgically prepared for polysomnographic recordings using techniques previously used in infant rats and cats [18,20]. Anesthesia was maintained with isoflorane gas via a face mask and the head was fixed in a mouse stereotaxic device. Heart rate, respiratory rate and body temperature were monitored at regular intervals during surgery. Four stainless steel screw electrodes were bilaterally implanted in the skull 1–2mm rostral to Bregma, and between Bregma and Lambda (approximately 2–3 mm from midline). Two additional anchor screws were placed just anterior to the rostral EEG electrodes. Three stainless steel wire electrodes were implanted in the neck muscles for recording the nuchal bipolar electromyogram (EMG). In some kits, two stainless steel wire electrodes were also implanted in the muscles near the infraorbital ridge for electroocculogram (EOG) recording. Leads from these recording electrodes were routed to a 12 pin miniature electrical socket. Post-operative pain and potential infection were controlled with buprenex (0.01 mg/kg wt, i.m.) and baytril (5 mg/kg wt, i.m.). Animals were allowed to recover from surgery for a minimum of 4–5 days prior to initiation of the recording procedure.
2.3 Recording Procedures
After recovery from surgery, ferret kits were weighed and connected to a lightweight, electrical cable which was attached to a commutator. They were then individually placed in a custom-made incubator [18” × 8” × 10”] that was partially filled with nest material and warmed by a self-enclosed water pad. This was necessary because like other brood animals [18], ferret kits keep warm by huddling together and by staying close to the Jill. The incubators were warmed by a heating pad to maintain a temperature gradient that varied from approximately 35°–36°C to 30° C on different portions of the incubator floor. The freely-moving kits could then self-select temperatures during each recording session. The oldest ferrets (P50) were maintained at colony temperatures (i.e. at ages when huddling was not observed). Pre-weaned and weaning (>P40) kits were hand-fed KMR milk formula (2–3cc’s) and were habituated to these conditions for 3–4 hours prior to the initiation of baseline sleep recording. They were also groomed with a moistened cotton ball to stimulate micturition and defecation according to schedules previously used to control for maternal separation in infant rats [18]. Weaned kits (P40+) were placed in the incubators the night before a scheduled recording session and were provided food and water ad lib.
Polysomnographic recordings were made in each animal (10/11am–4pm) beginning at P25 (2 kits) or P30 (6 kits) and then every five days thereafter until P50 (female ferrets reach sexual maturity between 7–11 months depending on photoperiod [46]). At the end of each scheduled recording session, the kits were returned to their home nests. At the end of the last recording session in a series, the animals were euthanized with an overdose of Nembutal (150 mg/kg wt).
2.4 Signal Processing and Data Analysis
Polysomnographic recordings were amplified with a Grass Model 15 LT physiodata 8 channel amplifier system and recorded on a PC with commercial sleep acquisition/analysis software (Kissei Comtec America, INC). Polygraphic signals were processed with a high-pass (EEG: 0.3 Hz; EOG, EMG : 10 Hz) and low-pass (100 Hz) filter and digitized at 200 Hz.
Computerized polysomnographic records were visually displayed, divided into 4 second epochs and manually scored using commercial software employing criteria similar to those previously used in the adult ferret [26] and neonatal rats [18] and cats [20]. Epochs with low voltage and high frequency EEG waves associated with increased motor activity were identified as wakefulness. Epochs with high voltage and low frequency EEG waves (0.5 – 4 Hz) and decreased motor activity were characterized as NREM sleep. Epochs with low voltage and high frequency EEG waves and EMG minima sometimes accompanied by bursts of myoclonia were identified as REM sleep. REMs were also observed in this state; however we were not always able to record stable EOGs in all cases as the EOG electrodes tended to move out of position during the course of postnatal development. We also carefully screened the EEG/EMG data for signs of ‘REM-2’; a type of REM-sleep found in adult ferrets characterized by a mixture of high voltage and fast EEG activity [26,38]. After state assignments, we conducted the following analyses at each developmental time-point.
Sleep-wake architecture
The mean percentage of each vigilance state was expressed as a % of total recording time (TRT). Sleep amounts were also expressed as a % of total sleep time (TST). We also calculated the average durations of individual episodes of REM sleep, NREM sleep and wakefulness. For statistical comparisons to adult ferret data and data in the neonatal cat (see below), the minimum bout length was set at 8 seconds [26]. We then calculated the number of sleep-onset REM sleep periods (SOREMs) and latencies to REM sleep. SOREMs were scored when a sustained REM sleep episode of at least 1 minute in duration occurred immediately following (i.e. within 8 seconds) a period of sustained waking (of at least 1 minute in duration). REM latencies were calculated in two ways. First, we employed a latency rule adopted from an earlier study in neonatal rats, which are also highly polyphasic with respect to sleep and wakefulness and therefore do not exhibit sustained arousal periods as observed in humans and primates [21]. REM latency was defined as the amount of time elapsed between sustained REM sleep episodes of at least 1 minute in duration. The second measure of sleep latency was similar to that used in adult ferrets [26]; in this case, we identified the longest waking period in each recording and then calculated the latency to the first sustained REM sleep episode immediately following that period.
Sleep cycle analyses
We tabulated the length and number (per hour) of sleep cycles across development. This was accomplished using procedures adopted from studies of sleep cycles in adult animals (see [3,4]). A sleep cycle was scored when a period of sustained REM sleep (of at least 1 minute in duration) was followed by at least 1 minute of sustained NREM sleep (intervening wake episodes were excluded). The onset of the next REM sleep or waking episode (of at least 1 minute in duration) was considered the end point of the preceding cycle. This is essentially the same analysis previously used in the rat [3] with the exception that a 1 minute rule instead of a 30-second rule is used. This is because this better approximates episode durations previously used in the neonatal cat [8,39] and reflects the fact the most episodes of REM and NREM are ≥ 1 minute in the developing ferret (see Supplementary Figure 1).
A consistent finding in adult humans, rodents, monkeys and cats is that REM sleep duration is positively correlated with the length of subsequent ‘non’ REM sleep intervals (NREM sleep or combined NREM & wake intervals) [2,5,34,55,56,58]. It has been suggested that this reflects a feed-forward regulatory mechanism that controls the timing of REM sleep [58]. To determine if similar regulatory mechanisms are present in developing ferrets, we adopted rules used by Vivaldi et al., in their study of this process in adult rats [58].
Individual REM sleep episodes of at least 1 minute in duration were identified and the durations of succeeding NREM bouts of at least 1 minute in duration were tabulated. Spearman Rank Order correlations were computed between REM bout lengths and succeeding NREM bout lengths. This procedure is similar to smoothing rules used by Vivaldi et al., [58] and is consistent with bout lengths used previously in neonatal cats [8,39].
EEG analyses
Maturational changes in vigilance state EEGs were quantified by spectral analysis and the following normalization procedures. To asses the overall emergence of state-specific EEG patterns at each time-point, Fourier transformed EEGs (using a 0.25 Hz bin width) were normalized to the mean power across all EEG frequencies and across all states [19,22]. Briefly, we first calculated the power spectrum across all frequencies for each vigilance state. We then averaged the power values from 0.5–40 Hz across all states. This gives a single normalization value that we then divide the original power spectrum frequencies for each state by. This normalization corrects for differences in absolute power between EEG recordings in different animals. These normalized EEGs were used to generate mean spectral profiles of EEGs in each vigilance state as described previously [22,26]. To determine the relative changes in different EEG frequency bands across development [18], EEG profiles in REM sleep, NREM sleep and wakefulness were also expressed as a % of their respective P30 values. These latter two analyses were restricted to those kits where we were able to record EEGs from the same electrodes throughout postnatal development (n=5). We also measured developmental changes in NREM delta (0.5–4.0 Hz) and REM sleep theta (4.25–9.0 Hz) EEG energies using a normalization procedure originally used in the developing rat and cat [18,20] (NREM delta/REM delta; REM theta/REM delta).
2.5 Adult Comparison Data
Sleep and waking normative values from 8 adult ferrets (>3 months of age) from a previous study were partially reproduced here to provide comparison data (reproduced with permission from Jha. et al., 2006). These adult ferrets were housed under identical conditions as the Jills and recorded under similar conditions as described previously [26]. To approximate the recording times used in this study, only data from the light phase (in baseline periods: 7am–7pm) were used. For sleep cycle and bout duration analyses, transitions between states were excluded and ‘REM-2’ was combined with REM sleep [26].
2.6 Neonatal Cat Comparison Data
To provide a cross-species comparison with the neonatal ferret, we also measured sleep-wake expression in P30–P32 neonatal cats (n=6; mean age at recording ± SEM, P31.7 ± 0.76). At P25–P28, cats were anesthetized and prepared for chronic implant surgery according to previously described methods (Frank et al. 2001) and as described above for the neonatal ferret. Four stainless steel screw electrodes were bilaterally implanted in the skull 1–2mm rostral to Bregma, and between Bregma and Lambda (approximately 2–3 mm from midline). Four additional anchor screws were placed just anterior to the rostral EEG electrodes and lateral to the caudal EEG electrodes. Three stainless steel wire electrodes were implanted in the neck muscles for recording the nuchal bipolar electromyogram (EMG). Following 4–5 days of post-operative recovery the cats were placed in an illuminated sleep-recording chamber (22°–24° C). The cats (which are weaned at this age) were provided food and water ad lib for the duration of the acclimation (3–4 hours) and recording period (6 hours). All data collection began at approximately 10:00–11:00 am (three hours from lights-on). The animals were left undisturbed during the recording period. The data were then analyzed as described for the neonatal ferret with the exception that 8 second epochs were used as described previously [27].
2.7 Statistical Analysis
Developmental changes in sleep architecture data were first tested for normality using the Kolmogorov-Smirnov and equal variance tests (unless indicated otherwise, data are presented as means ± SEMs). Data sets that passed these tests were then assessed with parametric statistics (Student’s t-tests for planned, single comparisons, ANOVAs followed by Student-Newman-Keuls (SNK) tests in all other cases); otherwise, Kruskall-Wallis ANOVAs followed by Mann-Whitney-U (MWU) tests were used. For correlation analyses, a Spearman Rank Order correlation was used as REM and NREM episode durations were not normally distributed based on measures of skewness and kurtosis. For spectral EEG analyses, Fourier transformed EEGs in NREM, REM and wakefulness (0–40 Hz) from P35–P50 were compared to state-matched EEGs from P30 using a 2 factor ANOVA (EEG frequency and age as levels) followed by Holm-Sidek post-hoc tests. All statistics were calculated using SigmaStat software (Systat, Richmond, CA).
2.8 Meta-analyses of sleep ontogeny in cats, rats and ferrets
To provide additional phylogenetic/ontogenetic comparisons we compared our data with previous findings in the adult and developing rat, cat and ferret [1,3,18,26,29,35,36,39,49,54]. Because different recording times, epoch lengths and cycle calculations were often used across studies, we restricted our analyses to total REM and NREM sleep time (as a % of total sleep time). Adult data from baseline 24-hour recordings were averaged across studies to provide a single value each for the adult cat, rat and ferret. All developmental data were extrapolated and averaged from previous studies and aligned using the approximate age of eye-opening as a common developmental marker. This allowed us to present data from the developing cat, rat and ferret side by side in approximately 5 day intervals.
3. Results
3.1 Behavioral Observations
Of the 8 ferret kits, all had good polygraphic signals from P30 to P50. As shown in Table 1, all kits gained weight across postnatal development and all showed normal maturation (i.e. eye-opening between P30–P35, weaning by P35–P40). Ferret kits readily adapted to the incubators and within 30–40 minutes (in the youngest kits) and within 1 hour (in the weaned kits) rapidly fell asleep. P25–P40 kits generally self-selected the warmest areas of the incubator, whereas weaned kits (P45+) either showed no preference or chose the cooler areas. In 2 kits we were occasionally able to record EEG and EMG activity beginning at P25 (data not shown). We could not, however, quantify these observations as the EEG recordings were frequently contaminated with movement artifacts—thus the total amount of each state during each recording session could not be accurately tabulated. This was due to the very soft skull in ferrets of this age. Therefore we restricted our analyses to P30 and later dates.
Table 1.
Body Mass Across Development
| Postnatal Age (days) | grams (mean ± SEM) |
|---|---|
| P30 | 129.75 ± 2.3 |
| P35 | 156.57 ± 4.0 |
| P40* | 183.57 ± 4.0 |
| P45* | 208.43 ± 6.9 |
| P50* | 268.25 ± 13 |
weaned kits
3.2 Maturation of Vigilance-State EEGs: P30–P50
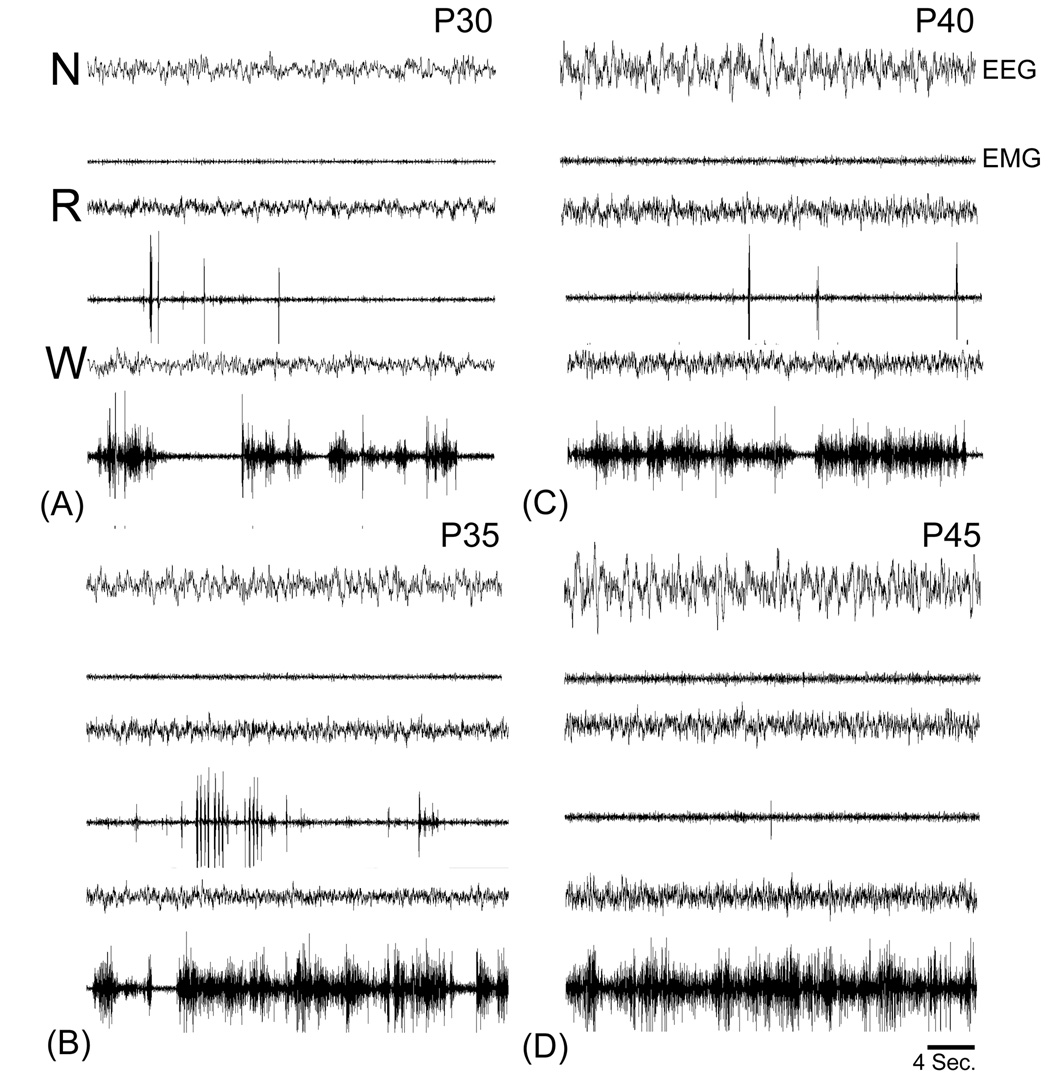
As shown in Figure 1, the states of NREM sleep, REM sleep and wakefulness were evident by P30. We did not see clear signs of ‘REM-2’, indicating that this type of REM sleep appears relatively late in development.
Figure 1. Maturation of vigilance state EEGs in the ferret.
Data are representative EEG and EMG traces from the same kit shown in Figure 1 obtained at P30 (A) through P45 (D). Note the increase in EEG amplitude in NREM (N) sleep, REM (R) sleep and wakefulness (W) across postnatal development. Amplification and filtering was held constant across recording sessions (1000x see Materials and Methods).
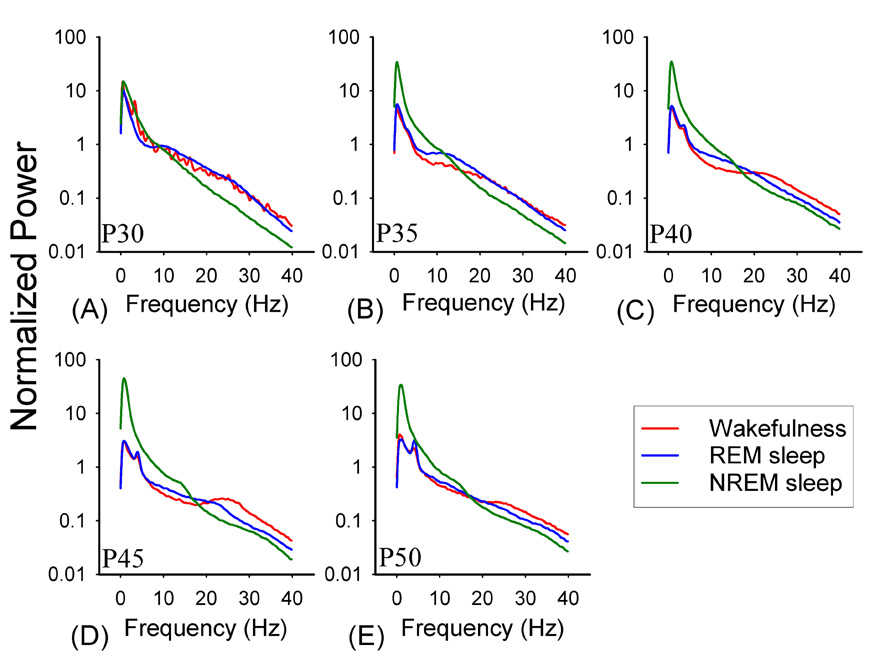
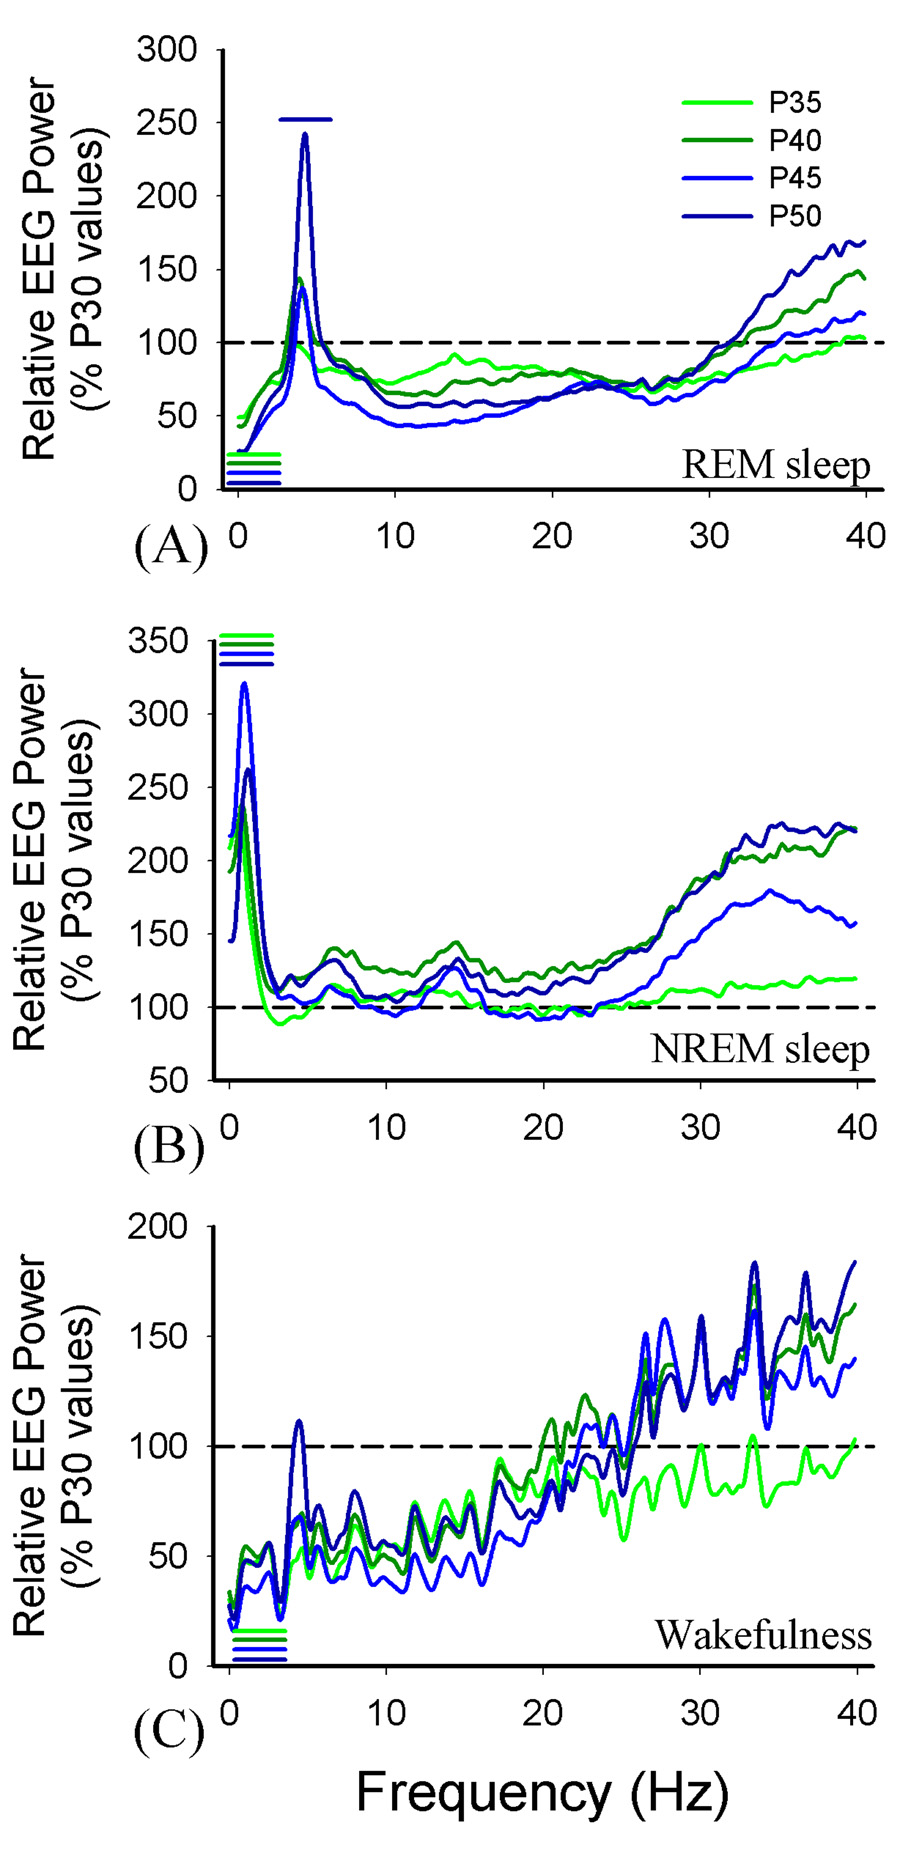
EEG patterns typical of all three states became more distinct during the course of postnatal development (see Figures 2). Statistical analyses of the Fourier transformed waveforms (Figure 3) showed that in NREM sleep there was a progressive increase in the amplitude of slow EEG waves (approximately 0–2 Hz) relative to P30 (ANOVA vs. P35, F= 5.7, p<0.001; vs. P40, F=10.8, p<0.001, P45 F=27.6, p<0.001, P50 F= 13.9, p<0.001). There was also an elevation in higher frequency bands across development (approximately 30–40 Hz), but this did not reach significance. In REM sleep, there were two significant changes. First, there was a progressive reduction of energy in the slow (0–2.5 Hz) EEG bands (ANOVA vs. P35 5.131, p<0.001; vs. P40 F= 4.8, p<0.001; vs. P45 F= 10.11, p<0.001; vs. P50 F= 12.2, p<0.001) and an increase in theta bands (3.9–4.7Hz) which became significant by P50 (Holm-Sidek, p<0.05). We observed a similar progressive decrease in energy in EEG slow bands (0–3.5 Hz) during wakefulness (ANOVA vs. P35, F= 2.5, p <0.01; vs. P40, F= 3.2, p<0.001; vs. P45, F=3.5; vs. P50 F=3.3, p<0.001).
Figure 2. EEG spectral profiles of vigilance state EEGs.
Data are mean (normalized) Fourier transformed EEGs from REM sleep, NREM sleep and wakefulness (P30–P45 n=8, P50 n=6, P55 n=4). Note that NREM slow-wave activity increases sharply between P30 (A) and P35 (B) and that a peak in the theta frequencies is first evident at P40 (C).
Figure 3. Relative changes in EEG spectra.
Data are Fourier transformed EEGs shown in Figure 3 normalized to P30 spectra. The colored lines indicate regions of the spectrum that were significantly different in power (p<0.05; see Results) relative to P30 values (shown as a reference line at 100%).
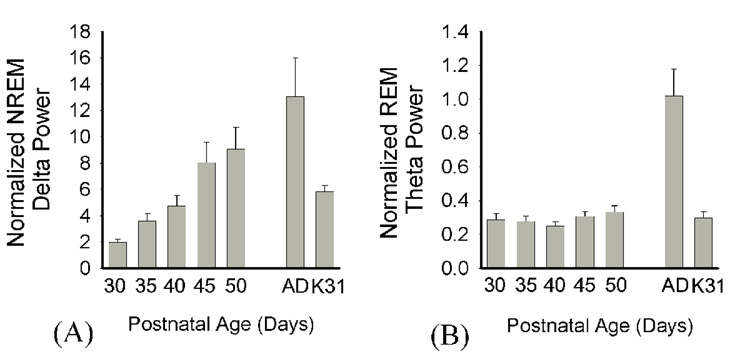
When normalized NREM delta power (0.5–4.0 Hz) and REM theta power (5.0–8.0 Hz) were analyzed separately (Figure 4) we observed that the former did not significantly differ from adult values by P45 (Kruskall-Wallis H=35.6, p<0.001; MWU p<0.05, P30 & P35 vs. adult, P45+ vs. adult, ns.). When compared to the P30–32 cats, however, NREM delta in the ferret was significantly lower until P40 (relative power units, P30 delta: 1.98 ± 0.07, P35 delta: 3.6 ± 0.2, P30–32 cat delta: 5.82 ± .5; MWU p<0.05); thus with respect to this aspect of NREM sleep, the ferret is approximately 10 days developmentally delayed relative to the cat. In contrast, REM sleep theta remained low throughout postnatal development relative to adult values (Kruskall-Wallis H=25.06, p<0.001; MWU p<0.05 adult vs. P30–P50) and did not significantly differ at any age to REM theta in the cat (MWU p<0.05).
Figure 4. Normalized NREM delta and REM theta power across development.
Data are normalized (mean ± SEM) NREM sleep delta and theta EEG power values from P30–P50 with adult normative values and P30–32 cat (mean age=P31.7) values provided for comparison. P30 delta < P35-AD & K31; P30 theta vs. AD, p<0.05. Adult comparison data are indicated by “Ad”, P30–32 cat data by “K31”.
3.3 Maturation of Sleep/Wake Architecture: Changes in state amounts
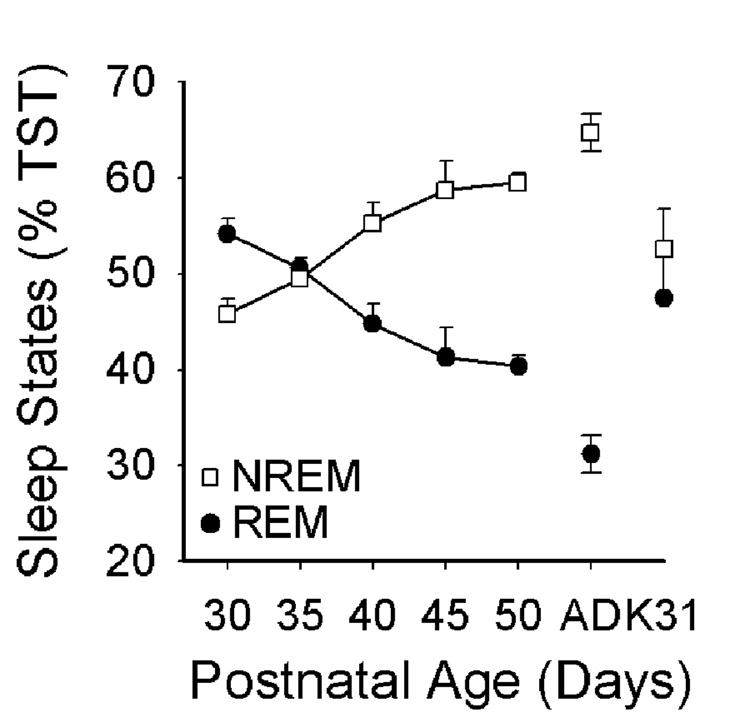
There were several changes in sleep and wake amounts during postnatal development. REM sleep amounts slightly declined both as a % of total recording time (TRT: Figure 5A–C) and as a % of total sleep time (Figure 6). This was most apparent after P35 as REM sleep amounts (as a % of TRT) dropped from 42% ± 1.4% to 30.2 % ± 1.9 % from P35 to P50 (ANOVA F= 19.1, p<0.001). There was also a significant decline in REM sleep from P30–P50 as a % of total sleep time (TST), from 54.2% ± 1.6% to 40.4% (ANOVA F= 12.7, p<0.001). However, the P50 REM values remained significantly higher than values in adult ferrets (20.3% ± 1.9% TRT; 31.2 % ± 2.8% TST, SNK p<0.001). Interestingly, the amount of REM sleep as a % of TRT and TST in P30–P35 ferrets did not significantly differ from amounts in P30–P32 cats (TRT: P30 44.9 % ± 1.2%, P35 42% ± 1.4%, P30–32 cat 38.9% ± 2.4%; TST: P30 54.2% ± 1.6%, P35 50.5% ± 1.03%, P30–32 cat 47.5% ± 1.7%; SNK ns); although REM sleep amounts in P30–32 cats were higher than those in adult ferrets (SNK, p<0.05). Thus in contrast to developmental changes in NREM EEG delta power, REM sleep amounts were similar in cats and ferrets at comparable postnatal ages.
Figure 5. Changes in sleep/wake architecture across postnatal development.
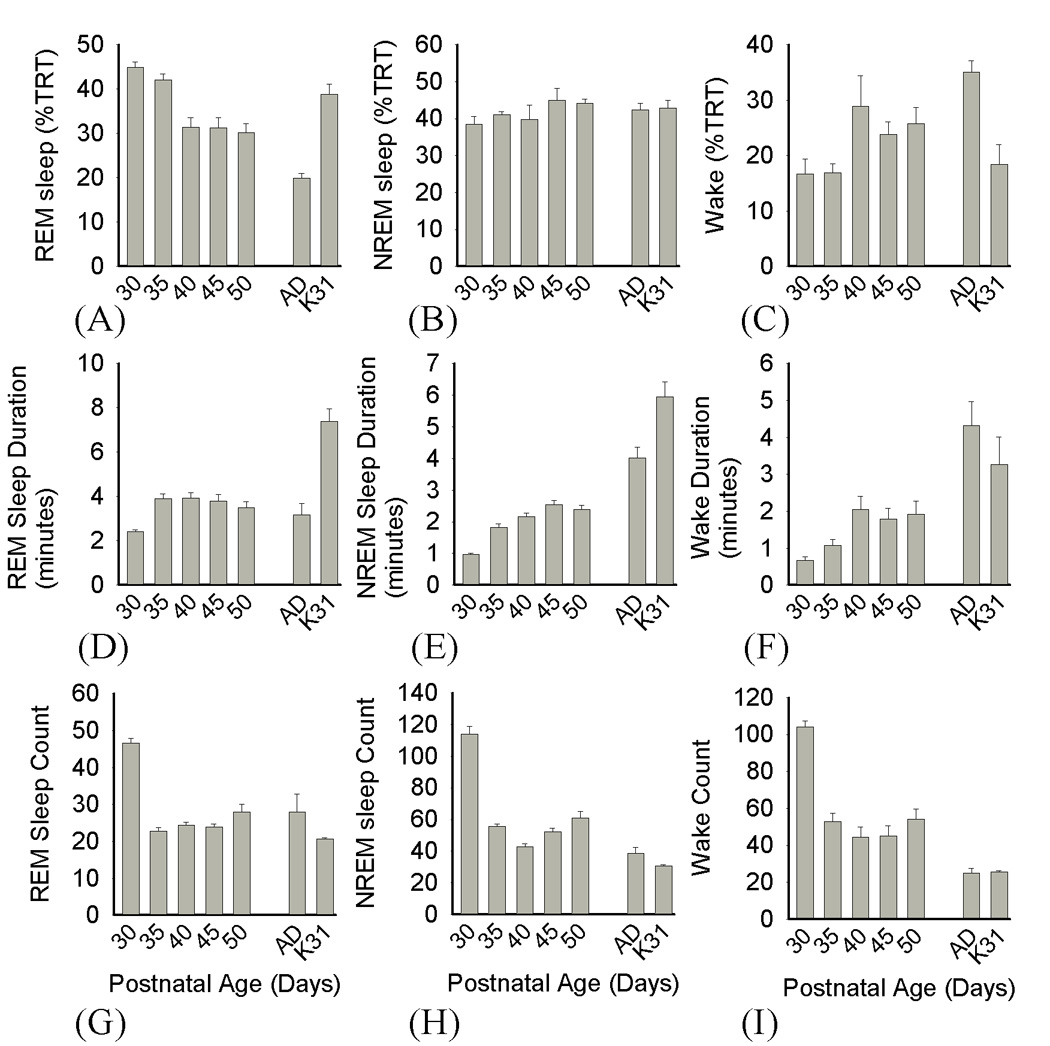
(A–C) Mean ± SEM vigilance state amounts as a % of total recording time (TRT) [P30 REM>P40-AD, AD vs. K31: p<0.05; NREM, all comparisons: ns; P30 wake < P40 & AD, K31 vs. AD: p<0.05]. (D–F) Mean ± SEM vigilance state durations in minutes [P30 REM < P35-AD & K31, K31 vs. AD; P30 NREM < P35-AD & K31, K31 vs. AD; P30 wake < P40 & AD: p<0.05]. (G–I) Mean ± SEM frequency of vigilance state episodes [P30 REM > P35-AD & K31; P30 NREM > all; P30 wake frequency > all: p<0.05]. Adult comparison data are indicated by “Ad”, P30–32 cat data by “K31”.
Figure 6. Changes in REM and NREM sleep as a % of total sleep time (TST) across development.
Data are mean ± SEM REM sleep and NREM sleep amounts in P30–50 ferret kits and adult ferrets (AD) and P30–32 cats (K31). P30 NREM < P40-AD, AD vs. K31; P30 REM > P40-AD, AD vs. K31; p<0.05. Adult comparison data are indicated by “Ad”, P30–32 cat data by “K31”.
In contrast to REM sleep, NREM sleep amounts either as a % of TRT or TST exhibited more modest changes during postnatal development. For example, there were no significant changes in NREM sleep as a % of TRT from P30 to P50, and no differences between any time point and values from adult ferrets or P30–P32 cats (ANOVA F=0.774, p=0.6). When expressed as a % of TST, however, NREM time significantly increased (ANOVA F=9.16, p<0.001) from P30 to P40 (45.8% ± 1.6% to 55.3% ± 2.2%, SNK p<0.05), but remained below adult values at all other time points (adult: 66.7% ± 2.6% SNK p<0.05). As was true for REM sleep, the amount of NREM sleep as a % of TST in P30–P32 cats was comparable to age-matched ferrets (P30–32 cat 52.5% ± 1.7%, ferret P30 45.8% ± 1.6%, P35 49.5% ± 1.03%; SNK ns), but lower than values in adult ferrets (SNK, p<0.05).
There were no significant changes in wakefulness amounts as a % of TRT until P40 (Kruskal-Wallis H=21.5, p<0.002, P30 16.7 % ± 2.8%, P40 28.9 % ± 5.5%; MWU p<0.05). However, waking amounts in P30–P35 ferrets did not differ from values in P30–32 cats and both were significantly lower than values from adult ferrets (P30–32 cat 18.4% ± 3.6%, adult ferrets 35.1 % ± 2.0 %, MWU p<0.05).
3.4 Maturation of Sleep/Wake Architecture: Changes in State Durations
As shown in Figures 5D–F there was an overall lengthening of vigilance state episodes across postnatal development. In the case of REM sleep, this appeared to plateau at P35, after which there no further significant changes in REM sleep episode duration (Kruskal-Wallis H= 25.8, p<0.001; P30 2.5 ± 0.2 [minutes], P35 3.84 ± 0.4, MWU p<0.05; P35 to adult values, ns.). There was, however, a striking difference in REM sleep durations when ferrets and cats were compared (kitten 7.4 ± 1.6 vs. P30-adult ferrets, MWU p<0.05).
There was also a significant increase in NREM sleep episode duration from P30–P35 (Kruskal-Wallis H= 35. 8, p<0.001; P30 1 ± 0.1 [minutes], P35 1.82 ± 0.2; MWU p<0.05), but no further significant increases from P35–P50 (MWU ns). Ferret kit NREM duration values at all ages remained lower than those in adult ferrets and P30–32 cats (adult ferret 4.32 ± 0.5, P30–32 cat 5.9 ± 0.5; MWU p<0.05). Waking episodes were also initially very brief in duration and lengthened from P30–P35 (Kruskal-Wallis H=26.99, p<0.001; P30 0.69 ± 0.14 [minutes], P35 1.1 ± 0.1, MWU p<0.05). They then remained below adult values from P30–P50 (adult 8.97 ± 2.3 MWU, p<0.05). Waking episodes in ferret kits and age-matched cats were significantly different—as kitten wake episodes were 2–3 times as long as those in P30–P35 ferrets (kitten 3.3 ± 0.8 vs. P30 & P35 kits, MWU p<0.05). The lengthening of vigilance state episodes was accompanied by a significant decline in episode number (Figure 5G–I) which was most evident between P30 and P35 (NREM sleep, Kruskal-Wallis H=29.8, p<0.001; REM sleep H=25.6 p<0.001; Wakefulness, ANOVA F=10, p<0.001). In addition, episode frequencies in all states were significantly higher in P30 ferrets compared to similarly aged cats (MWU and SNK, p<0.05).
3.4 Maturation of Sleep/Wake Architecture: SOREMS, REM latencies and Sleep cycle analyses
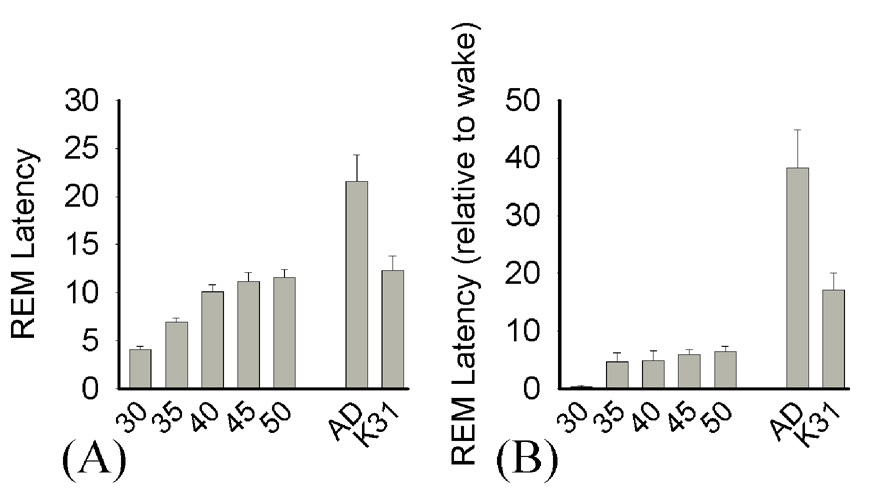
Two measures of REM sleep latency showed that latencies increased across development (Figure 7). For example, the total time elapsed between REM sleep episodes increased from 4.1 ± 0.3 minutes at P30 to 11.5 ± 1 minutes at P50 (Kruskal-Wallis H=36.0, p<0.001; MWU, p<0.05), and latencies to REM sleep from the longest waking period in each recording also increased from P30 (24 ± 6.9 seconds) to P50 (6.4 ± 1 minutes) (Kruskal-Wallis H=27, p<0.001; MWU, p<0.05). Both measures showed that REM latencies remained significantly shorter than adult ferret values (adult ferret, total time elapsed between REM periods: 21.6 ± 3.7 minutes; from longest wake period: 38.3 ± 6.5 minutes vs. P30–P50, MWU p<0.05). When compared to data from P30–32 cats, REM latencies were also significantly shorter at similar ages. For example, based on elapsed time between REM sleep episodes, ferret kits did not exhibit latencies comparable to the kitten until P40 (ferret kits, P30 4.1 ± 0.3 minutes, P35 6.9 ± 1.5, P40 10.1 ± 0.7; P30–32 cat 12.3 ± 1.6 MWU vs. P30–P35 p<0.05). Based on time elapsed after the longest waking period at each time point, ferret kit latencies remained significantly shorter than latencies in the P30–32 cat at all ages (P30–32 cat, 17.2 ± 2.9 minutes, MWU vs. P30–P50 ferret kits, p<0.05). A small number of SOREMs were also observed in the P30 ferret kits (only 5 instances in all kits), but were absent after P30.
Figure 7. REM sleep latencies across postnatal development in the ferret.
Mean (± SEM) REM latency was calculated as (A) the time elapsed (in minutes) between REM sleep episodes or (B) time elapsed from the longest waking period to the first REM sleep episode. A: P30< P35-AD & K31, AD vs. K31 p<0.05; B: P30< P35-AD, AD vs. K31 p<0.05. Adult comparison data are indicated by “Ad”, P30–32 cat data by “K31”.
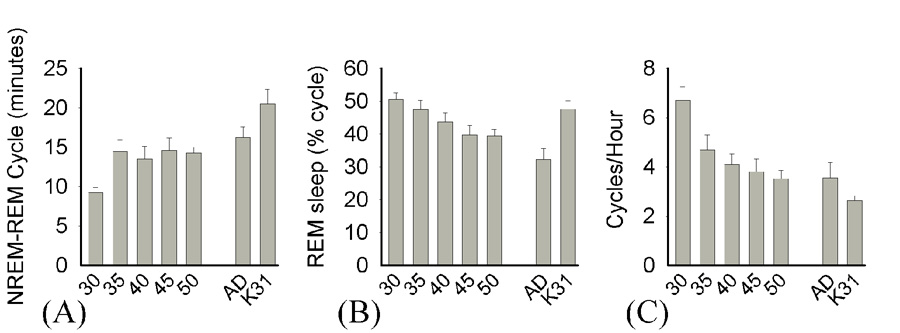
We also examined several properties of sleep cycles across development (Figure 8). First, we found that the average length of sleep cycles increased from P30–P35 (P30 9.2 ± 0.7, P35 14.4 ± 1.5 minutes) and then reached a plateau by P40 (13.5 ± 1.6 minutes), at which time cycle lengths did not significantly differ from adult values (16.2 ± 1.3 minutes) (ANOVA F= 6.2, p<0.001, P30 vs. P35, SNK p<0.05; P35–P50 vs. adult, ns). Interestingly, cycle lengths in the P30–32 cat were significantly higher than the ferret at all time points (P30–32 cat, 20.6 ± 1.8 minutes; SNK vs. P30-adult, p<0.05). Second, we observed that the % of REM sleep in each cycle steadily decreased across development from 50.5% ± 2% at P30 to 39.4% ± 2% by P50 (ANOVA F=6.7, p<0.001) and did not significantly differ from adult values by P45 (P45: 39.7 % ± 2.9%, adult: 32.2% ± 3.4%; SNK ns). The % of REM sleep in P30–32 cat cycles, however, only differed from adult ferret values (51.6% ± 2.5%; SNK vs. adult ferret, p<0.05, vs. P30–P50 ferret kits, ns). Lastly, the frequency of sleep cycles also declined from P30–P40 (Kruskal-Wallis H=21.1 p<0.002) and did not differ from adult values thereafter (P30: 6.7 ± 0.6 cycles/hour, P35: 4.7 ± 0.6, P40: 4.1 ± 0.43, adult 3.6 ± 0.6; P30 vs. P40, MWU p<0.05, P40–P50 vs. adult MWU ns). Sleep cycle frequency in P30–32 cats, however, was significantly lower than in P30–P50 ferret kits, but not in adult ferrets (P30–32 cat 2.64 ± 0.2; MWU cat vs. P30–50, p<0.05).
Figure 8. Sleep cycles in the developing ferret.
(A) Mean ± SEM sleep cycle lengths in minutes [P30 < P35-AD & K31, p<0.05] (B) Mean ± SEM REM amounts as a % of each cycle [P30 > P40-AD, AD vs. K31, p<0.05] (C) Mean ± SEM number of sleep cycles per hour [P30 > P45-AD & K31, p<0.05]. Adult comparison data are indicated by “Ad”, P30–32 cat data by “K31”.
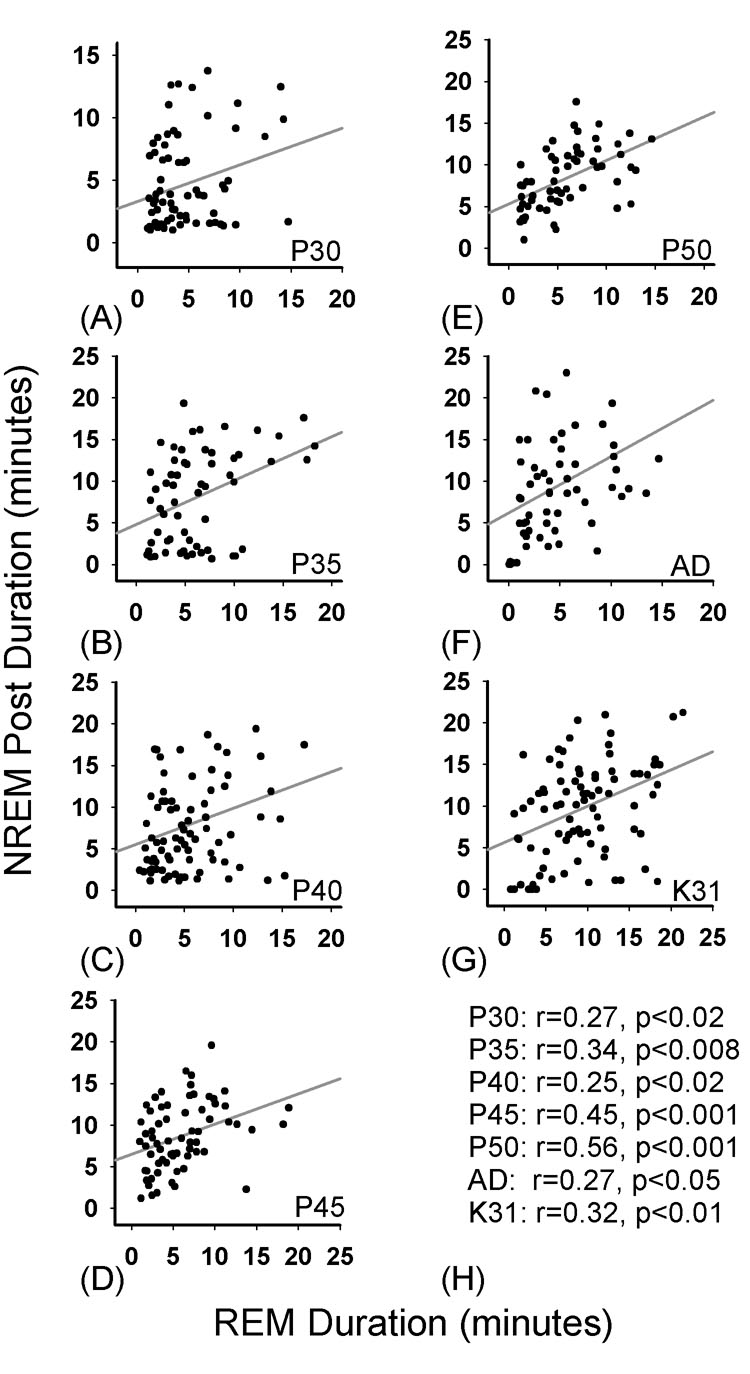
The relatively stable cycle-lengths suggested that short-term ultradian regulation of NREM and REM sleep develops relatively early in the ferret. This was confirmed when we examined short-term homeostatic interactions between REM sleep and subsequent NREM sleep durations. As shown in Figure 9, the duration of each REM sleep episode was positively correlated with the duration of subsequent NREM sleep episodes, as has been reported in adult animals [2,5,34,55,56,58]. Significant Spearman correlations were detected as early as P30 (Figure 9A) and were comparable in P30–32 neonatal cats (Figure 9G).
Figure 9. Spearman Rank Order correlations between REM sleep duration and NREM sleep duration across development.
Data represent linear regressions and corresponding Spearman r values between REM sleep duration and subsequent NREM sleep duration (in minutes) from P30–P50 in developing 33 kits, the adult ferret (AD) and P30–32 cats (K31). There were significant positive correlations at all ages in the ferret and in P30–32 cats (H). All other correlations between NREM sleep and REM sleep duration (or with wakefulness) were not significant.
4. Discussion
We characterized sleep ontogenesis in the ferret using polysomnographic techniques adapted for use in the developing animal. We find that clearly defined states of REM sleep and NREM sleep are detected near the time of eye-opening and the general pattern of sleep development reported in other altricial species is also present in the ferret. These include a lengthening of vigilance state episodes combined with a reduction in bout frequency, a loss of SOREMS and an increase in REM sleep latency. REM sleep amounts also declined (but see below) and NREM sleep amounts tended to rise; although on most measures, NREM sleep appeared to mature very rapidly. As previously reported in the neonatal rat, these changes in sleep architecture were accompanied by a progressive rise in the amplitude of EEG energies typical of adult REM and NREM sleep [18].
4.1 Sleep Ontogenesis in the Ferret: Comparison to Other Altricial Mammals
Ferrets are considered among the most altricial of placental mammals. In contrast to other carnivores, the ferret gestation period is relatively short (approximately 40 days, compared to 60–70 days for cats)[10] and ferrets exhibit fetal stages of development ex utero. For example, based on cortical cell birthdates, laminar development of the LGN, and formation of thalamocortical and intracortical circuitry, a P21 ferret is (approximately) equivalent to a fetal kitten (embryonic day 63) [25].
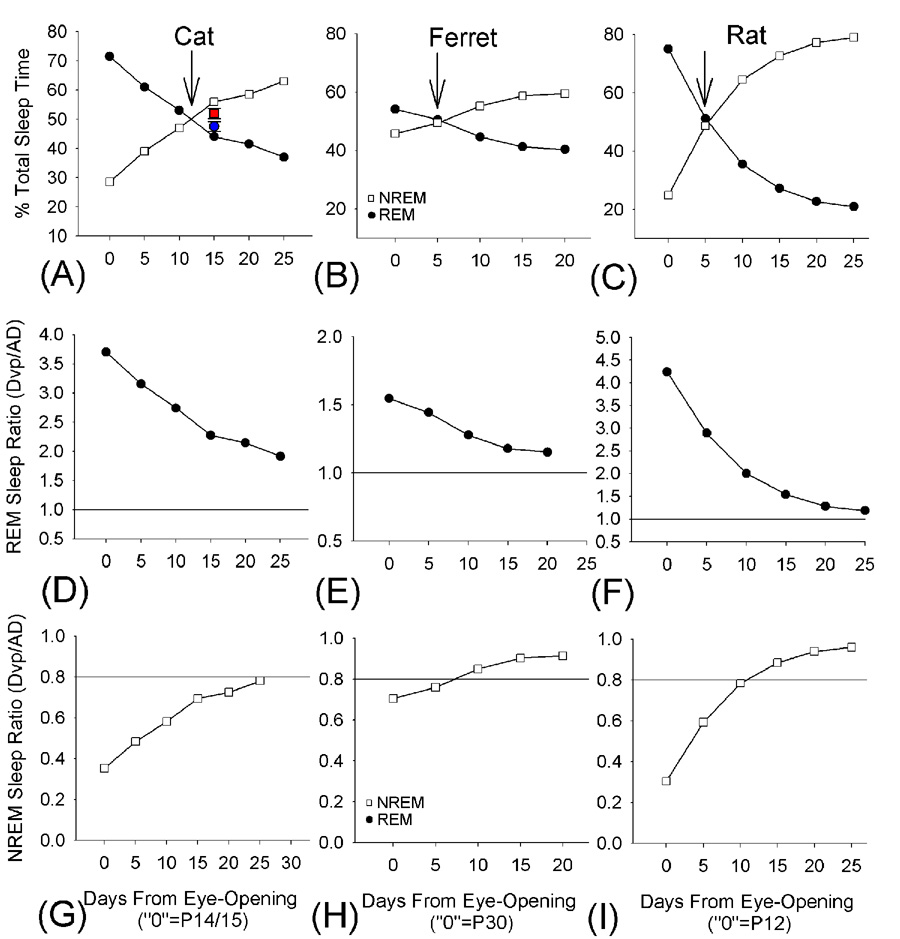
Considering that altriciality is linked with greater amounts of REM sleep in infancy, one might predict that REM sleep amounts in the neonatal ferret would exceed values previously reported in other altricial species. However, as shown in Figure 5–Figure 6, the amount of REM sleep in P30 ferrets is not significantly higher than in cats of similar age (P30–P32). In addition, when one compares sleep ontogenesis in the ferret, rat and cat using a common developmental landmark as a reference point (i.e. eye-opening)—the ferret appears slightly precocial relative to the cat and rat. For example, as shown in Figure 10, the amount of REM sleep at eye-opening in the cat and rat is approximately 75% TST, whereas in the ferret REM sleep is 55% TST. On other measures, the ferret appears to be intermediate between the cat and rat. This is apparent when one examines the age at which NREM sleep and REM sleep exchange positions in the sleep record in terms of % time. This ‘crossing’ point (see Figure 10) occurs 10 days after eye-opening in the cat, but within 5 days for the ferret and rat.
Figure 10. Cross-species comparisons of sleep ontogenesis: sleep time analyses.
Panels A–C show REM and NREM sleep amounts as a % total sleep time in the cat, ferret and rat vs. time in days from species-specific eye-opening. The age near eye-opening is set at “0”, and data extrapolated from previous studies in the cat [8,29,39,49] and rat [18] and ferret (present study) are shown in approximately 5 day intervals. The actual postnatal age at time “0” is shown in parentheses in the X axis for each species. The inset values in (A) are mean ± SEM data from P30–32 cats in the present study. The arrows indicate the ‘crossing’ point where NREM sleep begins to equal REM sleep in amounts. Panels D–F and G–H show REM sleep and NREM the ratio of postnatal sleep amounts to corresponding adult values (extrapolated from previous studies in the cat [35,54–56], ferret [26] and rat [3,4]. The reference line in D–F indicates 100% of adult values. The reference line in G–I indicates the time at which approximately 80% of the adult value is reached.
With respect to developmental changes in the EEG, two interesting observations were made. First, we found that the maturation of REM sleep EEGs appeared to lag behind the maturation of NREM EEGs. A similar phenomenon was previously reported in the neonatal rat [18]. However, it is not clear if the ‘lag’ in theta development in the ferret reflects purely ontogenetic processes. It may also reflect the fact REM sleep theta in cortical EEGs is detected via volume conductance. Thus direct hippocampal recordings might have revealed more rapid development in theta rhythms as has been reported in neonatal rats [30]. Secondly, we find that when compared to similarly aged cats, the amount of NREM delta power was significantly lower in neonatal ferrets. This suggests that in contrast to REM sleep mechanisms, the neural mechanisms underlying slow-wave activity are less developed in P30–P35 ferrets. This interpretation is consistent with the fact that thalamocortical and intracortical circuitry are more immature in ferrets relative to cats of the same postnatal age [25].
4.2 Short-term regulation of NREM-REM in neonatal mammals
A consistent finding in adult mammals is that REM sleep duration is positively correlated with the length of subsequent ‘non’ REM sleep intervals (NREM sleep or combined NREM & wake intervals) [2,3,5,34,55,56,58]. It has been suggested that this reflects a feed-forward regulatory mechanism that controls the timing of REM sleep. For example, it is possible that longer REM sleep episodes discharge more REM sleep propensity, thus allowing greater periods of time without REM sleep) [58]. Thus, according to this hypothesis, REM sleep propensity simply accumulates in the absence of REM sleep. An alternative view is that REM sleep in some way counterbalances neural changes triggered by prolonged NREM sleep; therefore longer REM sleep periods permit longer NREM sleep periods [5].
A striking observation is that this relationship appears to be relatively constant across mammalian species. For example correlations between REM sleep duration and subsequent (deep) slow-wave sleep duration in adult cats range from 0.25–0.49 [55,56]. In rats, these values range from 0.33–0.39 [58], and in rhesus monkeys and humans from 0.23–0.31 and 0.22–0.41, respectively [2,34]. This finding combined with the fact that REM sleep amounts (as a % of total sleep time) are also conserved across most placental mammals [60] suggests the presence of common cellular mechanisms governing the accumulation and discharge of REM propensity—and that these mechanisms operate within a narrow range.
Much less is known about the regulatory mechanisms governing sleep interactions in neonates. Sleep cycle lengths in developing humans and animals are generally shorter and more variable than those in adults [14,24]. This is also true in the ferret, as cycle lengths were significantly shorter at P30 than at P35. This suggests that the dynamics between the two sleep states may be quite different in neonates. A handful of studies have investigated correlational relationships between the amounts of different states in early development [15,53], however these measures may be insensitive to short-term interactions between REM and NREM sleep episode duration. More recently, little evidence was found for short-term interactions in sleep and wake episode durations in the developing rat, but REM and NREM sleep were not considered separately in this particular study [7].
We find that close inspection of REM and NREM sleep duration reveals that short-term regulation of NREM & REM is detectable by eye-opening in the neonatal ferret and by 30–32 days in neonatal cats. As shown in Figure 9, longer REM episodes are followed by longer NREM sleep episodes. This process was also detectable in adult ferrets. Thus it would appear that these mechanisms appear quite early ontogenetically and change very little with subsequent development. This is consistent with recent findings that brainstem and hypothalamic REM and NREM sleep mechanisms may be in place soon after parturition [31,33].
4.3 A Functional Role for Sleep in Early Brain Development?
The ferret provides a new animal model for studies of sleep function in early life. As first proposed by Roffwarg and colleagues [44], the large amounts of sleep during infancy may contribute to brain development. Evidence for this theory has accumulated over the years, particularly in studies of the developing visual system. For example, brainstem lesions that eliminate REM sleep pontine-geniculate-occipital (PGO) waves in the neonatal cat reduce the size (nucleus and soma) of the lateral geniculate nucleus (LGN), reduce LGN responsiveness to stimulation of the optic chiasm and increase the number of cells with “mixed” ON-OFF responses (as opposed to pure ‘ON’ or ‘OFF’ responses to an annulus of light centered in the receptive field) [12,13]. These morphological and functional changes in LGN cells are consistent with a delayed maturation of the LGN [12,13,59] and suggest that REM sleep neuronal activity may provide a source of endogenous neuronal activity necessary for normal LGN development. Sleep also plays an important role in later occurring, critical periods for visual development. Total sleep deprivation, or selective REM sleep deprivation is reported to augment the effects of monocular deprivation on LGN cell morphology [41,42]. Similar results are obtained following lesions that remove PGO waves [47]. A role for sleep has also been reported in a developmentally regulated form of in vitro long-term potentiation [32,48], and ocular dominance plasticity in vivo [20,27]. Because many of these developmental processes occur ex utero and/or at later postnatal dates in the ferret, this species is particularly amenable to future tests of the “ontogenetic hypothesis”[45] and similar theories relating sleep to brain maturation [16].
Supplementary Material
Data in box-whisker plots represent the entire range of (A) NREM sleep, (B) REM sleep or (C) wakefulness bout durations across development (minimum epoch length=4 seconds). The boundary of the box closest to zero indicates the 25th percentile, a line within the box marks the median, and the boundary of the box farthest from zero indicates the 75th percentile. Whiskers (error bars) above and below the box indicate the 90th and 10th percentiles and the filled circles represent the 5th and 95th percentiles, respectively.
Acknowledgements
This research was supported by departmental funds of the University of Pennsylvania and NIH R01 MH073357.
Footnotes
Publisher's Disclaimer: This is a PDF file of an unedited manuscript that has been accepted for publication. As a service to our customers we are providing this early version of the manuscript. The manuscript will undergo copyediting, typesetting, and review of the resulting proof before it is published in its final citable form. Please note that during the production process errors may be discovered which could affect the content, and all legal disclaimers that apply to the journal pertain.
References
- 1.Alfoldi P, Tobler I, Borbely AA. Sleep regulation in rats during early development. Am J Physiol. 1990;258:R634–644. doi: 10.1152/ajpregu.1990.258.3.R634. [DOI] [PubMed] [Google Scholar]
- 2.Barbato G, Wehr TA. Homeostatic regulation of REM sleep in humans during extended sleep. Sleep. 1998;21:267–276. doi: 10.1093/sleep/21.3.267. [DOI] [PubMed] [Google Scholar]
- 3.Benington J, Heller HC. REMS timing is controlled homeostatically by the accumulation of REMS propensity in non-REMS. American Journal of Physiology. 1994;266:r1992–r2000. doi: 10.1152/ajpregu.1994.266.6.R1992. [DOI] [PubMed] [Google Scholar]
- 4.Benington J, Kodali S, Heller HC. Scoring transitions to REM sleep in rats based on the EEG phenomena of pre-REM sleep: an improved analysis of sleep structure. Sleep. 1994;17:28–36. doi: 10.1093/sleep/17.1.28. [DOI] [PubMed] [Google Scholar]
- 5.Benington JH, Heller HC. Does the function of REM sleep concern non-REM sleep or waking? Prog Neurobiol. 1994;44:433–449. doi: 10.1016/0301-0082(94)90005-1. [DOI] [PubMed] [Google Scholar]
- 6.Bininda-Emonds OR, Gittleman JL, Purvis A. Building large trees by combining phylogenetic information: a complete phylogeny of the extant Carnivora (Mammalia) Biol Rev Camb Philos Soc. 1999;74:143–175. doi: 10.1017/s0006323199005307. [DOI] [PubMed] [Google Scholar]
- 7.Blumberg MS, Seelke AMH, Lowen SB, Karlsson KA. Dynamics of sleep-wake cyclicity in developing rats. PNAS. 2005;102:14860–14864. doi: 10.1073/pnas.0506340102. [DOI] [PMC free article] [PubMed] [Google Scholar]
- 8.Chase M, Sterman MB. Maturation of sleep and wakefulness in the kitten. Brain Res. 1967;5:319–329. doi: 10.1016/0006-8993(67)90040-6. [DOI] [PubMed] [Google Scholar]
- 9.Clancy B, Darlington RB, Finlay BL. Translating developmental time across mammalian species. Neuroscience. 2001;105:7–17. doi: 10.1016/s0306-4522(01)00171-3. [DOI] [PubMed] [Google Scholar]
- 10.Clancy B, Finlay BL, Darlington RB, Anand KJ. Extrapolating brain development from experimental species to humans. Neurotoxicology. 2007 doi: 10.1016/j.neuro.2007.01.014. In press. [DOI] [PMC free article] [PubMed] [Google Scholar]
- 11.Daniels MJ, Corbett L. Redefining introgressed protected mammals: when is a wild cat a wild cat and a dingo a wild dog? Wildlife Research. 2003;30:213–218. [Google Scholar]
- 12.Davenne D, Adrien J. Suppression of PGO waves in the kitten: anatomical effects on the lateral geniculate nucleus. Neuroscience Letters. 1984;45:33–38. doi: 10.1016/0304-3940(84)90325-2. [DOI] [PubMed] [Google Scholar]
- 13.Davenne D, Fregnac Y, Imbert M, Adrien J. Lesion of the PGO pathways in the kitten. II. Impairment of physiological and morphological maturation of the lateral geniculate nucleus. Brain Research. 1989;485:267–277. doi: 10.1016/0006-8993(89)90570-2. [DOI] [PubMed] [Google Scholar]
- 14.Davis FC, Frank MG, Heller HC. Ontogeny of sleep and circadian rhythms. In: Zee PC, Turek FW, editors. Regulation of Sleep and Circadian Rhythms. Vol. 133. New York: Marcel Dekker; 1999. pp. 19–80. [Google Scholar]
- 15.Denenberg VH, Thoman EB. Evidence for a functional role for active sleep in infancy. Sleep. 1980;4:185–191. [PubMed] [Google Scholar]
- 16.Frank MG. Sleep, synaptic plasticity and the developing brain. In: Luppi P-H, editor. Sleep. Circuits and Functions. Boca Raton: CRC Press; 2004. pp. 177–192. [Google Scholar]
- 17.Frank MG, Heller HC. Development of diurnal organization of EEG slow-wave activity and slow-wave sleep in the rat. Am. J. Physiol. 1997;273:R472–R478. doi: 10.1152/ajpregu.1997.273.2.R472. [DOI] [PubMed] [Google Scholar]
- 18.Frank MG, Heller HC. Development of REM and slow wave sleep in the rat. Am. J. Physiol. 1997;272:R1792–R1799. doi: 10.1152/ajpregu.1997.272.6.R1792. [DOI] [PubMed] [Google Scholar]
- 19.Frank MG, Heller HC. Neonatal treatments with the serotonin uptake inhibitors clomipramine and zimelidine, but not the noradrenaline uptake inhibitor desipramine, disrupt sleep patterns in adult rats. Brain Res. 1997;768:287–293. doi: 10.1016/s0006-8993(97)00657-4. [DOI] [PubMed] [Google Scholar]
- 20.Frank MG, Issa NP, Stryker MP. Sleep enhances plasticity in the developing visual cortex. Neuron. 2001;30:275–287. doi: 10.1016/s0896-6273(01)00279-3. [DOI] [PubMed] [Google Scholar]
- 21.Frank MG, Srere H, Ledezma C, O'Hara BF, Heller HC. Prenatal nicotine alters vigilance states and AchR gene expression in the rat: Implications for SIDS. Am J Physiol. 2001;280:R1134–R1140. doi: 10.1152/ajpregu.2001.280.4.R1134. [DOI] [PubMed] [Google Scholar]
- 22.Frank MG, Stryker MP, Tecott LH. Sleep and sleep homeostasis in mice lacking the 5-HT2c receptor. Neuropsychopharmacology. 2002;27:869–873. doi: 10.1016/S0893-133X(02)00353-6. [DOI] [PMC free article] [PubMed] [Google Scholar]
- 23.Furano AV, Usdin K. DNA "fossils" and phylogenetic analysis. Using L1 (LINE-1, long interspersed repeated) DNA to determine the evolutionary history of mammals. J Biol Chem. 1995;270:25301–25304. doi: 10.1074/jbc.270.43.25301. [DOI] [PubMed] [Google Scholar]
- 24.Hoppenbrouwers T, Sterman MB. Development of of sleep state patterns in the kitten. Experimental Neurology. 1975;49:822–838. doi: 10.1016/0014-4886(75)90062-x. [DOI] [PubMed] [Google Scholar]
- 25.Issa NP, Trachtenberg JT, Chapman B, Zahs KR, Stryker MP. The critical period for ocular dominance plasticity in the ferret's visual cortex. Journal of Neuroscience. 1999;19:6955–6978. doi: 10.1523/JNEUROSCI.19-16-06965.1999. [DOI] [PMC free article] [PubMed] [Google Scholar]
- 26.Jha SK, Coleman T, Frank MG. Sleep and sleep regulation in the ferret (Mustela Putorius Furo) Behav Brain Res. 2006;172:106–113. doi: 10.1016/j.bbr.2006.05.001. [DOI] [PubMed] [Google Scholar]
- 27.Jha SK, Jones BE, Coleman T, Steinmetz N, Law C, Griffin G, Hawk J, Frank MG. Sleep-dependent plasticity requires cortical activity. Journal of Neuroscience. 2005;25:9266–9274. doi: 10.1523/JNEUROSCI.2722-05.2005. [DOI] [PMC free article] [PubMed] [Google Scholar]
- 28.Johnson WE, O'Brien SJ. Phylogenetic reconstruction of the Felidae using 16S rRNA and NADH-5 mitochondrial genes. J Mol Evol. 1997;44 Suppl 1:S98–S116. doi: 10.1007/pl00000060. [DOI] [PubMed] [Google Scholar]
- 29.Jouvet-Mounier D, Astic L, Lacote D. Ontogenesis of the states of sleep in rat, cat and guinea pig during the first postnatal month. Developmental Psychobiology. 1970;2:216–239. doi: 10.1002/dev.420020407. [DOI] [PubMed] [Google Scholar]
- 30.Karlsson KA, Blumberg MS. Hippocampal theta in the newborn rat is revealed under conditions that promote REM sleep. J. Neurosci. 2003;23:1114–1118. doi: 10.1523/JNEUROSCI.23-04-01114.2003. [DOI] [PMC free article] [PubMed] [Google Scholar]
- 31.Karlsson KA, Kreider JC, Blumberg MS. Hypothalamic contribution to sleep-wake cycle development. Neuroscience. 2004;123:575–582. doi: 10.1016/j.neuroscience.2003.09.025. [DOI] [PubMed] [Google Scholar]
- 32.Kirkwood A, Lee HK, Bear MF. Co-regulation of long-term potentiation and experience-dependent synaptic plasticity in visual cortex. Nature. 1995;375:328–331. doi: 10.1038/375328a0. [DOI] [PubMed] [Google Scholar]
- 33.Kreider JC, Blumberg MS. Mesopontine contribution to the expression of active 'twitch' sleep in decerebrate week-old rats. Brain Research. 2000;872:149–159. doi: 10.1016/s0006-8993(00)02518-x. [DOI] [PubMed] [Google Scholar]
- 34.Kripke DF, Reite ML, Pegram GV, Stephens LM, Lewis OF. Nocturnal sleep in rhesus monkeys. Elec. Clin. Neurophysiol. 1968;24:582–586. doi: 10.1016/0013-4694(68)90047-3. [DOI] [PubMed] [Google Scholar]
- 35.Lancel M, van Riezen H, Glatt A. Effects of circadian phase and duration of sleep deprivation on sleep and EEG power spectra in the cat. Brain Research. 1991:206–214. doi: 10.1016/0006-8993(91)91123-i. [DOI] [PubMed] [Google Scholar]
- 36.Lucas EA. Effects of five to seven days of sleep deprivation produced by electrical stimulation of the midbrain reticular formation. Experimental Neurology. 1975:554–568. doi: 10.1016/0014-4886(75)90108-9. [DOI] [PubMed] [Google Scholar]
- 37.Maria Christensson JB, Martin Garwicz. Time course of cerebellar morphological development in postnatal ferrets: Ontogenetic and comparative perspectives. The Journal of Comparative Neurology. 2007;501:916–930. doi: 10.1002/cne.21291. [DOI] [PubMed] [Google Scholar]
- 38.Marks GA. A preliminary study of sleep in the ferret, Mustela putorius furo: a carnivore with an extremely high proportion of REM sleep. Sleep. 1996;19:83–93. doi: 10.1093/sleep/19.2.83. [DOI] [PubMed] [Google Scholar]
- 39.McGinty RJ, Stevenson M, Hoppenbrouwers T, Harper RM, Sterman MB, Hodgman J. Polygraphic studies of kitten development: sleep state patterns. Developmental Psychobiology. 1977;10:455–469. doi: 10.1002/dev.420100506. [DOI] [PubMed] [Google Scholar]
- 40.O'Brien SJ, Menotti-Raymond M, Murphy WJ, Yuhki N. The Feline Genome Project. Annu Rev Genet. 2002;36:657–686. doi: 10.1146/annurev.genet.36.060602.145553. [DOI] [PubMed] [Google Scholar]
- 41.Oksenberg A, Shaffery JP, Marks GA, Speciale SG, Mihailoff G, Roffwarg HP. Rapid eye movement sleep deprivation in kittens amplifies LGN cell-size disparity induced by monocular deprivation. Developmental Brain Research. 1996;97:51–61. doi: 10.1016/s0165-3806(96)00131-9. [DOI] [PubMed] [Google Scholar]
- 42.Pompeiano O, Pompeiano M, Corvaja N. Effects of sleep deprivation on the postnatal development of visual-deprived cells in the cat's lateral geniculate nucleus. Archives Italiennes de Biologie. 1995;134:121–140. [PubMed] [Google Scholar]
- 43.Randi E, Pierpaoli M, Beaumont M, Ragni B, Sforzi A. Genetic identification of wild and domestic cats (Felis silvestris) and their hybrids using Bayesian clustering methods. Mol Biol Evol. 2001;18:1679–1693. doi: 10.1093/oxfordjournals.molbev.a003956. [DOI] [PubMed] [Google Scholar]
- 44.Roffwarg HP, Muzio JN, Dement WC. Ontogenetic development of the human sleep-dream cycle. Science. 1966:604–619. doi: 10.1126/science.152.3722.604. [DOI] [PubMed] [Google Scholar]
- 45.Roffwarg HP, Shaffery JP. The ontogenetic hypothesis of REM sleep function: Its history, current status and prospects for confirmation. Sleep Research Online. 1999;2:714–715. [Google Scholar]
- 46.Ryan KD, Robinson SL. A study of spontaneous sexual maturation of the female ferret. Biol Reprod. 1987;36:333–339. doi: 10.1095/biolreprod36.2.333. [DOI] [PubMed] [Google Scholar]
- 47.Shaffery JP, Roffwarg HP, Speciale SG, Marks GA. Ponto-geniculo-occipital wave suppression amplifies lateral geniculate nuclues cell-size changes in monocularly deprived kittens. Developmental Brain Research. 1999;114:109–119. doi: 10.1016/s0165-3806(99)00027-9. [DOI] [PubMed] [Google Scholar]
- 48.Shaffery JP, Sinton CM, Bissette G, Roffwarg HP, Marks GA. Rapid eye movement sleep deprivation modifies expression of long-term potentiation in visual cortex of immature rats. Neuroscience. 2002;110:431–443. doi: 10.1016/s0306-4522(01)00589-9. [DOI] [PubMed] [Google Scholar]
- 49.Shimizu A, Himwich H. The ontogeny of sleep in kittens and young rabbits. Electroenceph Clin Neurophysiol. 1968;24:307–318. [PubMed] [Google Scholar]
- 50.Siegel JM. Sleep phylogeny: Clues to the evolution and function of sleep. In: Luppi PH, editor. Sleep. Circuits and Function. Boca Raton: CRC Press; 2005. pp. 163–176. [Google Scholar]
- 51.Siegel JM, Manger PR, Nienhuis R, Fahringer HM, Shalita T, Pettigrew JD. Sleep in the platypus. Neuroscience. 1999;91:391–400. doi: 10.1016/s0306-4522(98)00588-0. [DOI] [PMC free article] [PubMed] [Google Scholar]
- 52.Smith DG, McDonough J. Mitochondrial DNA variation in Chinese and Indian rhesus macaques (Macaca mulatta) Am J Primatol. 2005;65:1–25. doi: 10.1002/ajp.20094. [DOI] [PubMed] [Google Scholar]
- 53.Thoman EB. Sleeping and waking states in infants: A functional perspective. Neurosci Biobehav Rev. 1990;14:93–107. doi: 10.1016/s0149-7634(05)80165-4. [DOI] [PubMed] [Google Scholar]
- 54.Tobler I, Scherschlicht R. Sleep and EEG slow-wave activity in the domestic cat: effect of sleep deprivation. Behav Brain Res. 1990;37:109–118. doi: 10.1016/0166-4328(90)90086-t. [DOI] [PubMed] [Google Scholar]
- 55.Ursin R. The two stages of slow wave sleep in the cat and their relation to REM sleep. Brain Res. 1968;11:347–356. doi: 10.1016/0006-8993(68)90030-9. [DOI] [PubMed] [Google Scholar]
- 56.Ursin R. Sleep stage relations within the sleep cycles of the cat. Brain Res. 1970;20:91–97. doi: 10.1016/0006-8993(70)90157-5. [DOI] [PubMed] [Google Scholar]
- 57.Vila C, Maldonado JE, Wayne RK. Phylogenetic relationships, evolution, and genetic diversity of the domestic dog. J Hered. 1999;90:71–77. doi: 10.1093/jhered/90.1.71. [DOI] [PubMed] [Google Scholar]
- 58.Vivaldi EA, Ocampo A, Wyneken U, Roncagliolo M. Short-term homeostasis of active sleep and the architecture of sleep in the rat. Journal of Neurophysiology. 1994;72:1745–1755. doi: 10.1152/jn.1994.72.4.1745. [DOI] [PubMed] [Google Scholar]
- 59.Williams AL, Jeffery G. Growth dynamics of the developing lateral geniculate nucleus. Journal of Comparitive Neurology. 2001;430:332–342. [PubMed] [Google Scholar]
- 60.Zepelin H. Mammalian sleep. In: Kryger M, Roth T, Dement WC, editors. Principles and Practice of Sleep Medicine. Philadelphia: W. B. Saunders; 2005. pp. 91–100. [Google Scholar]
Associated Data
This section collects any data citations, data availability statements, or supplementary materials included in this article.
Supplementary Materials
Data in box-whisker plots represent the entire range of (A) NREM sleep, (B) REM sleep or (C) wakefulness bout durations across development (minimum epoch length=4 seconds). The boundary of the box closest to zero indicates the 25th percentile, a line within the box marks the median, and the boundary of the box farthest from zero indicates the 75th percentile. Whiskers (error bars) above and below the box indicate the 90th and 10th percentiles and the filled circles represent the 5th and 95th percentiles, respectively.


