Abstract
In order to elucidate enzyme catalysis through computer simulation, a prerequisite is to reliably compute free energy barriers for both enzyme and solution reactions. By employing on-the-fly Born-Oppenheimer molecular dynamics simulations with the ab initio QM/MM approach and the umbrella sampling method, we have determined free energy profiles for the methyl-transfer reaction catalyzed by the histone lysine methyl- transferase SET7/9 and its corresponding uncatalyzed reaction in aqueous solution, respectively. Our calculated activation free energy barrier for the enzyme catalyzed reaction is 22.5 kcal/mol, which agrees very well with the experimental value of 20.9 kcal/mol. The difference in potential of mean force between a corresponding pre-reaction state and the transition state for the solution reaction is computed to be 30.9 kcal/mol. Thus our simulations indicate that the enzyme SET7/9 plays an essential catalytic role in significantly lowering the barrier for the methyl-transfer reaction step. For the reaction in solution, it is found that the hydrogen bond network near the reac- tion center undergoes a significant change and there is a strong shift in electrostatic field from the pre-reaction state to the transition state. While for the enzyme reaction, such an effect is much smaller and the enzyme SET7/9 is found to provide a pre-organized electrostatic environment to facilitate the methyl-transfer reaction. Meanwhile, we find that the transition state in the enzyme reaction is a little more dissociative than that in solution.
1 Introduction
Methylation of lysine residues of histones is emerging as an essential mechanism in regulating chromatin structure, X-chromosome inactivation and gene expression [1-4]. The enzymes responsible for this important biological process are histone lysine methyltransferases (HKMTs), which catalyze the transfer of methyl group(s) from the cofactor S-adenosyl-methionine (AdoMet) to some specific lysine residues in the N-terminal histone tails [5,6]. Several lines of evidences have suggested a connection between cancer and aberrant activity of HKMTs [7]. With one exception of Dot1 [8], all known HKMTs contain a novel structural fold - the SET domain [5,9] which shares no sequence or structural homology with other AdoMet-dependent methyltransferases. In view of the great impact of histone lysine methylation and the novelty of this enzyme sub-family, it is of fundamental importance to elucidate the origin of its catalytic power.
Among the SET-domain HKMTs [10-22], SET7/9 is one of the best characterized experimentally [10,14,15]. This is a mono-methyltransferase which not only catalyzes the transfer of one methyl group to the unmodified histone lysine residue H3-K4 [10,14], but also has been found to methylate the transcription factor p53 [23] and TAF10 [24]. Like all other SET-domain HKMTs, the cofactor AdoMet and the substrate peptide bind to opposite faces of the SET7/9 and are connected by a narrow channel which has a hydrophobic inner wall [14,15]. The target lysine residue is inserted into this narrow channel to access the methyl moiety of AdoMet. Recently, we have carried out multiple ab initio quantum mechanical/molecular mechanical free energy (QM/MM-FE) calculations to investigate the methylation of H3-K4 catalyzed by SET7/9 [25]. The calculations have determined its reaction mechanism: a typical in-line SN2 nucleophilic substitution reaction with a dissociative transition state [25]. However, mainly due to the employment of independent dynamics approximation in the ab initio QM/MM-FE approach [26,27], the method is in practice not applicable to the study of chemical reactions in condensed phase [28,29]. Meanwhile, although empirical valence bond (EVB) method [30–32] and semi-empirical QM/MM approaches [33–36] have been widely employed to simulate enzyme catalysis and provided much insights [31,32,36–40], the requirement to calibrate parameters for each specific reaction significantly limits their applicability and predictive power. In order to provide a deep understanding of the catalytic activity of SET7/9, both enzyme and solution reactions should be reliably simulated and compared on an equal footing. It is clear that more advanced and detailed theoretical investigations need to be carried out.
Here we have performed ab initio QM/MM molecular dynamics simulations [41–47] with the umbrella sampling method [48–50] to determine free energy profiles for histone lysine methylation catalyzed by SET7/9 and its corresponding uncatalyzed reaction in aqueous solution. At each time step, the forces on atoms in both QM and MM sub-systems as well as the total energy are calculated with a pseudobond ab initio QM/MM method on the fly, and Newton equations of motion are integrated. Our simulations have yielded activation free energy barriers consistent with experimental results, and provided detailed theoretical understanding of enzyme catalysis in histone lysine methylation.
2 Materials and Methods
The preparation of the enzyme-substrate complex was based on the crystal structure 1O9S [14] and has already been described in detail in our previous paper [25]. The enzyme-substrate complex system was solvated with a 23 Å solvent water sphere centered on the active site (the sulfur atom of AdoMet). The whole simulation system for enzyme reaction consists of SET7/9, the histone peptide, AdoMet and 995 water molecules, a total of 7017 atoms. To simulate the corresponding uncatalyzed reaction in aqueous solution, the initial structure of the histone peptide and AdoMet was same as that in the enzyme system. The reactant complex was also solvated with a 23 Å solvent water sphere centered on the sulfur atom of AdoMet, which leads to a solution system with 4988 atoms in total. Each prepared system was then equilibrated with minimizations and molecular dynamics simulations.
QM/MM potential energy surface
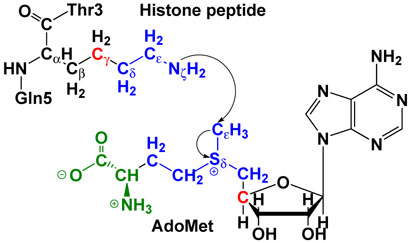
In QM/MM calculations, the partition of the reactant complex is illustrated in Figure 1 and the QM/MM interface has been described by a pseudobond approach [51,52]. The pseudobond ab initio QM/MM method has been successful applied to study several enzyme systems [25,53–57], and some of the theoretical predictions [53,[55] were subsequently confirmed by experimental studies [58–60]. HF(6-31G*) method, which has been well known to describe such methyl-transfer reactions very well with a reasonable computational cost [61–66], was employed to model the reaction center (colored in blue as shown in Figure 1). In order to minimize the computational cost, 3-21G* basis set was used for atoms colored in green, which do not directly participate in the methyl-transfer reaction. Two boundary carbon atoms (colored in red) were treated with improved pseudobond parameters [52]. There are 34 atoms in the quantum subsystem with 207 basis functions (411 primitive Gaussian functions). All other atoms in AdoMet, histone peptide and enzyme SET7/9 were described with the Amber molecular mechanical force field [67,68], and the TIP3P model [69] has been employed for water molecules.
Figure 1.
Illustration of the division of the QM/MM system for simulating the methyl-transfer from AdoMet to histone lysine residue H3-K4. HF(6-31G*) method was employed to model the reaction center (colored in blue), 3-21G* basis set was used for atoms colored in green. Two boundary carbon atoms (colored in red) were treated with improved pseudobond parameters [52]. All other atoms belong to the MM sub-system.
In order to test the accuracy of this small QM/MM partition and the employment of the Hartree-Fock method with the mixed 6-31G*/3-21G basis set, we have performed single point calculations to obtain the potential energy barrier for 11 determined reaction paths in our previous work [25], as shown in Table 1). Comparing with 6-31G* basis set for all QM atoms, the error introduced by using this 6-31G*/3-21G* mixed basis set is very small, only about 0.3 kcal/mol. The results in Table 1 also indicate that our current treatment can describe this methyl-transfer reaction quite well and it overestimates the reaction barrier about 3 kcal/mol in comparison with MP2(6-31+G*) QM/MM calculations with a large QM subsystem (66 atoms) [25].
Table 1.
Potential energy barriers for the methyl-transfer reaction with different methods, basis sets and QM subsystem size. The same reactant and transition state geometries determined in our previous work [25] are used for calculations. The MP2(6−31+G*) QM/MM results with the large QM subsystem (66 atoms) are al taken from Ref. [25].
| QM subsystem snapshots |
34 atoms HF(6-31G*/3-21G) |
34 atoms HF(6-31G*) |
66 atoms MP2(6-31+G*) |
|---|---|---|---|
| 300 | 28.4 | 28.1 | 26.0 |
| 400 | 24.0 | 23.8 | 19.7 |
| 500 | 24.6 | 24.2 | 21.7 |
| 600 | 27.6 | 27.2 | 24.3 |
| 700 | 25.0 | 24.5 | 21.2 |
| 800 | 24.8 | 24.6 | 21.1 |
| 900 | 22.6 | 22.4 | 19.4 |
| 1000 | 24.0 | 23.6 | 20.8 |
| 1500 | 23.2 | 22.7 | 19.3 |
| 2000 | 22.4 | 22.5 | 21.4 |
| 2500 | 25.1 | 24.9 | 22.0 |
| average | 24.7±1.8 | 24.4±1.7 | 21.5±1.9 |
Umbrella sampling
Since the methyl transfer reaction involves the breaking of Sδ – Cε bond and formation of Cε – Nζ bond as show in Figure 1, we have chosen the bond length difference between Sδ – Cε and Cε – Nζ, Rc = rSδ–Cε,– rCε–Nζ, as the reaction coordinate. In molecular dynamics simulations with the umbrella sampling method [48–50], the ab initio QM/MM potential energy of the system was biased with a harmonic potential, centered on successive values of the reaction coordinate. The forces on atoms in both QM and MM sub-systems as well as the total energy are calculated on the fly with the QM/MM method at each time step (1 fs), and Newton equations of motion are integrated with Beeman's algorithm [70]. We have employed 42 umbrella windows with harmonic potential force constants 40 - 60 kcal·mol−1 · Å −2 to simulate the enzyme reaction, and 39 umbrella windows for the reaction in solution. For each MD simulation, the configurations were recorded every 10 steps (10 fs) and were collected for 20 ps for the data analysis after an equilibration period of 10 ps. The total ab initio QM/MM MD simulation time lengths are 1.26 ns and 1.17 ns for the enzyme reaction and the solution reaction, respectively. The probability distributions (e.g. histograms) along the reaction coordinate were determined for each window and pieced together with the weighted histogram analysis method (WHAM) [71–73] to calculate the potential of mean force. The starting structure for each umbrella window was first obtained by an iterative restrained optimization procedure [26] with ab initio QM/MM calculations, and then the MM subsystem was equilibrated by carrying out 500 ps MD simulations with the MM force field. The resulted snapshot was then used as the starting structure for ab initio QM/MM MD simulations.
Other Computational Details
In all our calculations, we have employed modified versions of the Gaussian03 [74] and TINKER [75] programs. The spherical boundary condition has been applied so that atoms outside of 20 Å of the sulfur atom of the AdoMet are fixed. A cut-off of 12 Å was used for van der Waals interaction, and a cut-off of 18 Å was employed for electrostatic interactions among MM atoms. There is no cut-off for electrostatic interactions between QM and MM atoms. Berendsen thermostat method [76] has been used to control the system temperature at 300 K with a coupling time of 0.01 ps.
Results and Discussions
Free energy reaction barriers
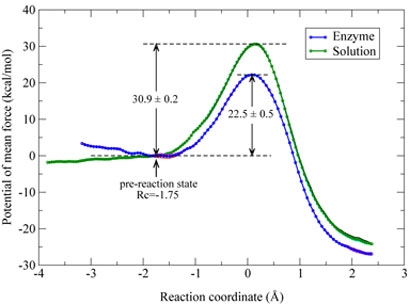
By employing on-the-fly Born-Oppenheimer molecular dynamics simulations with the ab initio QM/MM approach and the umbrella sampling method, we have determined potentials of mean force (PMF) for the histone lysine methylation reaction catalyzed by the enzyme SET7/9 and its corresponding uncatalyzed reaction in aqueous solution, which are presented in Figure 2. We can see that both free energy profiles converge well and the difference between PMF curves obtained from different time periods (10 - 20 ps versus 20 - 30 ps) is quite small. The PMF curve of the enzyme reaction clearly has a minimum, which is a flat well with the reaction coordinate from −1.5 to −1.9 Å. While for the solution reaction, there is no minimum even that the reaction coordinate has been extended to −3.8 Å. In order to directly compare the enzyme reaction with its corresponding uncatalyzed reaction, we have chosen the reaction coordinate of −1.75 Å as a pre-reaction state. It can be seen that the PMF curve for the solution reaction from −1.75 Å to −3.8 Å is relatively flat, with a difference of −1.5 kcal/mol. For the enzyme reaction, the calculated activation free energy barrier is 22.5 kcal/mol with a statistical error of 0.5 kcal/mol, which is in excellent agreement with the activation barrier of 20.9 kcal mol−1 estimated from the experimental value of kcat [11] by the simple transition state theory . Correspondingly, the difference in potential of mean force between the pre-reaction state (Rc = –1.75 Å) and the transition state for the solution reaction is computed to be 30.9 kcal/mol with a statistical error of 0.2 kcal/mol. Thus, our simulations confirm that the enzyme SET7/9 is a very powerful catalyst, which can reduce the barrier by 8.4 kcal/mol for the methyl-transfer reaction step. This corresponds to a reaction rate enhancement of about one million times. It should be noted that the value of 8.4 kcal/mol here does not represent the full catalytic power of the enzyme since the free energy cost for the formation of the pre-reaction state has not been taken into account.
Figure 2.
Potentials of mean force (PMF) for the methyl-transfer reaction catalyzed by SET7/9 and the corresponding uncatalyzed reaction in aqueous solution. The left side corresponds to the reactant and the right side is for the product. For each reaction, three PMF curves from different simulation time intervals have been plotted, which are from 10 ps to 20 ps, 20 to 30 ps, and 10 to 30 ps, respectively.
Geometries of reactants and transition states
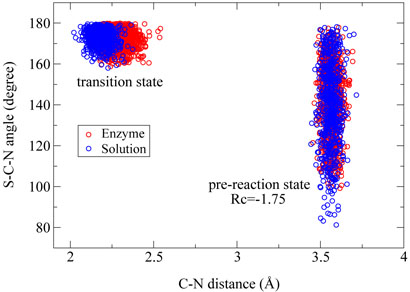
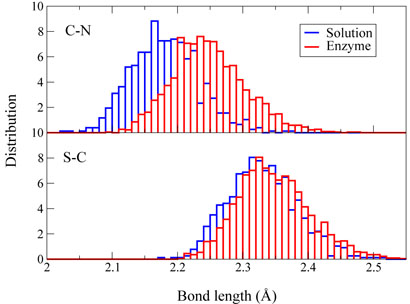
In order to understand how the enzyme facilitates the methyl-transfer reaction, we have analyzed several key geometry elements of the pre-reaction states (RC =∓1.75 Å and the transition states for both enzyme and solution reactions from ab initio QM/MM MD trajectories. For this methyl-transfer reaction, the Cε – Nζ distance and the Sδ – Cε – Nζ angle correspond respectively to the nucleophilic attack distance and angle. From Figure 3, we can see that the distribution of the Cε–Nζ distance and the Sδ–Cε–Nζ angle are very similar between the enzyme reaction and the solution reaction. From the pre-reaction state to the transition state, the Sδ – Cε – Nζ angle becomes much more linear for both reactions, which is consistent with the in-line SN2 nucleophilic substitution mechanism [25]. At transition states, Figure(3) and (4) indicate that although distributions of the Sδ – Cε – Nζ angle and the Sδ – CÅ distance are very similar between two reactions, the Cε – Nζ bond distance is a little longer in the enzyme than in the solution. Thus the transition state for this SET7/9 catalyzed methyl-transfer reaction is even a little more dissociative than that in the corresponding reaction in solution. In previous studies of catalytic strategy of catechol O-methyltransferase, one popular hypothesis is that the enzymatic transition state for the methyl-transfer event is compressed compared to the transition state of the uncatalyzed reaction in solution [77], but a recent theoretical study indicated that it is not the case [78]. Here our theoretical results do not support this transition state compression hypothesis in histone lysine methylation either. Overall, we can see that the mechanism difference between the enzyme reaction and solution reaction is very small and is not likely to be a key source of enzyme catalytic power.
Figure 3.
The Cϵ – Nζ distance in Å and the Sδ – Cϵ – Nζ angle in degree corresponding to reactants and transition states of methyl transfer reactions in SET7/9 and in aqueous solution, respectively.
Figure 4.
Normalized distributions of Cϵ – Nζ and Sδ – Cϵ bond distances corresponding to transition states of methyl transfer reactions in enzyme SET7/9 and in aqueous solution, respectively.
Electrostatic field and hydrogen bond network in the reaction center
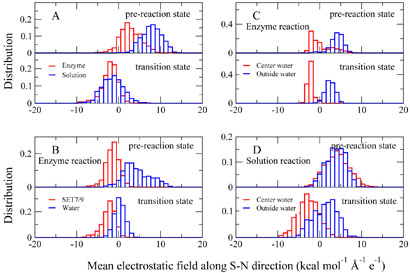
For this histone lysine methylation reaction in which the methyl group is transferred from the Sδ atom of AdoMet to the Nζ atom of the lysine residue, a positive charge also migrates from the Sδ atom to the Nζ atom. Thus a positive electrostatic field along the Sδ – Nζ direction would deter the methyl transfer, while a negative one would facilitate the reaction. In order to examine how the environment affects this methyl-transfer reaction, we have calculated the contribution of enzyme and solution environment to the mean electrostatic field along the Sδ – Nζ direction (MEF-SN) in the pre-reaction state (Rc= –1.75 Å) and the transition state, respectively. The MEF-SN is taken as the electrostatic potential difference between Nζ and Sδ divided by the distance between the two atoms, (øN – øS)/rNS. The results are presented in Figure 5. It should be noted that the MEF-SN calculated here is used as an empirical indicator for the environmental electrostatic effect on the reaction active site rather than as an approximation of the electrostatic field along the Sδ – Nζ direction on the transferring carbon atom. The latter can be directly calculated without using this finite difference approximation.
Figure 5.
The normalized distribution of the calculated mean electrostatic field along the Sδ – Nζ direction in the pre-reaction states (Rc = −1:75Å) and transition states. (A): The total contribution of the enzyme environment (including SET7/9 and all water molecules in the enzyme simulation system, colored in red) and the solvent environment (including all water molecules in the aqueous solution simulation system, colored in blue) to the MEF-SN in reactants and transition states. (B): For the enzyme reaction, the specific contribution of the SET7/9 (colored in red) and water molecules (colored in blue) to the MEF-SN in the reactant and in the transition state. (C): For the enzyme reaction, the specific contribution of water molecules near the active site (less than 4 Å away from either of the Sδ, Cϵ and Nζ atoms, colored in red) and the rest outside water molecules (colored in blue) to MEF-SN in the reactant and in the transition state. (D): For the aqueous solution reaction, similar to (C), the specific contribution of water molecules near the active site (less than 4 Å away from either of the Sδ, Cϵ and Nζ atoms, colored in red) and the rest outside water molecules (colored in blue) to MEF-SN in the reactant and in the transition state.
From (Figure 5A), we can see that in the pre-reaction state, the contribution of the aqueous environment to the MEF-SN is significantly more positive than that of the enzyme environment, while there is almost no difference at the transition state. From the reactant to the transition state, the MEF-SN for the solution reaction has a much larger shift than that in the enzyme system. These results indicate that in comparison with the enzyme reaction, the aqueous solution environment is much more unfavorable for the methyl-transfer reaction in the reactant and it requires a much stronger reorganization of the electrostatic environment during the reaction.
For the enzyme reaction, in order to elucidate the catalytic role of the SET7/9 in histone lysine methylation, the total effect of the enzyme environment has been divided into specific contribution of the SET7/9 and water molecules to the MEF-SN, as shown in Figure 5B. It is clear that the contribution of the SET7/9 to the MEF-SN in the reactant is very similar to that at the transition state and is favorable for the methyl transfer from AdoMet to lysine. This indicates that the structure of SET7/9 provides a pre-organized electrostatic environment [30–32] which is complementary to the transition state. This result is very similar to the previous theoretical finding for the catechol O-methyltransferase [79,80]. Meanwhile, for the histone methylation reaction catalyzed by SET7/9, the specific contribution of water molecules near the active site (less than 4 Å away from either of the Sδ, Cε and Nζ atoms, colored in red) and the rest outside water molecules (colored in blue) to MEF-SN in the reactant and in the transition state have also been computed, as shown in Figure 5C. We can see that the contribution of the water molecules near the active site to the MEF-SN is negative, which indicates that it favors the methyl-transfer reaction. Actually, in most snapshots, only one water molecules near the active site has been observed. It is the active site water observed in the crystal structure [14] and forms three hydrogen bonds with the hydroxyl group of Tyr305 and carbonyl oxygens of Gly292 and Ala295. Thus our results in Figure 5C here further confirm the catalytic role of this crystal water [14, 25].
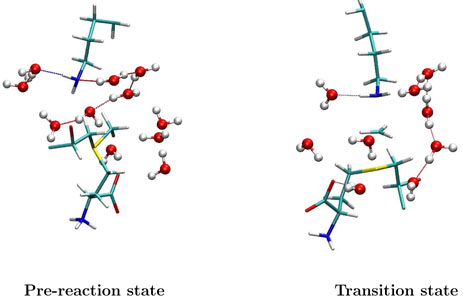
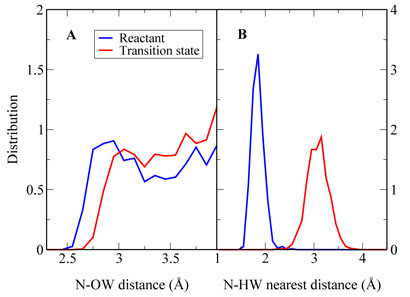
For the solution reaction, the similar analysis has also been performed as shown in Figure 5D. We can see that from the pre-reaction state to the transition state, the contribution of the active site water molecules to the MEF-SN has a much larger shift than that from outside water molecules. This indicates that the reorganization of the electrostatic environment in the solution reaction is mainly due to the water molecules near the reaction center. Indeed, from Figure 6 and 7, we can see that the hydrogen bond network near the active site in the reactant is very different from that in the transition state, and one key difference is the solvation near the Nζ atom of the histone lysine residue. A water molecule always forms a N…H – O hydrogen bond with the lone pair of nitrogen in the pre-reaction state, which is very unfavorable for the methyl-transfer reaction since the lone pair of Nζ is required to nucleophilic attack the methyl group during the reaction. Such a hydrogen bond does not exist at the transition state, indicating that extra energy has been paid to break this hydrogen bond during the solution reaction comparing to the reaction catalyzed by SET7/9, in which there is no hydrogen bond formed with the Nζ lone pair in the reactant.
Figure 6.
Illustration of the active site structures for the pre-reaction state (Rc = −1:75Å) and transition state of the methyl-transfer reaction in aqueous solution, respectively. These structures are random snapshots during the ab initio QM/MM MD simulations. The N ···H – O hydrogen bond between a water molecule and the lone electron pair of Nζ is always formed at the reactant, while it does not exist at the transition state.
Figure 7.
Illustration of the solvation environment difierence between the pre-reaction state (Rc = −1:75Å) and the transition state for the uncatalyzed reaction in aqueous solution. (A) Normalized distribution of water molecules (oxygen atom) near the Nζ atom of the histone lysine residue. (B) Normalized distribution of the closest hydrogen atom of water molecules near the Nζ atom of the histone lysine residue.
Comparing to the previous study [25]
using the ab initio QM/MM-FE approach on the very same enzyme system, the present on-the-fly ab initio QM/MM MD simulations yield very similar results regarding the enzyme reaction mechanism and the free energy reaction barrier for the methyl-transfer reaction catalyzed by SET7/9. This further confirms that ab initio QM/MM-FE approach [26] is a powerful approach to characterize enzyme reaction mechanisms [25, 53, 55, 59, 81–83]. However, the applicability of the ab initio QM/MM-FE approach is dependent on the validity of its major assumption that the dynamics of the QM subsystem and MM subsystem is independent of each other. This independent dynamics assumption is not appropriate for the chemical reactions in solution, or for reactions that the coupling of the dynamics between the reaction center and the environment is strong. It has been found that the study of the corresponding uncatalyzed chemical reactions in aqueous solution with the ab initio QM/MM-FE approach can yield erroneous results that the calculated free energy barrier can be even lower than that of the corresponding enzyme reaction [29]. Thus it is not applicable to elucidate enzyme catalysis which requires both enzyme and solution reactions to be reliably simulated and compared on an equal footing. For the on-the-fly ab initio QM/MM MD simulation, our results here indicate that it does not have such limitations and it can provide detailed insights into enzyme catalysis by directly comparing the enzyme reaction with the corresponding uncatalyzed reaction. With the further advance of computer technology and computational methods, the on-the-fly ab initio QM/MM MD simulation can be expected to be more affordable, and will become increasingly powerful to probe enzyme catalysis as well as to benchmark other approximate methods [26, 28, 84–90] for calculating free energy reaction barriers with ab initio QM/MM potential energy surfaces. Meanwhile, in comparison with the on-the-fly ab initio QM/MM MD method, the ab initio QM/MM-FE approach is more applicable to characterize enzyme reaction mechanisms since its computational cost is much less and it can afford to employ a larger QM subsystem and a higher level of QM method.
4 Conclusions
In order to elucidate enzyme catalysis through computer simulation, a prerequisite is to reliably compute free energy barriers for both enzyme and solution reactions. Here we have employed the umbrella sampling method to calculate potentials of mean force (PMF) for chemical reactions by directly performing molecular dynamics simulation with a pseudobond ab initio QM/MM method. Our calculated activation free energy barrier for the methyl transfer reaction catalyzed by SET7/9 is 22.5 kcal/mol, which agrees with the experimental value of 20.9 kcal/mol very well. The difference in potential of mean force between a corresponding pre-reaction state and the transition state for the solution reaction is computed to be 30.9 kcal/mol. Thus the enzyme SET7/9 lowers the barrier for the methyl-transfer reaction step by 8.4 kcal/mol compared with the uncatalyzed reaction, which corresponds to a rate enhancement of about one million fold.
By analyzing geometries of pre-reaction states and transition states, we found that the mechanism difference between the enzyme reaction and the solution reaction is very small and is not likely to be a key source of enzyme catalysis. On the other hand, our computed electrostatic field indicates that the enzyme SET7/9 provides a pre-organized electrostatic environment to facilitate the methyl-transfer reaction, while for the reaction in solution, the hydrogen-bond network near the reaction center undergoes a a significant change and there is a strong shift in electrostatic field from the pre-reaction state to the transition state. Thus our results indicate that a combination of the electrostatic pre-organization in enzyme and the hydrogen bond network reorganization in solution is an essential contributor to the enormous catalytic power of the histone lysine methyltransferase SET7/9.
5 Acknowledgments
Y.Z. acknowledges support from National Science Foundation (CHE-CAREER-0448156, CHE-MRI-0420870), National Institute of Health (GM079223), NYSTAR (James D. Watson Young Investigator Award) and NYU (Whitehead Fellowship for Junior Faculty in Biomedical and Biological Sciences). The authors are grateful for the computational resources provided by NYU-ITS and helpful comments of two referees.
References
- 1.Martin C, Zhang Y. Nat. Rev. Mol. Cell Biol. 2005;6:838–849. doi: 10.1038/nrm1761. [DOI] [PubMed] [Google Scholar]
- 2.Biel M, Wascholowski V, Giannis A. Angew. Chem.-Int. Edit. 2005;44:3186–3216. doi: 10.1002/anie.200461346. [DOI] [PubMed] [Google Scholar]
- 3.Sims RJ, Nishioka K, Reinberg D. Trends Genet. 2003;19:629–639. doi: 10.1016/j.tig.2003.09.007. [DOI] [PubMed] [Google Scholar]
- 4.Strahl BD, Allis CD. Nature. 2000;403:41–45. doi: 10.1038/47412. [DOI] [PubMed] [Google Scholar]
- 5.Xiao B, Wilson JR, Gamblin SJ. Curr. Opin. Struct. Biol. 2003;13:699–705. doi: 10.1016/j.sbi.2003.10.003. [DOI] [PubMed] [Google Scholar]
- 6.Cheng X, Collins RE, Zhang X. Annu. Rev. Biophys. Biomolec. Struct. 2005;34:267–294. doi: 10.1146/annurev.biophys.34.040204.144452. [DOI] [PMC free article] [PubMed] [Google Scholar]
- 7.Schneider R, Bannister AJ, Kouzarides T. Trends Biochem.Sci. 2002;27:396–402. doi: 10.1016/s0968-0004(02)02141-2. [DOI] [PubMed] [Google Scholar]
- 8.Min J, Feng Q, Li Z, Zhang Y, Xu R. Cell. 2003;112:711–723. doi: 10.1016/s0092-8674(03)00114-4. [DOI] [PubMed] [Google Scholar]
- 9.Dillon SC, Zhang X, Trievel RC, Cheng XD. Genome Biol. 2005;6:227. doi: 10.1186/gb-2005-6-8-227. [DOI] [PMC free article] [PubMed] [Google Scholar]
- 10.Wilson JR, Jing C, Walker PA, Martin SR, Howell SA, Blackburn GM, Gamblin SJ, Xiao B. Cell. 2002;111:105–115. doi: 10.1016/s0092-8674(02)00964-9. [DOI] [PubMed] [Google Scholar]
- 11.Trievel RC, Beach BM, Dirk LMA, Houtz RL, Hurley JH. Cell. 2002;111:91–103. doi: 10.1016/s0092-8674(02)01000-0. [DOI] [PubMed] [Google Scholar]
- 12.Min J, Zhang X, Cheng X, Grewal SI, Xu R. Nat. Struct. Biol. 2002;9:828–832. doi: 10.1038/nsb860. [DOI] [PubMed] [Google Scholar]
- 13.Zhang X, Tamaru H, Khan SI, Horton JR, Keefe LJ, Selker EU, Cheng X. Cell. 2002;111:117–127. doi: 10.1016/s0092-8674(02)00999-6. [DOI] [PMC free article] [PubMed] [Google Scholar]
- 14.Xiao B, Jing C, Wilson JR, Walker PA, Vasisht N, Kelly G, Howell S, Taylor IA, Blackburn GM, Gamblin SJ. Nature. 2003;421:652–656. doi: 10.1038/nature01378. [DOI] [PubMed] [Google Scholar]
- 15.Kwon T, Chang JH, Kwak E, Lee CW, Joachimiak A, Kim YC, Lee JW, Cho Y. EMBO J. 2003;22:292–303. doi: 10.1093/emboj/cdg025. [DOI] [PMC free article] [PubMed] [Google Scholar]
- 16.Trievel RC, Flynn EM, Houtz RL, Hurley JH. Nat. Struct. Biol. 2003;10:545–552. doi: 10.1038/nsb946. [DOI] [PubMed] [Google Scholar]
- 17.Zhang X, Yang Z, Khan SI, Horton JR, Tamaru H, Selker EU, Cheng X. Mol. Cell. 2003;12:177–185. doi: 10.1016/s1097-2765(03)00224-7. [DOI] [PMC free article] [PubMed] [Google Scholar]
- 18.Xiao B, Jing C, Kelly G, Walker PA, Muskett FW, Frenkiel TA, Martin SR, Sarma K, Reinberg D, Gamblin SJ, Wilson JR. Genes Dev. 2005;19:1444–1454. doi: 10.1101/gad.1315905. [DOI] [PMC free article] [PubMed] [Google Scholar]
- 19.Couture JF, Collazo E, Brunzelle JS, Trievel RC. Genes Dev. 2005;19:1455–1465. doi: 10.1101/gad.1318405. [DOI] [PMC free article] [PubMed] [Google Scholar]
- 20.Yin Y, Liu C, Tsai SN, Zhou B, Ngai SM, Zhu G. J. Biol. Chem. 2005;280:30025–30031. doi: 10.1074/jbc.M501691200. [DOI] [PubMed] [Google Scholar]
- 21.Qian CM, Wang XQ, Manzur K, Farooq A, Zeng L, Wang R, Zhou MM. J. Mol. Biol. 2006;359:86–96. doi: 10.1016/j.jmb.2006.03.006. [DOI] [PubMed] [Google Scholar]
- 22.Couture JF, Hauk G, Thompson MJ, Blackburn GM, Trievel RC. J. Biol. Chem. 2006;281:19280–19287. doi: 10.1074/jbc.M602257200. [DOI] [PubMed] [Google Scholar]
- 23.Chuikov S, Kurash JK, Wilson JR, Xiao B, Justin N, Ivanov GS, McKinney K, Tempst P, Prives C, Gamblin SJ, Barlev NA, Reinberg D. Nature. 2004;432:353–360. doi: 10.1038/nature03117. [DOI] [PubMed] [Google Scholar]
- 24.Kouskouti A, Scheer E, Staub A, Tora L, Talianidis I. Mol. Cell. 2004;14:175–182. doi: 10.1016/s1097-2765(04)00182-0. [DOI] [PubMed] [Google Scholar]
- 25.Hu P, Zhang Y. J. Am. Chem. Soc. 2006;128:1272–1278. doi: 10.1021/ja056153+. [DOI] [PubMed] [Google Scholar]
- 26.Zhang Y, Liu H, Yang W. J. Chem. Phys. 2000;112:3483–3492. [Google Scholar]
- 27.Zhang Y, Liu H, Yang W. In: Methods for Macromolecular Modeling. Schlick T, Gan HH, editors. Springer-Verlag: 2002. pp. 332–354. [Google Scholar]
- 28.Rosta E, Klahn M, Warshel A. J. Phys. Chem. B. 2006;110:2934–2941. doi: 10.1021/jp057109j. [DOI] [PubMed] [Google Scholar]
- 29.Rod TH, Rydberg P, Ryde U. J. Chem. Phys. 2006;124:174503. doi: 10.1063/1.2186635. [DOI] [PubMed] [Google Scholar]
- 30.Warshel A. Computer Modeling of Chemical Reactions in Enzymes. John Wiley & Sons, Inc.; New York: 1991. [Google Scholar]
- 31.Warshel A. Annu. Rev. Biophys. Biomolec. Struct. 2003;32:425–443. doi: 10.1146/annurev.biophys.32.110601.141807. [DOI] [PubMed] [Google Scholar]
- 32.Warshel A, Sharma PK, Kato M, Xiang Y, Liu HB, Olsson MHM. Chem. Rev. 2006;106:3210–3235. doi: 10.1021/cr0503106. [DOI] [PubMed] [Google Scholar]
- 33.Field MJ, Bash PA, Karplus M. J. Comp. Chem. 1990;11:700–733. [Google Scholar]
- 34.Gao J, Xia X. Science. 1992;258:631–635. doi: 10.1126/science.1411573. [DOI] [PubMed] [Google Scholar]
- 35.Bakowies D, Thiel W. J. Phys. Chem. 1996;100:10580–10594. [Google Scholar]
- 36.Riccardi D, Schaefer P, Yang Y, Yu HB, Ghosh N, Prat-resina X, Konig P, Li GH, Xu DG, Guo H, Elstner M, Cui Q. J. Phys. Chem. B. 2006;110:6458–6469. doi: 10.1021/jp056361o. [DOI] [PubMed] [Google Scholar]
- 37.Hammes-schiffer S. Curr. Opin. Struct. Biol. 2004;14:192–201. doi: 10.1016/j.sbi.2004.03.008. [DOI] [PubMed] [Google Scholar]
- 38.Garcia-viloca M, Gao J, Karplus M, Truhlar DG. Science. 2004;303:186–195. doi: 10.1126/science.1088172. [DOI] [PubMed] [Google Scholar]
- 39.Gao JL, Ma SH, Major DT, Nam K, Pu JZ, Truhlar DG. Chem. Rev. 2006;106:3188–3209. doi: 10.1021/cr050293k. [DOI] [PMC free article] [PubMed] [Google Scholar]
- 40.Bruice TC. Chem. Rev. 2006;106:3119–3139. doi: 10.1021/cr050283j. [DOI] [PubMed] [Google Scholar]
- 41.Singh UC, Kollman PA. J. Comput. Chem. 1986;7:718–730. [Google Scholar]
- 42.Stanton RV, Hartsough DS, Merz KM., Jr. J. Phys. Chem. 1993;97:11868. [Google Scholar]
- 43.Yarne DA, Tuckerman ME, Martyna GJ. J. Chem. Phys. 2001;115:3531–3539. [Google Scholar]
- 44.Carloni P, Rothlisberger U, Parrinello M. Accounts Chem. Res. 2002;35:455–464. doi: 10.1021/ar010018u. [DOI] [PubMed] [Google Scholar]
- 45.Colombo MC, Guidoni L, Laio A, Magistrato A, Maurer P, Piana S, Rohrig U, Spiegel K, Sulpizi M, Vandevondele J, Zumstein M, Rothlisberger U. Chimia. 2002;56:13–19. [Google Scholar]
- 46.Rega N, Iyengar SS, Voth GA, Schlegel HB, Vreven T, Frisch MJ. J. Phys. Chem. B. 2004;108:4210–4220. [Google Scholar]
- 47.Crespo A, Marti MA, Estrin DA, Roitberg AE. J. Am. Chem. Soc. 2005;127:6940–6941. doi: 10.1021/ja0452830. [DOI] [PubMed] [Google Scholar]
- 48.Patey GN, Valleau JP. J. Chem. Phys. 1975;63:2334–2339. [Google Scholar]
- 49.Boczko EM, Brooks CL. J. Phys. Chem. 1993;97:4509–4513. [Google Scholar]
- 50.Roux B. Comput. Phys. Commun. 1995;91:275–282. [Google Scholar]
- 51.Zhang Y, Lee TS, Yang W. J. Chem. Phys. 1999;110:46–54. [Google Scholar]
- 52.Zhang Y. J. Chem. Phys. 2005;122:024114. doi: 10.1063/1.1834899. [DOI] [PubMed] [Google Scholar]
- 53.Liu H, Zhang Y, Yang W. J. Am. Chem. Soc. 2000;122:6560–6570. [Google Scholar]
- 54.Zhang Y, Kua J, McCammon JA. J. Am. Chem. Soc. 2002;124:10572–10577. doi: 10.1021/ja020243m. [DOI] [PubMed] [Google Scholar]
- 55.Cisneros GA, Liu H, Zhang Y, Yang W. J. Am. Chem. Soc. 2003;125:10384–10393. doi: 10.1021/ja029672a. [DOI] [PubMed] [Google Scholar]
- 56.Cheng Y, Zhang Y, McCammon JA. J. Am. Chem. Soc. 2005;127:1553–1562. doi: 10.1021/ja0464084. [DOI] [PubMed] [Google Scholar]
- 57.Corminboeuf C, Hu P, Tuckerman ME, Zhang Y. J. Am. Chem. Soc. 2006;128:4530–4531. doi: 10.1021/ja0600882. [DOI] [PubMed] [Google Scholar]
- 58.Poyner RR, Larsen TM, Wong SW, Reed GH. Arch. Biochem. Biophys. 2002;401:155–163. doi: 10.1016/S0003-9861(02)00024-3. [DOI] [PubMed] [Google Scholar]
- 59.Cisneros GA, Wang M, Silinski P, Fitzgerald MC, Yang W. Biochemistry. 2004;43:6885–6892. doi: 10.1021/bi049943p. [DOI] [PubMed] [Google Scholar]
- 60.Metanis N, Brik A, Dawson PE, Keinan E. J. Am. Chem. Soc. 2004;126:12726–12727. doi: 10.1021/ja0463841. [DOI] [PubMed] [Google Scholar]
- 61.Bento AP, Sola M, Bickelhaupt FM. J. Comput. Chem. 2005;26:1497–1504. doi: 10.1002/jcc.20261. [DOI] [PubMed] [Google Scholar]
- 62.Chandrasekhar J, Smith SF, Jorgensen WL. J. Am. Chem. Soc. 1984;106:3049–3050. [Google Scholar]
- 63.Morokuma K. J. Am. Chem. Soc. 1982;104:3732–3733. [Google Scholar]
- 64.Truong TN, Stefanovich EV. J. Phys. Chem. 1995;99:14700–14706. [Google Scholar]
- 65.Hase WL. Science. 1994;266:998–1002. doi: 10.1126/science.266.5187.998. [DOI] [PubMed] [Google Scholar]
- 66.Mohamed AA, Jensen F. J. Phys. Chem. A. 2001;105:3259–3268. [Google Scholar]
- 67.Cornell WD, Cieplak P, Bayly CI, Gould IR, Merz KM, Ferguson DM, Spellmeyer DC, Fox T, Caldwell JW, Kollman PA. J. Am. Chem. Soc. 1995;117:5179–5197. [Google Scholar]
- 68.Markham GD, Norrby PO, Bock CW. Biochemistry. 2002;41:7636–7646. doi: 10.1021/bi025682c. [DOI] [PubMed] [Google Scholar]
- 69.Jorgensen WL, Chandrasekhar J, Madura JD, Impey RW, Klein ML. J. Chem. Phys. 1983;79:926–935. [Google Scholar]
- 70.Beeman D. J. Comput. Phys. 1976;20:130–139. [Google Scholar]
- 71.Ferrenberg AM, Swendsen RH. Phys. Rev. Lett. 1988;61:2635–2638. doi: 10.1103/PhysRevLett.61.2635. [DOI] [PubMed] [Google Scholar]
- 72.Kumar S, Bouzida D, Swendsen RH, Kollman PA, Rosenberg JM. J. Comput. Chem. 1992;13:1011–1021. [Google Scholar]
- 73.Souaille M, Roux B. Comput. Phys. Commun. 2001;135:40–57. [Google Scholar]
- 74.Frisch MJ, Trucks GW, Schlegel HB, Scuseria GE, Robb MA, Cheeseman JR, Montgomery JA, Jr., Vreven T, Kudin KN, Burant JC, Millam JM, Iyengar SS, Tomasi J, Barone V, Mennucci B, Cossi M, Scalmani G, Rega N, Petersson GA, Nakatsuji H, Hada M, Ehara M, Toyota K, Fukuda R, Hasegawa J, Ishida M, Nakajima T, Honda Y, Kitao O, Nakai H, Klene M, Li X, Knox JE, Hratchian HP, Cross JB, Bakken V, Adamo C, Jaramillo J, Gomperts R, Stratmann RE, Yazyev O, Austin AJ, Cammi R, Pomelli C, Ochterski JW, Ayala PY, Morokuma K, Voth GA, Salvador P, Dannenberg JJ, Zakrzewski VG, Dapprich S, Daniels AD, Strain MC, Farkas O, Malick DK, Rabuck AD, Raghavachari K, Foresman JB, Ortiz JV, Cui Q, Baboul AG, Clifford S, Cioslowski J, Stefanov BB, Liu G, Liashenko A, Piskorz P, Komaromi I, Martin RL, Fox DJ, Keith T, Al-Laham MA, Peng CY, Nanayakkara A, Challacombe M, Gill PMW, Johnson B, Chen W, Wong MW, Gonzalez C, Pople JA. Gaussian 03. Gaussian, Inc.; Wallingford, CT: 2004. Revision D.01. [Google Scholar]
- 75.Ponder JW. TINKER, Software Tools for Molecular Design, Version 4.2. 2004 doi: 10.1021/acs.jctc.8b00529. The most updated version for the TINKER program can be obtained from J. W. Ponder's World Wide Web site at http://dasher.wustl.edu/tinker., Jun. [DOI] [PMC free article] [PubMed]
- 76.Berendsen HJC, Postma JPM, Vangunsteren WF, Dinola A, Haak JR. J. Chem. Phys. 1984;81:3684–3690. [Google Scholar]
- 77.Takusagawa F, Fujioka M, Spies A, Schowen RL. In: Comprehensive Biological Catalysis: A Mechanistic Reference. Sinnott M, editor. Academic Press: 1998. pp. 1–30. [Google Scholar]
- 78.Ruggiero GD, Williams IH, Roca M, Moliner V, Tunon I. J. Am. Chem. Soc. 2004;126:8634–8635. doi: 10.1021/ja048055e. [DOI] [PubMed] [Google Scholar]
- 79.Roca M, Marti S, Andres J, Moliner V, Tunon M, Bertran J, Williams AH. J. Am. Chem. Soc. 2003;125:7726–7737. doi: 10.1021/ja0299497. [DOI] [PubMed] [Google Scholar]
- 80.Roca M, Andres J, Moliner V, Tunon I, Bertran J. J. Am. Chem. Soc. 2005;127:10648–10655. doi: 10.1021/ja051503d. [DOI] [PubMed] [Google Scholar]
- 81.Zhang Y. Theor. Chem. Acc. 2006;116:43–50. [Google Scholar]
- 82.Kastner J, Senn HM, Thiel S, Otte N, Thiel W. J. Chem. Theory Comput. 2006;2:452–461. doi: 10.1021/ct050252w. [DOI] [PubMed] [Google Scholar]
- 83.Cisneros GA, Wang M, Silinski P, Fitzgerald MC, Yang WT. J. Phys. Chem. A. 2006;110:700–708. doi: 10.1021/jp0543328. [DOI] [PubMed] [Google Scholar]
- 84.Bentzien J, Muller RP, Florian J, Warshel A. J. Phys. Chem. B. 1998;102:2293–2301. [Google Scholar]
- 85.Lu Z, Yang W. J. Chem. Phys. 2004;121:89–100. doi: 10.1063/1.1757436. [DOI] [PubMed] [Google Scholar]
- 86.Ishida T, Kato S. J. Am. Chem. Soc. 2003;125:12035–12048. doi: 10.1021/ja021369m. [DOI] [PubMed] [Google Scholar]
- 87.Ishida T. Biochemistry. 2006;45:5413–5420. doi: 10.1021/bi051515b. [DOI] [PubMed] [Google Scholar]
- 88.Rod TH, Ryde U. Phys. Rev. Lett. 2005;94:138302. doi: 10.1103/PhysRevLett.94.138302. [DOI] [PubMed] [Google Scholar]
- 89.Rod TH, Ryde U. J. Chem. Theory Comput. 2005;1:1240–1251. doi: 10.1021/ct0501102. [DOI] [PubMed] [Google Scholar]
- 90.Hu H, Lu Z, Yang W. J. Chem. Theory. Comput. 2007. asap. [DOI] [PubMed]


