

Abstract
Glucose is a central molecule in biology and chemistry, and the anomerization reaction has been studied for more than 150 years. Transition state structure is the last impediment to an in-depth understanding of its solution chemistry. We have measured kinetic isotope effects on the rate constants for approach of α-glucopyranose to its equilibrium with β-glucopyranose, and these were converted into unidirectional kinetic isotope effects using equilibrium isotope effects. Saturation transfer 13C-NMR spectroscopy has yielded the relative free energies of the transition states for the ring-opening and ring-closing reactions and both transition states contribute to the experimental kinetic isotope effects. Both transition states of the anomerization process have been modeled with high-level computational theory with constraints from the primary, secondary and solvent kinetic isotope effects. We have found the transition states for anomerization and we have also concluded that it is forbidden for the water molecule to form a hydrogen bond bridge to both OH1 and O5 of glucose simultaneously in either transition state.
Introduction
Glucose has been an important focus of research for more than 150 years, starting with Dubrunfaut1 and Pasteur2 in the 1840’s. At the turn of the last century Brönsted3 and Lowry4,5 worked to define the action of acids and bases on the solution chemistry of glucose. Also around the same time, the pioneering studies on glucose production from cane sugar were performed by Arrhenius using acid6 and by Michaelis and Menten using the enzyme invertase7. Glucose sits at the end of photosynthetic energy capture by plants and at the head of glycolytic energy utilization by the other organisms. It is oxidized and decarboxylated to form ribose for RNA and further reduced to deoxyribose for DNA, and its metabolites are used by a host of organisms to form the amino acids. Glucose combines a balance of chemical stability and chemical reactivity for metabolism and synthesis. Much of its versatility results from the anomeric hemiacetal functionality.
The two major forms of glucose in aqueous solution are the anomeric pyranoses8. Furanose forms also exist, but in minor quantity. The most rare stable structure is the open-form aldehyde, the essential intermediate for all ring-closing reactions (Figure 1).
Figure 1.

Conversion between the most abundant forms of glucose requires ring opening to the acyclic aldehyde intermediate.
The principal features of ring-opening are: deprotonation of OH1, protonation of O5 to form the 5-hydroxyl, and bond breaking between O5 and the anomeric C1 stereogenic center. The simplest mechanisms occur with zero, one (Figure 2), or two water molecules assisting. In dry benzene, anomeric interconversion is virtually nonexistent. Swain showed that adding phenol and pyridine results in third order kinetics9, but 2-hydroxypyridine alone reduces kinetics to second order10. The number of water molecules responsible for catalysis, the number of protons transferred at once, and also the extent of coupling between proton transfer and bond breaking between O5 and C1 have been subjects of considerable debate11-14.
Figure 2.
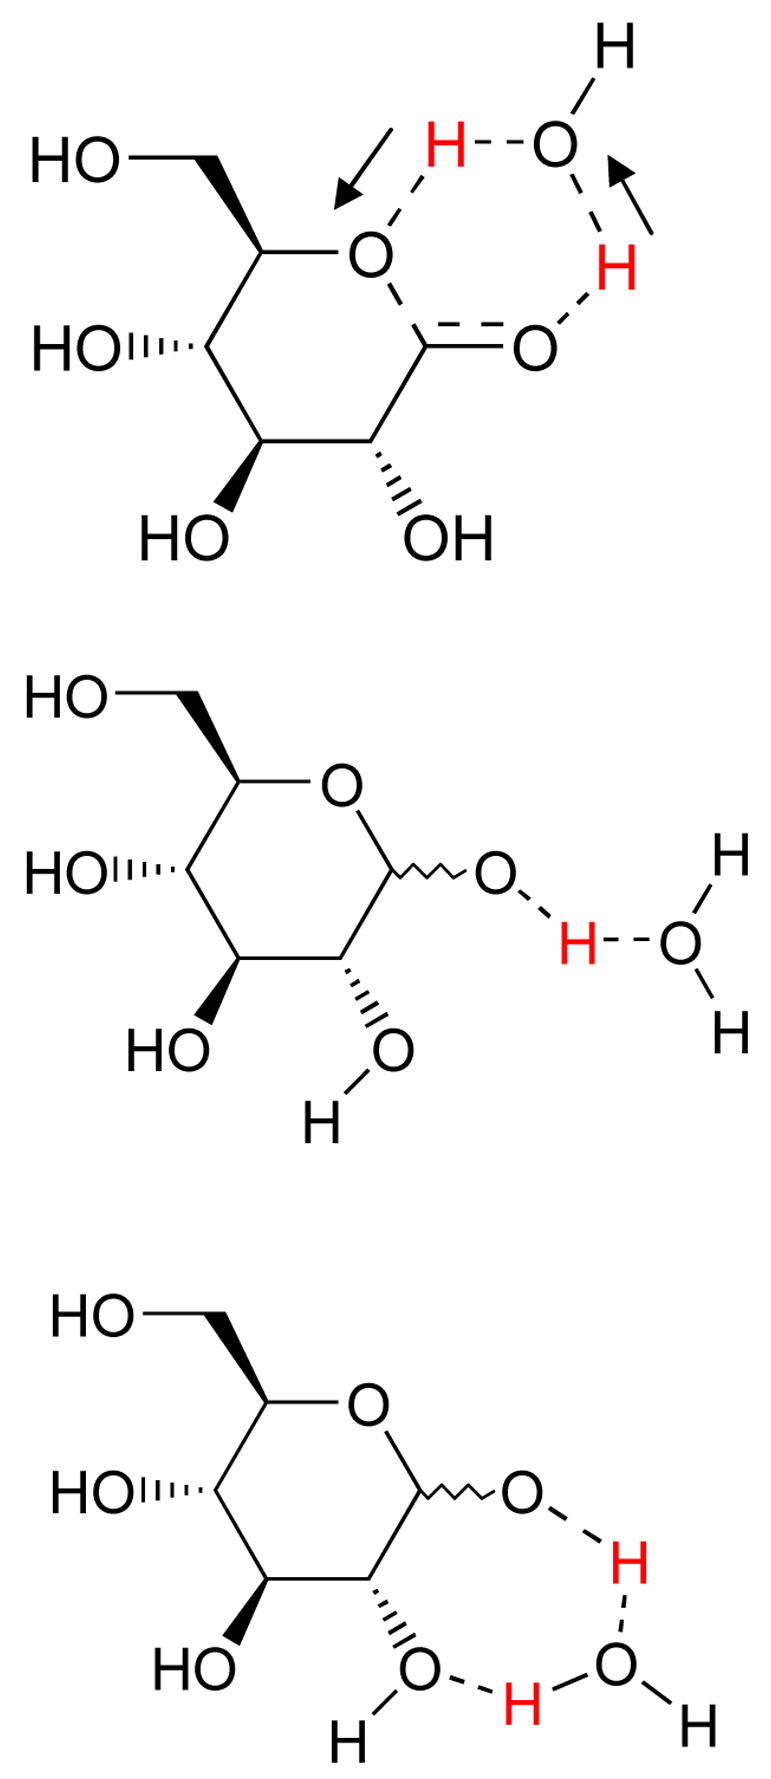
Different ways for a single water to participate in transition state formation.
Solving this problem requires: a) determining the free energy profile, b) observing the transition states experimentally through kinetic isotope effects, and c) finding transition state models that match the experimental kinetic isotope effects.
We have measured the isotope effects and the reaction free-energy profile in the two-step interconversion of the most abundant isomers of glucose, α- and β-pyranose. Through computational chemistry, we have modeled transition states for each anomer with one participating water molecule in several different positions. Based on kinetic isotope effect data, we have identified the most likely transition state structures in this reaction, we have narrowed the mechanism to that of general base catalysis by water, and we have found a forbidden location for the catalytic water molecule at the transition state.
Materials and methods
Deuterated sugars were obtained commercially from either Sigma (St. Louis, MO) or Omicron Biochemicals (South Bend, IN). Synthesis of D-[5-18O]glucopyranose is described below. All labeled and unlabeled α-glucopyranoses were recrystallized from AcOH:H2O (80:20 v/v). After removal of the supernatant the crystals were washed with cold 80% acetic acid (0 °C), cold absolute ethanol (< −20 °C) and dried overnight under vacuum (0.1 mmHg). The anomeric composition of the crystals was > 95% α-anomer as determined by 1H-NMR spectroscopy in d6-DMSO.
Synthesis of α-D-[5-18O]glucopyranose
Acid-catalyzed exchange of the carbonyl oxygen atom of 3-O-benzyl-1,2-O-isopropylidene-6-O-triphenylmethyl-α-D-xylo-hexofuranos-5-ulose with [18O]H2O (96.9 atom % 18O, Isotec Inc., a division of Sigma-Aldrich, Lot # RX1058) followed the procedure used by Bennet and Sinnott15 except that the silver oxide quench step was omitted. After three exchanges (each with approximately 1.5 equivalents of 18O-water), the labeled ketone was reduced with NaBH4 using the procedure of Hardick and Hutchinson16. After removal of the trityl, benzyl and isopropylidene protecting groups15, the resultant labeled glucose was further purified by transforming it into 1,2,3,4,6-penta-O-acetyl-α-D-[5-18O]glucopyranose using the method of Wolfrom and Thompson17 and recrystallizing this material from 95% EtOH. Zemplén deacetylation18 of the penta-O-acetyl-α-D-[5-18O]glucopyranose (mp 128–129 °C uncorrected: lit. 132 °C,17 gave labeled glucose that was recrystallized twice to give the desired α-D-[5-18O]glucopyranose as a colorless solid. The atom-percentage of 18O in α-D-[5-18O]glucopyranose (92%) was calculated by using the least squares method of Brauman19 on the isotopic peak distribution of the M–59 ion peak (loss of acetyl) measured in the CI mass spectrum for the labeled penta-O-acetyl-β-D-[5-18O]glucopyranose.
Equilibrium isotope effects
The [1-13C]glucose and [5-18O]glucose equilibrium isotope effects were determined by 13C-NMR as in Lewis and Schramm20. Magnetic lock was obtained by including deuterium oxide-filled coaxial insert with the cuvette and experimental solution. Solvent equilibrium isotope effects were obtained by measuring 13C-NMR for glucose in deuterium oxide and comparing with the equilibrium constant for glucose in water.
Quasi-racemate and solvent deuterium KIE studies
In order to ensure that the kinetics of glucose mutarotation were being monitored in the water-catalyzed pH regime (between 3 and 7) kinetic solutions contained 10 mM 2-(N-morpholino)ethanesulfonic acid (MES, Sigma) dissolved in Milli-Q (18.2 MΩ cm−1) water containing 10% v/v methanol. Control experiments showed that the rate of glucose mutarotation was invariant as a function of MES (5 – 50 mM) in both water and 10% (v/v) aqueous methanol. Also, the derived rate constant was identical to that extrapolated to zero buffer concentration for acetate (pH = 4.62) and phosphate (pH = 7.02) buffers.
Into a 2 mL volumetric flask were placed approximately 10.0 mg each of α-L-glucopyranose and a labeled α-D-glucopyranose. Following addition of a 10 mM MES solution (10% aqueous methanol), the solids were dissolved quickly by vigorous shaking. One mL of the solution was placed into a thermostat-fitted quartz polarimetry cell (path length 10 cm) and the change in optical rotation (α) of the solution was monitored at 253.6 nm using a Perkin-Elmer 341MC polarimeter and Lauda RM 6 water bath at 25.0 ± 0.2 °C.
Experimental rotation versus time data sets were fit with the following equation using nonlinear least squares (“enzfitter”, BioSoft, Ferguson MO): α=Ae−kt + Be−kt/C + α8 . The optical rotation change for the complete equilibration of the α-L-glucopyranose (A = αt=0 – α t=∞) was measured in a separate experiment. Optical rotation for the labeled α-D-glucopyranose (B), KIE on the approach to equilibrium (C), rate constant for the light isotopomer (k), and optical rotation at infinite time (α∞) were treated as variables in the non-linear fit. For each kinetic study, it was verified that B approximates –A and that k was identical (within experimental error) to the value obtained in a separate experiment. Under ideal circumstances the rotation shows an extremum against time (dα/dt = 0). For cases where this was not observed the quantity used of one pseudoenantiomer was increased. For some small KIE’s, k could not be treated as a non-restricted variable and in these cases the value of k was constrained to ± 10% of that measured in a separate experiment. The 5-18O kinetic isotope effect was corrected to account for incomplete labeling using the method of Bergson et al21.
These experiments yielded the isotope effect on approach to equilibrium, a process including β→α and α? β mass transfer, but were converted to the analytically useful unidirectional α? β mass transfer via kie = kieobsd×(Keq+CEIE)/(Keq+1). Keq was 1.61 and CEIE values were measured as above or taken from Lewis and Schramm20.
The solvent kinetic isotope effects were measured by mixing appropriate volumes of two MES solutions (10mM, 10% v/v MeOL in L2O, where L is fractional content of hydrogen or deuterium).
Saturation transfer
250 mg unlabelled glucose was dissolved in 600 μL H2O and 60 μL D2O (for lock purposes). At each temperature between 298 K and 349 K, T1 values for both anomeric 13C1 spins were measured using the t1ir pulse program on a Bruker DRX300 instrument. At 301 K and 349 K, T1 was 1.284 sec and 4.65 sec for the β-glucopyranose C1 spin, respectively. The aldehyde peak, while reported previously22, was located empirically by scanning for maximal effect on saturation transfer. The sugars were permitted to equilibrate in the machine at each temperature for 3/(k1+k−1) seconds, using the estimated overall forward and reverse rate constants for equilibration. Saturation transfer was then performed using the zgf2pr pulse program, saturating with a 24 dB pulse (3 ppm) either the aldehyde peak at 207 ppm or the control region at 300 ppm. The saturation interval (d1), during which the Waltz saturation protocol was applied, was always 30 sec, more than 6 times the longest T1 measured at any temperature. Four dummy scans and sixty-four fid’s were measured during each experiment. The experiment was performed at each temperature five or six times. Exchange rates were extracted as described in the text.
Computational modeling
Preliminary computational work found that transition states for deprotonation of OH1 containing the bridging water between OH1 and O5 reflect a significant degree of ring-opening, in contrast to those models containing water hydrogen-bonded to OH1 alone or bridging OH1 and OH2. For the OH1-O5 bridge, it was first necessary to find the model of closed ring with water (reactant) and aldehyde form with water (product). Each was constructed in Spartan (Wavefunction, Inc., Irvine, CA) and minimized with Gaussian9823 at density functional level of theory using the hybrid density functional and basis set B3PW91/6-31G**. The reactant was subjected to free minimization while product was minimized with the O5-C1 distance constrained to 3.5 Å. Using the QST2 and iop(2/15=3) keywords, i.e. without a transition state suggestion, Gaussian interpolated between the two structures and energetically maximized the result to a transition state on the potential energy surface. This was carried out separately for each anomeric opening reaction. For the OH1 bonded models and the OH1-OH2 bridging models, the QST3 keyword was used in conjunction with a transition state suggestion. This was necessary for the OH1-bonded models to permit constraints to be used for the transition state model. A Gaussian frequency calculation, containing the keyword iop(7/33=1), was performed at the same level of theory for the α-pyranose reactant and both transition-state structures. Force constants in the Gaussian log file were translated into isotope effects using IsoEff9824 and a scaling factor of 0.956125. For each water placement, one a-pyranose reactant and two transition states were found similarly, using hydrogen bonded water and glucose as the reactant and glucosate-hydronium as product. The progress of all calculations were monitored with the visualization program Molekel26.
Weighting α- and β-anomer transition state models
Where there are two transition states, the higher in free energy will contribute more to the observed effect. The weighting equation is borrowed from enzymatic transition-state analysis, corresponding similarly to the mixing of several transition states occurring on the enzyme surface. However, as a reacting pyranose doesn’t “know” whether its catalyst is an enzyme or a water pocket, the analysis is the same. In our case, the experimental isotope effects due to each transition state contribute according to the equation:
where KIEobserved, KIEα, and KIEβ are the experimental kinetic isotope effects, and the isotope effects due to only the α- or to only the β-side transition state, respectively. kout,α and kout, β are rate constants for ring-closure of aldehyde material to α-pyranose or β-pyranose, respectively. Based on saturation transfer data, the isotope effects derived from the α-transition state count 1.64 times as much as those from the β-transition state. The transition state models computed in this work were weighted similarly.
Stereoviews
Each model was oriented using Chem3D Pro (CambridgeSoft, Cambridge MA) to provide best illustration of the decomposition modes. The complementary structure for stereoview was created by performing a rotation of 5 degrees about the in-page north axis. Each structure was saved as a “.GJC” Gaussian input file. The routes were modified to read “#b3pw91/6-31g** freq(readfc) iop(2/15=3) iop(7/33=1) test”, and “%chk=filename” was also included. The resulting structures and decomposition modes were illustrated in Molekel.
Orbital diagram
Gaussian 98 was run with the route “#P b3pw91/6-31g** geom=checkpoint guess=read gfprint pop(full,nboread) test” and the input file included the final line “$NBO plot #END”. Molekel was used to view the Gaussian .log file, and the FILE.37 set of NBO coefficients were loaded before computing the orbital for viewing.
Results
Rate constants and the free energy profile
The saturation transfer technique in 13C-NMR spectroscopy was used to determine the microscopic rate constants for the interconversion. Reaction rate constants for interconversion of two species in equilibrium that possess distinct signals can be measured by saturating the spins of one and measuring a reduction in signal of the other, provided that magnetic relaxation is slow relative to reaction rates. The rate constants are solved by the formula Io/I = (1+kinT1), where T1 is the spin-lattice relaxation constant. Serianni27 was the first to apply saturation transfer NMR28,29 to carbohydrate anomerization, and Snyder30 later verified the consistency with 2D exchange spectroscopy and computer fitted time-lapse 13C-NMR for measurement of rate constants in carbohydrate anomerization.
After saturating the aldehyde C1 signal at 207 ppm, magnetized spins from each pyranose C1 signal exchange with nonobservable spins from the aldehyde form, thus reducing each pyranose signal (Figure 3). Spin-exchange rates versus temperature (Figure 4), are monotonic and convex to about 349 K with overlapping curves for each anomer. The standard enthalpy of activation, ΔHo‡, for opening of each anomeric pyranose is found from the replot shown in Figure 5 using the equation log(kobsd/T) = (−ΔHo‡/2.303R)(1/T) + C, where T represents temperature, and R the ideal gas constant.
Figure 3.

Saturation transfer to detect exchanging species. Saturation of a peak eliminates its signal from a 13C spectrum. The [1-13C] signal for each pyranose in equilibrium with a saturated aldehyde will decrease as its magnetized spins are transferred to the aldehyde but replenished only with [1-13C] saturated spins from the aldehyde.
Figure 4.

Saturation transfer from the acyclic aldehyde to each pyranose. Transfer is more effective at higher temperature due to the increased T1 of each species.
Figure 5.

Replotted results of saturation transfer experiments display constant slope over this temperature range. Enthalpy of activation for the ring-opening of each anomer as determined by the slope (−ΔH0‡/2.303T) is slightly greater for the β-pyranose (19.9 kcal/mol) than the α-pyranose (18.2 kcal/mol), but the Gibbs free energy of activation (ΔG‡) for each is the same within experimental error at each temperature.
The overall reaction coordinate diagram is shown in Figure 6. The standard enthalpy and entropy of activation, ΔHo‡ and ΔSo‡, are 18.2 kcal/mol and −23 cal/mol·K, respectively, for the α-anomer and 19.9 kcal/mol and −18 cal/mol·K, respectively, for the β-anomer. The standard Gibbs free energies of activation were found by extrapolation to 303 K, where high-quality equilibrium constants are available22. At 30 °C, the rate constants for ring closing toward α-pyranose and β-pyranose are 0.044 s−1 and 0.072 s−1, respectively.
Figure 6.

Standard Gibbs free energy versus reaction coordinate. The relative energy of the ground-state cyclic and acyclic molecules were generated from equilibrium data taken at 30 °C (22), and the transition state energies were extrapolated to 30 °C using the values of ΔH‡ and ΔS‡ determined from the present temperature study of saturation transfer (Figure 5).
Kinetic isotope effects from a multistep process depend upon each transition state encountered but tend to reflect the highest energy transition state. In glucose anomerization, the quantity expressing relative free energy of each transition state is the ratio (kout,β/kout,α), defined by the equilibrium reaction portrayed in Figure 6. It is easier for the aldehyde to form the β-rather than α-anomer, and calculated from the Gibbs standard free energies, the ratio at 303 K is 1.64. This number is close to unity, indicating that both transition states contribute to the observed kinetic isotope effects, and conversely, that the observed kinetic isotope effects represent both structures almost equally.
Kinetic isotope effects
Following the rotation of plane-polarized light has been used since the beginning of sugar chemistry. The “quasi-racemate” technique to measure kinetic isotope effects15 involves passing plane-polarized light through a single reaction chamber that contains two equilibration reactions with mirror image reactants: α-D-glucose and α-L-glucose (Figure 7). For matched samples, no net rotation of the plane-polarized light is observed, even as equilibration progresses in each reaction. Slight mismatch in concentration results in a single-exponential form. Isotope substitution in the D-isomeric solution may alter its rate of reaction, giving a characteristic double-exponential behavior (Figure 8). Solvent KIE are measured by following reaction rate with varying deuterium fraction in aqueous-10 % MeOH in separate experiments. Kinetic isotope effects for the anomerization of glucose, including solvent KIE, are listed in Table 1.
Figure 7.

Quasi-racemate method for determining kinetic isotope effects. The rotation of plane-polarized light by aqueous α-D-glucose at standard conditions will change from 112.2 deg to 52.7 deg as the anomeric equilibrium is reached. A matched solution of α-L-glucose behaves identically except for the direction of rotation of the polarized light. Concentration mismatch in a single cuvette produces exponential rotation of polarized light. Deuterium substitution into α-D-glucose usually slows its reaction (example of kinetic isotope effect), causing polarized light to rotate according to a double exponential.
Figure 8.
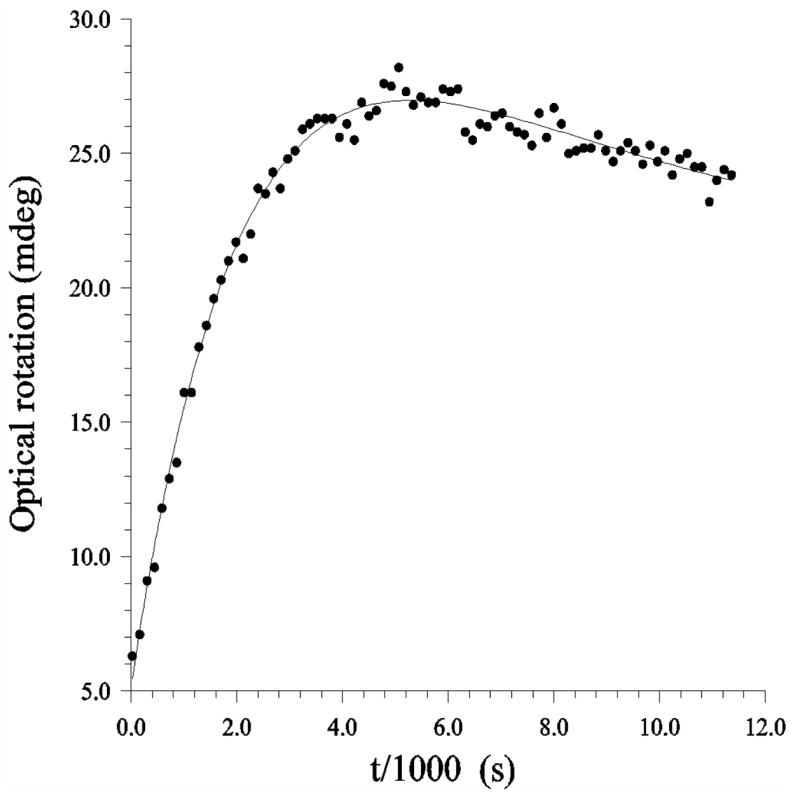
Approach to equilibrium of a solution containing about 10 mg of both α-L-glucose and α-D-[5-18O]glucose in water at 25 ºC. Shown are every eighth data point and the best nonlinear fit to the experimental equation.
Table 1.
Observed kinetic, equilibrium, and unidirectional kinetic IE.
| label | kieobsd | n | equilibrium ie | kie (α→β)b |
|---|---|---|---|---|
| 1-d | 1.101 ± 0.003 | 3 | 1.043 ± 0.004a | 1.119 ± 0.004 |
| 2-d | 1.007 ± 0.001 | 4 | 1.027 ± 0.005a | 1.017 ± 0.002 |
| 3-d | 0.998 ± 0.001 | 3 | 1.027 ± 0.004a | 1.009 ± 0.002 |
| 4-d | 0.995 ± 0.003 | 3 | 0.998 ± 0.003a | 0.994 ± 0.003 |
| 5-d | 0.992 ± 0.001 | 2 | 1.035 ± 0.004a | 1.004 ± 0.002 |
| 6-d,d | 1.004 ± 0.000 | 3 | 1.001 ± 0.004a | 1.004 ± 0.002 |
| 1-13C | 1.004 ± 0.001 | 4 | 1.007 ± 0.006 | 1.006 ± 0.003 |
| 5-18O | 1.015 ± 0.001 | 3 | 0.975 ± 0.008 | 1.005 ± 0.003 |
| D2O | 2.96 ± 0.09 | 1.010 ± 0.007c | 2.97 ± 0.09 |
Determined previously (20).
kie (α→β) = kieobsd*(K eq + equilibrium ie)/(K eq + 1), and K eq = 1.61.
Determined as in (20 ), but without coaxial insert.
Table 1 shows that α-[1-d]-D-glucose reacts more slowly than α-D-glucose under experimental conditions, with a rate-ratio or KIE of 1.119 ± 0.004, and the KIE for α-[2-d]-D-glucose, α-[3-d]-D-glucose, α-[4-d]-D-glucose, α-[5-d]-D-glucose, α-[6,6-d2]-D-glucose are 1.017 ± 0.002, 1.009 ± 0.002, 0.994 ± 0.003, 1.004 ± 0.002, and 1.004 ± 0.002, respectively. These effects are secondary KIE since none of the substituted atoms participates in bond breaking or formation. Li et al31 also measured deuterium kinetic isotope effects and solvent kinetic isotope effects on mutarotation, attributing most of the isotope effect from fully-deuterated glucose to the [1-d] position (1.12 ± 0.03 of 1.17 ± 0.04). The primary KIE for this reaction were measured using α-[1-13C]-glucose and α-[5-18O]-glucose: 1.006 ± 0.003 and 1.005 ± 0.003, respectively, while the solvent KIE is 2.97 ± 0.09, indicating that the reaction occurs threefold more slowly in deuterium oxide.
In modeling the transition states, a single reactant will be required for the vibrational starting point, but the observed KIE for approach to equilibrium contain KIE for the reaction of β-sugar as well as α-sugar. The equilibrium isotope effects, some measured in previous work20, were used to convert the observed KIE to those for the unidirectional reaction of the α-pyranose (Table 1).
Figure 9 illustrates the solvent KIE, a gradual change in reaction rate with solvent deuterium content. Measured reaction rates are shown by open circles, and each line indicates the expected behavior for one, two, three, or four exchangeable protons responsible for causing the KIE, respectively. As the largest difference is seen between the curves at deuterium fraction of 0.532,33, this point is used to estimate the number of protons affected in a transition state. From experiment, the reaction rate at deuterium fraction of 0.5 is 2.01 ± 0.02, essentially ruling out a one-proton model (midpoint KIE in that model would be 2.23 ± 0.04).
Figure 9.

Rate of glucose mutarotation depends on mole fraction of deuterium in solvent water. Experimental data is shown by open circles. The dashed linear diagonal is expected for one proton in motion at the transition state and the line becomes increasingly bowed for two, three, or four protons, respectively. It is clear that two or more protons are in flight at the transition state.
Transition-state structures
There are three main positions for a participating water molecule in the aqueous reaction: bridging O5 and OH1, hydrogen bonding only to OH1, and bridging OH1 and OH2 with hydrogen bonds (Fig. 2). Previous computational work has focused strictly on models bridging O5 and OH1. Presently, transition state models for the ring opening of each anomer were calculated with a single water molecule in one of the three positions, yielding six candidate transition state models, three of which are shown in Figure 10. The models were generated using Gaussian9823 under theory and basis set B3PW91/6-31G**. Job files, including the constraints used in the OH1-OH2 bridging models, are presented in Online Supplementary Material.
Figure 10.

Transition state models (stereoviews) for ring opening of glucose in water. (top row) Representative model for ring opening of α-glucose with water bridging OH1 and O5. (middle row) Ring opening of α-glucose occurs by deprotonation of OH1 by a water not bridging to OH2, while (bottom row) ring opening of β-glucose proceeds with a water molecule bridging OH1 and OH2. Carbon is colored green, oxygen red, and hydrogen white. Arrows indicate the direction of movement of each atom as part of the unstable reaction coordinate. The middle row represents a saddle point rather than a transition state structure, as another imaginary frequency exists with frequency −90 cm−1, representing the tendency of the whole hydronium molecule to translate to a slightly more authentic orientation.
The top row transition state in Figure 10 is the ring opening of α-glucose with a bridging water molecule between O5 and OH1. In the second row, the water molecule acts as a base catalyst, positioned to deprotonate OH1 of α-glucose without making other contacts with the sugar molecule. In the bottom row, the water molecule again acts as a base at OH1 of β-glucose but makes a second hydrogen-bond with OH2. Calculated isotope effects for each model (three α- and three β-transition states) are shown in Table 2 for comparison against experimental data.
Table 2.
Comparison of transition-state models with experiment.
| water bridging O5-O1
|
water bonding O1
|
water bridging O1-O2
|
weighted models
|
experiment | ||||
|---|---|---|---|---|---|---|---|---|
| label | α-TS | β-TSa | α-TS | β-TSa | α-TS | β-TSa | α:β::1.64:1b | kie (α→β)c |
| 1-d | 1.097 | 1.155 | 1.114 | 1.203 | 1.039 | 1.109 | 1.112 | 1.119 |
| 2-d | 1.003 | 1.055 | 1.022 | 1.045 | 0.987 | 1.022 | 1.022 | 1.017 |
| 3-d | 0.997 | 1.010 | 1.005 | 1.039 | 1.029 | 1.028 | 1.014 | 1.009 |
| 4-d | 0.997 | 0.987 | 1.010 | 1.007 | 1.002 | 1.004 | 1.008 | 0.994 |
| 5-d | 0.998 | 1.018 | 1.017 | 1.066 | 1.019 | 1.058 | 1.033 | 1.004 |
| 6-d,d | 0.995 | 0.995 | 1.022 | 1.021 | 1.010 | 1.001 | 1.014 | 1.004 |
| 1-13C | 1.013 | 1.014 | 1.007 | 1.009 | 1.008 | 1.007 | 1.007 | 1.006 |
| 5-18O | 1.011 | 1.010 | 1.006 | 1.007 | 1.007 | 1.007 | 1.006 | 1.005 |
| D2O | 7.112 | 7.390 | 3.555 | 3.242 | 3.765 | 4.167 | 3.786 | 2.97 |
This isotope effect reflects the vibrational difference between the ground state α-pyranose reactant (not β-pyranose) and the β-side transition-state.
The observed total unidirectional kinetic isotope effect is based on the difference between α-pyranose and α-TS and between α-pyranose and β-TS; it is a weighted average in favor of the transition state highest in free energy.
Experimental unidirectional kinetic isotope effect (from Table 1).
There is considerably more ring-opening character in the transition state for water bridging O5 and OH1 (top row, Figure 10). The protonation of O5 at the transition state causes a decrease in bond order between O5 and C1. This occurs with a lengthening of the bond between these two atoms. The mean C1-O5 distance in OH1 water-bonded models changes from 1.43 Å to 1.47 Å; in OH1-OH2 water-bridged models from 1.41 Å to 1.45 Å. These are contrasted against the OH1-O5 water-bridged models where C1-O5 increases from 1.43 Å to 1.70 Å.
Since this process is occurring at the transition state, it is reflected in the kinetic isotope effects listed in Table 2. The primary KIE for 1-13C in the first column of Table 2 is 1.013, compared with 1.007 for the corresponding primary KIE in the third column or 1.008 in the fifth column. The latter models possess less motion of C1 and O5 at their respective transition states.
The solvent KIE is much larger for the OH5-O1 models compared with the others, and the secondary deuterium KIE vary between models.
Discussion
The explanation of anomeric interconversion in water has been anticipated for over a century and a half. Jean Baptiste Biot had observed in 1815 that certain substances, including glucose, rotated plane polarized light when in solution, and Dubrunfaut described the change in polarization as twice Biot’s value if one observed carefully from the moment glucose was dissolved in cool water1. Pasteur repeated these observations for glucose-NaCl shortly thereafter2. Dubrunfaut’s discovery set off sizable interest in the new phenomenon, and the first article published in the Journal of the American Chemical Society described a polarimetric method for determining the quantity of glucose in cane sugar34.
Role of the aldehyde form
Lowry first suggested that the conversion between α- and β-glucopyranose occurs by intermediate conversion to the aldehyde form, present in the solution phase of any reducing sugar5. This “reducible” form was quantified much later by Los, Simpson, and Wiesner35 as comprising approximately 0.0026 % of the total glucose in solution at 25 °C. In treating the reaction as two steps, workers first included the aldehyde form in measurement of kinetic constants in glucose anomerization, but they did not solve the free energy profile. Schmid36 treated the reaction as a single step and found values similar to the present data for heat and entropy of activation in glucose anomerization (17.2 kcal/mol and -24 cal/mol K, respectively). It has also been noted that the slow isotope exchange of [1-18O]D-glucose in water as compared to mutarotation rates definitively rules out a significant role of an aldehydrol form37,38, although this form has been observed in solution39 with the other tautomers.
Previous work led to an estimation of the activation energy by measuring the gross conversion of one anomer to an equilibrium mixture, thus approximating the reaction to a single step mechanism36.
The role of water in catalysis
Challis40 found the deuterium solvent KIE for glucose and tetra-O-methyl glucose to be 3.8 and 3.2, respectively, concluding that most of the solvent KIE in glucose results from the exchangeable proton on OH1. The effects measured by Challis and in this work argue against the role of hydronium or general acid catalysis at neutral pH. In such a mechanism, protonation of O5 is the key feature, and deprotonation of OH1 and the breakage of the bond between O5 and C1 vary in synchronicity. Based on previous computations with hydrogen bonds to hydroxyl groups20, we know that protonating O5 would decrease hyperconjugation of O5 lone pairs to the antibonding orbital of CH5 bond (n → σ*). This would yield an inverse KIE at H5, which is not seen. A hydronium ion would not be able to accomplish partial deprotonation of OH1 as required by the H1-KIE of 1.119 without first protonating O5 and causing bond breakage between C1 and O5, which is also not seen to significant degree. In order to produce the observed solvent KIE, the transition state must possess an oxygen atom with three associated protons. The reason is that two protons must each be relatively distant in bond length to its oxygen, giving rise to the bowed shape of Figure 9. It is highly unlikely even if the proton transferred to O5 were of extended bond length, that one or both of the protons remaining associated with the hydronium oxygen would not be at their ground state length. Having two protons shared beteen the hydronium oxygen and O5, similar to the structure seen in Figure 4a, would accomodate only this last this concern. Previous authors have argued against acid catalysis by hydronium in neutral solution41.
Simultaneous protonation of O5 and deprotonation of OH1 by either one or two bridging water molecules could be acceptable from the curved shape of the solvent KIE data. However, all computational models published before this report show that co-synchronous bond breaking between O5 and C1 is a mandatory consequence14,42. Yamabe et al’s computed transition states14 containing one water molecule are structurally similar to our OH1-O5 bridging models. Each solvent proton is relatively shared between O5 or O1 and the water oxygen (proton-oxygen distances of 1.20 Å and 1.24 Å for the O5 and water oxygen pair and 1.18 Å and 1.28 Å for the O1 and water oxygen pair). They computed transition states with two water molecules as well that showed considerable ring-opening (O5-C1 distance of 1.71 Å and 1.66 Å for α-pyranose or β-pyranose opening, respectively) and solvent proton symmetry. We calculated the KIE expected from their ground state and transition state models, using frequency calculations performed at B3LYP/6-31G* (SCLF). The solvent KIE expected from their one-water model was 8.6 and from their two-water model was approximately 20. The primary [1-13C] and [5-18O] KIE expected from their one-water transition states were 1.011 and 1.013, reflecting considerably more ring-opening than seen experimentally.
On the other hand, base-catalyzed anomerization proceeding through proton abstraction from OH1 by the neutral water molecule is consistent with experimental solvent KIE. Total abstraction of the OH1 proton results in a water oxygen atom with three protons, two of which are shown in the present models to account for the solvent KIE.
Schmid13 also concluded that the transition state includes the antisymmetric vibrational stretch of the hydronium ion. He rationalized the negative entropy of activation as the cost of aligning solvent water molecules with the electric field between the hydronium and glucosate ions that he postulated were formed at the transition state. He also asserted a “flip” of α-glucosate to β-glucosate without the presence of aldehyde form, a view not widely held today.
Several studies aimed to estimate the number of water molecules participating in transition state formation. Ballash and Robertson43 slowly varied water concentration in DMSO, and Kjaer et al also used 1,4-dioxan and acetonitrile12. Unfortunately, these studies suffered from the increased complexity of adding a second solvent. The present data and computations suggest that a single water is sufficient for catalysis, but it has not been proven that more water molecules do not participate.
Timing at the transition state
An “early” transition state is one in which not very much bond breakage has occurred between C1 and O5. Such a transition state resembles a ground-state pyranose, and little rehybridization of C1 to sp2 has occurred. In contrast, a “late” transition state resembles the aldehyde more closely, where C1-O5 bond breakage has mostly occurred with significant rehybridization at C1 to sp2 geometry.
We know that in comparing the α-pyranose ground state against the aldehyde, the EIE for [1-d], [1-13C], [5-18O] and deuterium oxide solvent are 1.29, 0.993, 1.001, and 1.005, respectively. Furthermore, the [1-d] KIE expected for an unperturbed OH1, fully deprotonated OH1, and fully formed sp2 center at C1 in the aldehyde are 1.000, 1.36, and 1.29, respectively. The more closely a transition state resembles the aldehyde, the more the experimental KIE will approximate the EIE for the completed opening reaction. The experimental KIE of 1.119 therefore mandates partial deprotonation of OH1, ruling out the late transition state. The high pH 13C-NMR spectrum of aqueous glucose contains the two anomers in slow equilibrium44, indicating that deprotonation occurs quickly with respect to ring-opening. O5-C1 bond-breakage must lag behind the deprotonation, establishing that the transition state is an early one. Therefore, the synchronicity of later events such as protonation of O5 and bond-breaking between O5 and C1 is inaccessible by transition state probes.
Primary kinetic isotope effects
In selecting the most likely models to represent the actual transition states, we begin by matching the primary isotope effects, including the solvent KIE. The bottom three rows of Table 2 list predicted primary KIE for the three sets of models for comparison with experiment. There are three compelling reasons to exclude water bridging O5-OH1 from further consideration: the computed solvent KIE, 1-13C KIE and 5-18O KIE are all much too large. The top row of Figure 10 shows in stereoview the α-pyranose transition state with water bridging OH1 and O5, and the arrows illustrate the atomic displacements corresponding to the unique decomposition mode of the transition state (with frequency of –1092 cm−1 for the alpha structure shown). Co-synchronously with deprotonation of OH1, the bridging water donates one proton to O5, satisfying nucleophilicity and contributing to a partial ring-opening. For the α-isomer transition state, the distance between O5 and C1 is 1.69 Å, and 1.71 Å in the β-transition state, compared in each case with the α-pyranose ground state O5-C1 distance 1.428 Å. The large 1-13C and 5-18O KIE indicate that this model reflects more ring-opening than occurs at the actual transition state, while the solvent KIE of 7.112 or 7.390 indicate that the vibrational environment felt by the two protons in motion is much more loose than in the actual transition state.
Conversely, for the models containing one water molecule either bonded to OH1 or bridging OH1 and OH2, theory and experimental primary KIE agree more closely. Previous work with equilibrium isotope effects in glucose20,45 has shown that the C1-H1 bond is an exquisite measure of both OH1 hydroxyl dihedral angle (H1-C1-O1-OH1) and protonation state of O1. Full deprotonation of O1 can be expected to yield a deuterium KIE at H1 of approximately 1.36. The models most closely matching experiment are the water bonding strictly to OH1 for the α-sugar and water bridging OH1 and OH2 for the β-sugar. These are shown in the second and third row of Figure 10, respectively. Atomic displacements are shown for each decomposition mode, with a frequency of −796 cm−1 or −1312 cm−1, respectively.
The weighting of these α- and β-transition state KIE based on the free energy profile is given in the “weighted models” column of Table 2, comparing favorably against the experimental KIE given in the last column.
Solvent kinetic isotope effects
The difference in solvent KIE between the models is easily explained. Water bridging OH1 and O5 yields two protons in flight that are each more equidistant between the two oxygens than in the other models. For instance, in the α-glucose OH1-O5 bridge model, one proton is 1.182 Å from O5 and 1.249 Å from the water oxygen, and the other proton is 1.350 Å from O1 and 1.109 Å from the water oxygen. In contrast, the α-sugar with water bonded only to OH1 yields two protons that are 2.028 Å and 2.068 Å from O1 and 1.052 Å and 1.046 Å from the water oxygen (middle row of Figure 10). In the β-glucose model with water bridging OH1 and OH2, the two protons are 1.548 Å and 1.533 Å from O1 and 1.067 Å and 1.068 Å from the water oxygen (bottom row of Figure 10). Protons more equidistant are less tightly associated with either oxygen, and possess the much lower vibrational force constants and lower vibrational frequencies associated with large KIE.
In comparing the second and third rows of Figure 10, each water molecule has mostly deprotonated O1. At the same time, the bond length between the water oxygen and one of the native protons has stretched (originally 0.96 – 0.97 Å), so that of three protons on the new hydronium ion, two are similar in bond length (1.04 – 1.05 Å), seen also in Figure 11. These are the two protons causing the solvent KIE, consistent with the bowed appearance of Figure 9. Each is similar vibrationally, and the glucose molecule has been fully deprotonated. In neither model is the reactive water poised to provide protonation of O5 and impetus to ring opening.
Figure 11.
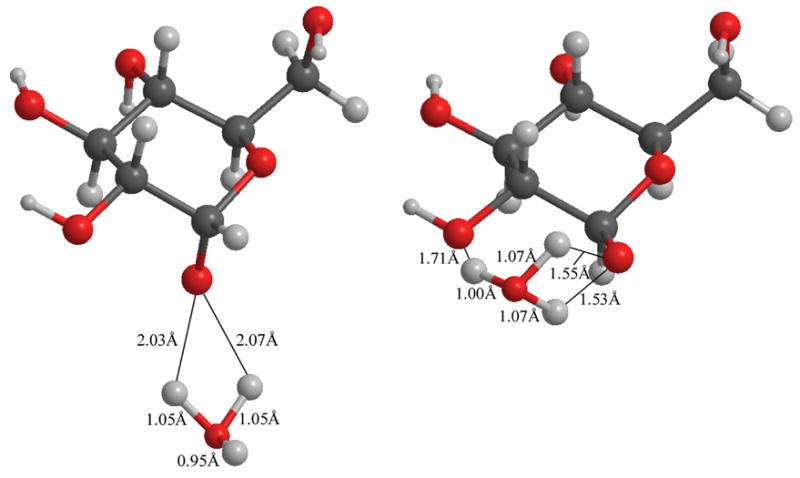
Transition state models via water-catalysis at neutral pH. Each model has two hydrogen bonds between the water oxygen and O1. Note the asymmetry in O-H-O interatomic radii and that placement is nearly identical for each proton shared.
Secondary kinetic isotope effects
The KIE at H1 is explained directly from changes in bond order between C1 and H1. The ability of the C1-H1 bonding (σ) orbital to deliver electron density to σ* antibonding orbitals comprising the other local bonds and the ability of these other intramolecular bonding (σ) orbitals or lone-pair (n) orbitals to donate density to the C1-H1 σ* antibonding orbital (illustrated in Figure 12) are considered sources of lowering bond order at C1-H1. This calculation is performed using the NBO (natural bond order)46 suite within Gaussian 98, and the results are summarized for the C1-H1 bond in the top half of Table 3. For each water position, one can compare the α-pyranose ground state with the two transition states. Bond-order lowering interactions (hyperconjugative change) increase, for example, from 18.9 kcal/mol to 22.7 kcal/mol in comparing α-pyranose and α-transition state for the O5-OH1 bridging model. This decreases the CH bond order, the strength of the stretching force constant, and the vibrational frequency, and increases the bond length. This effect is seen for the CH1 bond in each model presented.
Figure 12.
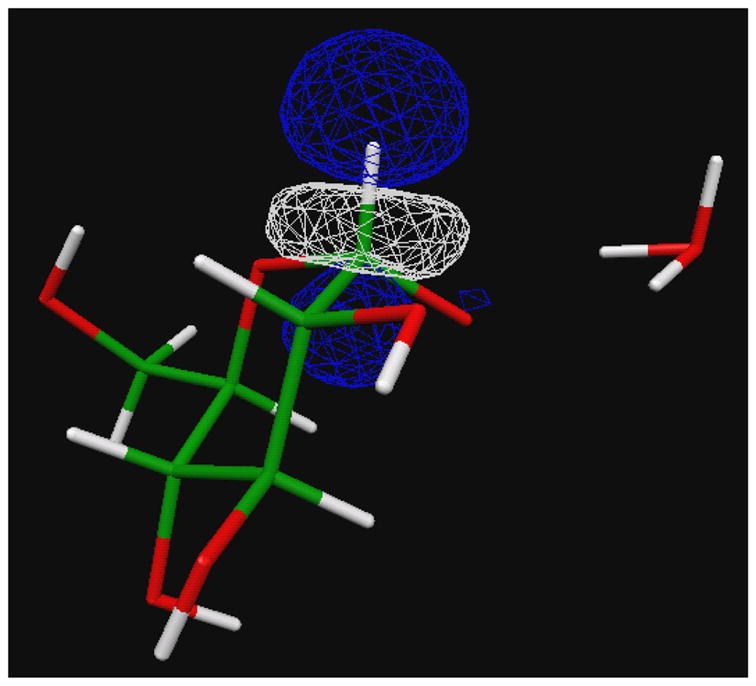
The antibonding orbital σ* orbital of CH1 accepts electron density from lone pair orbitals of O1 and O5. Deprotonation of OH1 increases this hyperconjugation, leading to vibrational loosening of CH1 and to a [1-d]glucose KIE between 1.0 and 1.036.
Table 3.
Bond length, orbital characteristics, and vibrational frequencies for CH1 and CH2.
| CH1 | bond length (Å) | hyperconj change (kcal/mol) | bond occupancy (electrons) | stretch freq cm−1 | calc'd KIE | |
|---|---|---|---|---|---|---|
| O5-OH1 | α-pyranose | 1.098 | 18.9 | 1.946 | 3062 | - |
| α-TS | 1.103 | 22.7 | 1.930 | 3002 | 1.097 | |
| β-TS | 1.110 | 25.5 | 1.920 | 2923 | 1.155 | |
| OH1 | α-pyranose | 1.097 | 17.3 | 1.950 | 3068 | - |
| α-TS | 1.109 | 21.7 | 1.928 | 2903 | 1.114 | |
| β-TS | 1.121 | 25.8 | 1.913 | 2776 | 1.203 | |
| OH1-OH2 | α-pyranose | 1.099 | 17.5 | 1.947 | 3035 | - |
| α-TS | 1.104 | 22.4 | 1.932 | 2975 | 1.039 | |
| β-TS | 1.113 | 23.5 | 1.924 | 2883,2856 | 1.109 | |
| CH2
|
||||||
| O5-OH1 | α-pyranose | 1.096 | 20.8 | 1.946 | 3094 | - |
| α-TS | 1.096 | 20.0 | 1.948 | 3096 | 1.003 | |
| β-TS | 1.100 | 21.8 | 1.942 | 3040 | 1.055 | |
| OH1 | α-pyranose | 1.102 | 21.8 | 1.940 | 2987 | - |
| α-TS | 1.103 | 21.8 | 1.943 | 2991 | 1.022 | |
| β-TS | 1.102 | 22.1 | 1.938 | 3014 | 1.045 | |
| OH1-OH2 | α-pyranose | 1.100 | 21.0 | 1.944 | 3029,3036 | - |
| α-TS | 1.097 | 18.0 | 1.949 | 3078,3097 | 0.987 | |
| β-TS | 1.101 | 21.4 | 1.943 | 3032 | 1.022 |
The isotope effect at H2, matched by the transition state models, is not governed by the same orbital-orbital hyperconjugative interaction as at H1. From Table 3, there is no difference in CH bond length, total hyperconjugative energy, bond order, or stretch frequency between either transition state and the reference ground state model. Disregarding vibrational mode mixing, each atom should be associated with three vibrational modes, one for each physical dimension. One of these will be a bond-stretch mode, and the other two can be mutually orthogonal bend vibrations also orthogonal to the stretch mode. As the stretch mode is governed by hyperconjugative interactions, we conclude that the isotope effect is due to one or more alterations in these bending modes. As the models presented herein do not contain solvent water shells but reproduce the KIE at H2 well, these bending modes are likely to result from intramolecular interactions in glucose at the transition state. We know from isotope effect study of the conformational equilibrium between α-glucose and β-glucose in water20 that the isotope effect at H3 and H5 should be approximately 1.027 and 1.036, respectively. The bending mode force constants CH bonds of H3 and H5 are inherently smaller in β-glucose than α-glucose at the ground state in solution, due in the equilibrium reaction to intramolecular crowding in α-glucose by the axial O1-C1 bond that is equatorial in β-glucose. The KIE in the present work reveals that the water structure adjacent to these distal sites is tighter and less fluid in the β-transition state than around the β-ground state but similar in crowding to the α-ground state.
Computed transition states do poorly in matching the secondary KIE at H5, and H6, but these positions are distal to chemistry. The near-unity experimental effects at H3, H4, H5, and H6 most likely represent averaging over many configurations around the C5-C6 bond and the C6-O6 bond in solution in both the ground state and transition state sugars in water.
Conclusion
Transition state structure for glucose mutarotation is the last remaining issue in characterizing the anomerization of glucose in water. The bidirectional nature of mutarotation forced this problem to await the deconstruction of the equilibrium isotope effects before kinetic isotope effects on individual reaction steps were within reach. The transition state structures were solved using a broad set of KIE and by analyzing the reaction as a two-step unidirectional process. Hydronium catalysis and the late transition state of general-base catalysis can be eliminated as features of the transition states. Only one water molecule is necessary to participate in each transition state for ring-opening. While there are many positions for the water molecule to occupy, subject to the constraints of the water lattice, we find that the water molecule participating in ring-opening must not bridge OH1 and O5. The transition state occurs as OH1 is mostly deprotonated but bond-cleavage at O5-C1 has not occurred. Solvent KIE are consistent with the vibrations of two hydronium protons with lengthened bonds to the water oxygen. Finally, we show that these conclusions must apply equally to the α- and β-transition states, as both contribute experimentally to isotope effect measurements.
Supplementary Material
Gaussian job files, cartesian coordinates of the transition states, and complete Reference 23. This material is available free of charge via the Internet at http://pubs.acs.org.
Acknowledgments
Acknowledgement.
This work was supported by NIH research grant GM 41916 and NSERC discovery grant 121348-02.
References
- 1.Dubrunfaut AP. Compt Rend. 1846;23:38. [Google Scholar]
- 2.Pasteur L. Ann Chim Phys. 1851;31:67. [Google Scholar]
- 3.Bronsted JN, Guggenheim EA. J Am Chem Soc. 1927;49:2554–2584. [Google Scholar]
- 4.Lowry TM, Smith GF. J Chem Soc. 1927:2539–2554. [Google Scholar]
- 5.Lowry TM. J Chem Soc. 1903;83:1314–1323. [Google Scholar]
- 6.Arrhenius S. Z Physik Chem. 1889;4:226. [Google Scholar]
- 7.Michaelis L, Menten ML. Biochem Z. 1913;49:333–369. [Google Scholar]
- 8.Haworth WN. The Constitution of Sugars. Edward Arnold & Co; London: 1929. [Google Scholar]
- 9.Swain CG, Brown JF., Jr J Am Chem Soc. 1952;74:2534–2537. [Google Scholar]
- 10.Swain CG, Brown JF., Jr J Am Chem Soc. 1952;74:2538–2543. [Google Scholar]
- 11.Engdahl KA, Bivehed H, Ahlberg P, Saunders WH., Jr J Am Chem Soc. 1983;105:4767–4774. [Google Scholar]
- 12.Kjaer AM, Sorensen PE, Ulstrup J. J Chem Soc, Perkin II. 1978;21:51–59. [Google Scholar]
- 13.Schmid H. Z Physik Chem N Folge. 1975;94:83–94. [Google Scholar]
- 14.Yamabe S, Ishikawa T. J Org Chem. 1999;64:4519–4524. [Google Scholar]
- 15.Bennet AJ, Sinnott ML. J Am Chem Soc. 1986;108:7287–7294. [Google Scholar]
- 16.Hardick DJ, Hutchinson DW. Bioorg Med Chem Lett. 1994;4:409. [Google Scholar]
- 17.Wolfrom ML, Thompson A. Methods Carbohydr Chem. 1963;2:211. [Google Scholar]
- 18.Thompson A, Wolfrom ML. Methods Carbohydr Chem. 1963;2:215. [Google Scholar]
- 19.Brauman JI. Anal Chem. 1966;38:607. [Google Scholar]
- 20.Lewis BE, Schramm VL. J Am Chem Soc. 2001;123:1327–1336. doi: 10.1021/ja003291k. [DOI] [PubMed] [Google Scholar]
- 21.Bergson G, Matsson O, Sjoberg S. Chem Scr. 1977;11:25. [Google Scholar]
- 22.Zhu Z, Zajicek J, Serianni AS. J Org Chem. 2001;66:6244–6251. doi: 10.1021/jo010541m. [DOI] [PubMed] [Google Scholar]
- 23.Frisch MJ, et al. Gaussian 94, Revisions C.2, D.4, Gaussian 98, Revision A.6. Gaussian, Inc; Pittsburgh, PA: 1998. [Google Scholar]
- 24.Paneth P. Lodz. Poland: 1998. [Google Scholar]
- 25.Wong MW. Chem Phys Lett. 1996;256:391–399. [Google Scholar]
- 26.Flukiger PF, Portman S. 4.2. Manno; Switzerland: 2001. [Google Scholar]
- 27.Serianni AS, Pierce J, Huang SG, Barker R. J Am Chem Soc. 1982;104:4037–4044. [Google Scholar]
- 28.Forsen S, Hoffman RA. J Chem Phys. 1963;39:2892–2902. [Google Scholar]
- 29.Campbell ID, Dobson CM, Ratcliffe RG, Williams RJP. J Mag Res. 1978;29:397–417. [Google Scholar]
- 30.Snyder JR, Johnston ER, Serianni AS. J Am Chem Soc. 1989;111:2681–2687. [Google Scholar]
- 31.Li NC, Kaganove A, Crespi HL, Katz JJ. J Am Chem Soc. 1961;83:3040–3043. [Google Scholar]
- 32.Elrod JP, Hogg JL, Quinn DM, Venkatasubban KS, Schowen RL. J Am Chem Soc. 1980;102:3917–3922. [Google Scholar]
- 33.Albery WJ. In: Proton Transfer Reactions. Caldin E, editor. Chapman and Hall; London: 1975. [Google Scholar]
- 34.Ricketts PdP. J Am Chem Soc. 1879;1:2–6. [Google Scholar]
- 35.Los JM, Simpson LB, Wiesner K. J Am Chem Soc. 1956;78:1564–1568. [Google Scholar]
- 36.Schmid H, Bauer G. Angew Chem. 1965;77:973. [Google Scholar]
- 37.Rittenberg D, Graff C. J Am Chem Soc. 1958;80:3370. [Google Scholar]
- 38.Bentley R, Bhate DS. J Biol Chem. 1960;235:1225. [PubMed] [Google Scholar]
- 39.Maple SR, Allerhand A. J Am Chem Soc. 1987;109:3168–3169. [Google Scholar]
- 40.Challis BC, Long FA, Pocker Y. J Chem Soc. 1957:4679. [Google Scholar]
- 41.Isbell HS, Pigman W. Adv Carbohydr Chem Biochemistry. 1969;24:13–65. [PubMed] [Google Scholar]
- 42.Morpurgo S, Brahimi M, Bossa M, Morpurgo GO. Phys Chem Chem Phys. 2000;2:2707–2713. [Google Scholar]
- 43.Ballash NM, Robertson EB. Can J Chem. 1973;51:556–564. [Google Scholar]
- 44.Lewis BE, Schramm VL. J Am Chem Soc. 2003;125:7872–7877. doi: 10.1021/ja034983m. [DOI] [PubMed] [Google Scholar]
- 45.Lewis BE, Schramm VL. J Am Chem Soc. 2003;125:4785–4798. doi: 10.1021/ja0298242. [DOI] [PubMed] [Google Scholar]
- 46.Glendening ED, Reed AE, Carpenter JE, Weinhold F. Theoretical Chemistry Institute and Department of Chemistry. University of Wisconsin; Madison, WI: 1994. [Google Scholar]
Associated Data
This section collects any data citations, data availability statements, or supplementary materials included in this article.
Supplementary Materials
Gaussian job files, cartesian coordinates of the transition states, and complete Reference 23. This material is available free of charge via the Internet at http://pubs.acs.org.