Abstract
The emergence of high-throughput next-generation sequencing technologies (e.g., 454 Life Sciences [Roche], Illumina sequencing [formerly Solexa sequencing]) has dramatically sped up whole-genome de novo sequencing and resequencing. While the low cost of these sequencing technologies provides an unparalleled opportunity for genome-wide polymorphism discovery, the analysis of the new data types and huge data volume poses formidable informatics challenges for base calling, read alignment and genome assembly, polymorphism detection, as well as data visualization. We introduce a new data integration and visualization tool EagleView to facilitate data analyses, visual validation, and hypothesis generation. EagleView can handle a large genome assembly of millions of reads. It supports a compact assembly view, multiple navigation modes, and a pinpoint view of technology-specific trace information. Moreover, EagleView supports viewing coassembly of mixed-type reads from different technologies and supports integrating genome feature annotations into genome assemblies. EagleView has been used in our own lab and by over 100 research labs worldwide for next-generation sequence analyses. The EagleView software is freely available for not-for-profit use at http://bioinformatics.bc.edu/marthlab/EagleView.
In the past three years, the emergence of massively parallel sequencing technologies has dramatically reduced time and costs for whole-genome sequencing. For example, the current 454 Life Sciences (Roche) GS FLX system, which can produce 100 million bases per run in less than eight hours, is hundreds of times faster and over 10 times cheaper than the conventional Sanger capillary sequencing. The Illumina sequencing (formerly Solexa sequencing) technology is able to generate over one billion bases of high-quality DNA sequence per run at less than 1% of the cost of capillary sequencing. Such technological advances will soon make it possible to sequence individual human genomes within a short timeframe and at an affordable price. The emergence of new, even faster technologies (e.g., Pacific Biosciences’ technology) has the potential to make the 1000-dollar human genome a reality. The new sequencing technologies make possible comprehensive genetic and epigenetic variation analysis (Barski et al. 2007; Mikkelsen et al. 2007), regulatory element identification (Robertson et al. 2007), structural variation discovery (Swaminathan et al. 2007), and transcriptome quantification (Ng et al. 2006). The huge volume of new sequencing data, the relatively shorter read lengths, and the different error models of new sequencing technologies, however, present us with difficult informatics challenges.
One of the main challenges is data visualization. Visualization is an essential requirement for many data analyses including but not limited to the following tasks. (1) Uncovering errors in sequence read mapping, alignment, and assembly. Erroneous read mapping to paralogous regions, as well as local alignment and assembly errors lead to false single nucleotide polymorphism (SNP) calls. Visual inspection can reveal these errors. (2) Software development and testing for downstream analysis. The development of assembly algorithms and polymorphism discovery tools requires rigorous software testing which is greatly facilitated by the display of base discrepancies, machine signals, and base quality values. (3) Data validation. Experimental data validation often requires that we view additional sequences collected for verification together with the primary assembly data. (4) Data interpretation and hypothesis generation. The interpretation of candidate polymorphism sites (e.g., SNP) in a genomic context requires integration of genome annotation data (e.g., gene structure) into the assembly view. This integration in turn facilitates hypothesis generation for follow-up experimentation.
To fulfill these functions the visualization tool must be able to handle large genome assemblies of millions of reads, display mixed-type sequence reads with trace signals simultaneously, and display complex genome annotations. Existing assembly viewers such as consed (Gordon et al. 1998) and Hawkeye (Schatz et al. 2007) were designed for genome assemblies of Sanger capillary sequence reads and do not yet have effective support for next-generation sequence reads. For example, consed does not offer a compact assembly view and has very limited support for annotations (only displays colored read or consensus tags). Loading large assemblies into consed requires a large amount of memory not typically available to most users. Hawkeye has similar memory limitations for large genome assemblies and has no support for viewing genome feature annotations. Neither tool supports viewing technology-specific trace signals for assemblies of mixed-type reads from different sequencing technologies. Inclusion of the above features was the main design consideration for our new assembly viewer, EagleView, for supporting genome assemblies of next-generation sequencing technologies.
Results
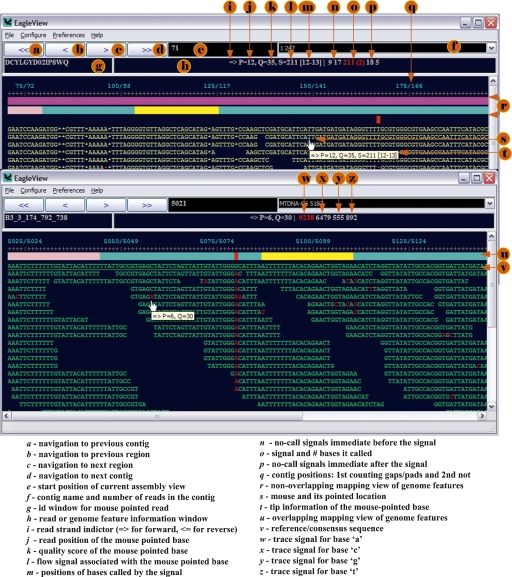
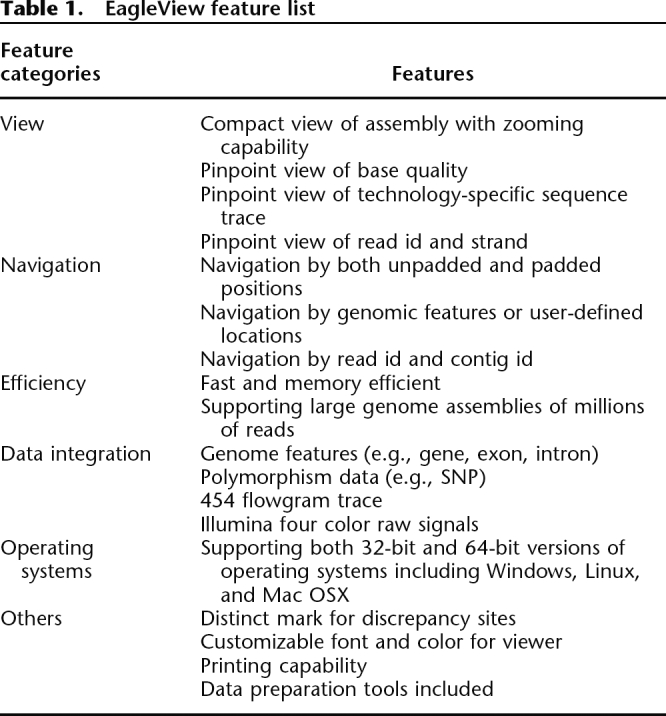
EagleView is a user-friendly viewer with a single-window GUI. Its feature set was specifically designed for visualization of large genome assemblies of next-generation sequence reads (see Fig. 1; Table 1). In order to utilize screen space effectively, EagleView offers a compact assembly view (i.e., reads are optimally placed in multiple lines, each having multiple reads) and displays technology-specific trace signals using a pinpoint view. It can display assemblies of mixed-type reads with the appropriate trace information. Importantly, EagleView has extensive support for displaying genome annotation tracks as well as user-defined sequence features. It allows navigation by genome location (padded or unpadded), read id, annotation feature, or any user-defined coordinate map. It also supports zooming ,and customizable fonts and colors. EagleView comes with detailed documentation and is distributed as binary installation packages for the three major operating systems (Windows, Linux, and Mac). The software is available at the authors’ websites.
Figure 1.
Illustration of EagleView features. The EagleView shown in the figure is the version for Microsoft Windows. All features except the mouse-tip window shown in the figure are also available for both Linux and Mac versions. The upper part shows a genome assembly of 454 sequence reads; the lower part displays an assembly of Illumina reads.
Table 1.
EagleView feature list
Computational efficiency
A typical genome assembly of next-generation sequencing technologies may contain hundreds of millions of reads, reaching assembly file size of many gigabytes. Regions in the assembly may have hundreds or thousands of folds coverage. Computational efficiency, especially memory usage, is therefore a critical issue. We compared EagleView’s computational requirements to consed (version 16.0) and Hawkeye (version 2.0.4) on a data set that was possible to load with all three programs (see Methods). This data set consists of nearly seven million 32-base reads from genome resequencing of the K-12 strain of Escherichia coli by the Illumina sequencing technology. We found that the CPU time used by EagleView during loading the assembly was not significantly different from the two other programs. However, EagleView required less than one fourth of the memory used by consed or Hawkeye (see Table 2). We also tested the three tools on two larger genome assemblies of C. elegans chromosomes consisting of over 14 and 19 million 32-base Illumina reads, respectively. Consed and Hawkeye were unable to load either one of these two assemblies on our 24 GB RAM Linux server, whereas EagleView successfully opened both.
Table 2.
Efficiency comparison
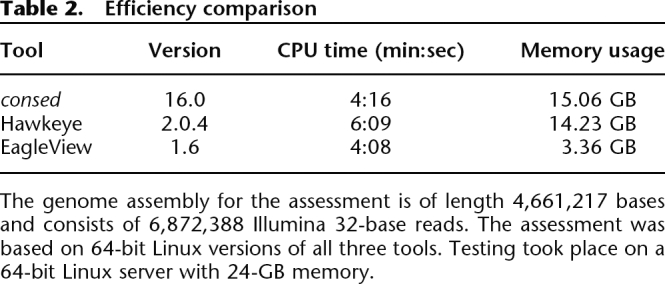
The genome assembly for the assessment is of length 4,661,217 bases and consists of 6,872,388 Illumina 32-base reads. The assessment was based on 64-bit Linux versions of all three tools. Testing took place on a 64-bit Linux server with 24-GB memory.
Genome assembly inspection, software development, and debugging
An important application of the viewer application is sequence assembly inspection. In de novo assemblies one looks, e.g., for erroneous joins between contigs based on spurious read overlaps, areas of low sequence coverage, or regions covered by only low-quality reads or reads from only one strand. In reference sequence guided assemblies, one looks for erroneously mapped reads representing duplicated, paralogous or repetitive genome regions, and local misalignments due to sequencing errors, typically because of consecutive insertion/deletion errors. Identification of such mapping, alignment, and assembly errors helps software development because it can pinpoint algorithmic weaknesses. For example, we used EagleView to identify local misalignments of 454 reads where different base insertion errors within three reads were aligned as a base substitution (e.g., Supplemental Fig. 1). We used these examples to develop a 454-specific scoring scheme in our alignment program MOSAIK. We also used examples of erroneously mapped reads to improve the mapping accuracy of MOSAIK. EagleView has several key features that help assembly inspection. First, the zoomed-out view allows users to scroll through the entire assembly and scan for regions of assembly errors. The ability to zoom in allows users to closely inspect such regions. EagleView marks bases in red within reads that are discrepant relative to the genome reference or contig consensus sequence. Regions with a high number of such discrepancies provide a visual cue for possible assembly errors. The features supporting the inspection of base quality values and underlying machine signals allow users to distinguish between true discrepancies and base calling errors.
Validation of candidate polymorphisms
Manual checking of candidate polymorphisms in resequencing data is important because current computational polymorphism discovery tools for the new sequencing technologies are still in an early developmental stage. Mismatches between erroneously aligned reads and the reference genome representing paralogous differences between duplicated genome regions give rise to false candidate polymorphisms. Similarly, if a read is locally misaligned, the misaligned base is often called by the polymorphism discovery software as a candidate polymorphism. EagleView allows users to manually check and identify such falsely called candidates.
In addition to the manual inspection of the primary data, validation of, e.g., candidate polymorphisms often involves the collection of additional sequence data by a different sequencing technology. The inspection of such experimental validation data, together with the primary sequence reads used in the discovery process, requires that we can combine reads from multiple different sequencing platforms in a single assembly view. EagleView supports the assembly view of mixed-type reads of next-generation sequencing technologies. The capability allows one to view coassemblies of, e.g., 454 and Illumina reads, and inspect trace signals and compare sequence reads between technologies at candidate polymorphisms.
Data interpretation and hypothesis generation
Often what users want to know after candidate polymorphisms are extracted is whether these candidates fall within genes, exons, splice sites, or regulatory regions. This information is essential to assess the potential significance of a given variant, to point to genes that may be phenotypically important, and thus guide further experimentation. An essential feature of EagleView in this regard is the extensive support for integrating genome feature annotations together with the primary assembly data (Supplemental Fig. 3). It supports the importation of annotations of various classes, the display of specific feature id (e.g., gene name and exon ID), as well as the definition of user-defined features (e.g., candidate SNP sites). Additionally, EagleView supports navigation by feature map positions. This is useful, e.g., to rapidly scroll through every candidate polymorphism site, or to inspect every exon in a given genome region.
Application examples
We have used EagleView for studying the sequencing error profile of 454 pyrosequencing technology and its implications for improving sequence read alignment/assembly tools. The data for the study contain two runs of Helicobacter pylori genome resequencing reads generated from the 454 GS20 sequencing machine. We used the Smith-Waterman-based ACANA tool (Huang et al. 2006) to estimate the error profile by aligning a random sample of 10,000 reads from the entire data set (610,000 reads) to the H. pylori reference genome (1,700,000 bp). We found that the average error rate is markedly increased along the length of homo polymers with the overcall error rate increasing more rapidly (Supplemental Fig. 4). Such 454 sequencing error pattern potentially causes many alignment/assembly errors if the alignment algorithm does not take the error profile into consideration. Using EagleView, we examined and identified different types of alignment errors resulting from consecutive insertions and deletions in the 454 sequences (Supplemental Fig. 1), and used this information to improve our alignment algorithm for 454 sequences.
We used EagleView to manually inspect SNP candidates that we identified computationally between the Bristol and Pasadena strains of Caenorhabditis elegans in a large-scale genome resequencing study using the Illumina sequencers (Hillier et al. 2008). In SNP discovery, false SNP calls can result from alignment errors, sequencing errors, gene paralogs, or from defects in the SNP detection algorithm. Manual inspection using EagleView allowed us to identify the exact problems and helped us improve our assembly and SNP detection algorithms. We also used EagleView’s bird’s-eye-view feature to quickly scroll through and spot-check the C. elegans genome assembly (Supplemental Fig. 2; Hillier et al. 2008).
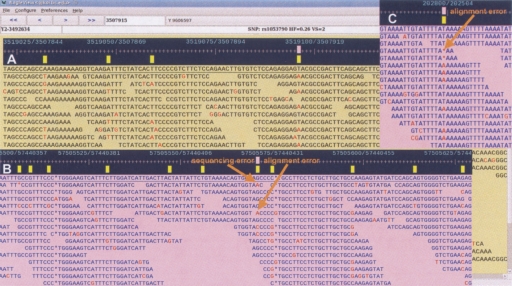
We used EagleView to examine human polymorphism data in the context of gene annotations. This type of analysis is gaining importance as large, comprehensive human genome resequencing projects (e.g., the international 1000 Genomes Project) are gearing up. To facilitate the comparison, e.g., between SNPs discovered in the 1000 Genomes data and known genetic variants, we have constructed MAP files (i.e., feature annotation files in the format required by EagleView) from SNPs contained in dbSNP (build no. 128) and in the HapMap project (release no. 22). In addition, we constructed MAP files from the known human transcripts including mRNA and EST from the NCBI genome annotation (build no. 36) to enable visual inspection of genetic polymorphisms within the genome context. All these MAP files are available at the EagleView Web site. To demonstrate analyses that will be typical for whole-genome, multi-individual, human resequencing data, we performed the following two experiments. In the first experiment, we generated 20-fold simulated Illumina read coverage of the human Y chromosome, and aligned the reads with our reference guided alignment program MOSAIK. We then used EagleView to examine assembly errors and sequencing errors that in read data would lead to false positive SNP candidates or wrong genotypes calls (Fig. 2). In the second experiment, we used EagleView to inspect real human polymorphism sites identified by new Illumina sequencing data from the 1000 Genomes Project (http://www.1000genomes.org). We used EagleView feature navigation function to find and compare polymorphism map differences near gene regions among four subpopulations: Yoruba (YRI), Japanese (JPT), Chinese (CHB), and European (CEU) (Supplemental Fig. 5). We also examined discrepancies of SNP genotypes between the HapMap project and the new assembly data from the 1000 Genomes Project (Fig. 3).
Figure 2.
The genome assembly of human chromosome Y with real SNP position map. (A) A single SNP site with ID rs1053790, heterozygote frequency (HF) 0.26, and dbSNP validation status (VS) 2 (at least one sub-SNP in cluster has frequency data submitted). (B) A region with high density of SNPs. At the SNP site at position 57,440,427, the sequence error and alignment error potentially contribute wrong genotype A/C/G called at the position where the true genotype is C/G. (C) A deletion under the SNP site is due to an alignment error.
Figure 3.
Two examples of SNP genotype discrepancies between the HapMap project and the new assembly data from the 1000 Genomes Project. In the figure, the HapMap SNP ID and genotypes are shown in the white and bold font. In the left panel, the assembly shows a rare allele C in the position not reported in the HapMap. In the right panel, the assembly shows a deletion SNP but HapMap reports that it is A/T SNP. The deletion SNP likely to be true as Illumina sequencing technology has a very low rate of insertion/deletion sequencing errors.
Discussion
We have been using the early version of EagleView successfully in our data mining projects and for the development of our sequence analysis tools. We realize that additional features will be necessary. Efforts are underway to standardize next-generation read (http://sourceforge.net/projects/srf/) and assembly (http://assembly.bc.edu) formats. The new binary formats, combined with effective indexing of the assembled reads, will enable substantial reduction in memory usage and loading time. Future versions of EagleView will support these formats. We will also support the GFF3 annotation format in addition to our proprietary MAP file format. We will expand our data integration capabilities by including the visualization of, e.g., microarray-based gene expression levels. We will include trace views for the newest sequencing technologies (e.g., Applied Biosystem’s SOLiD and Helicos’ tSMS). We will support the visualization of paired-end reads, and customizable coloring schemes for identifying reads from a given technology, and/or reads representing the same DNA template. Finally, we will integrate analysis tools, e.g., our polymorphism discovery tool into the viewer application.
In summary, EagleView is the first visualization tool specifically designed for next-generation sequencing technologies. EagleView has already proved to be an essential tool in our development of informatics software for genome assembly and polymorphism discovery. We expect that it will also be useful in the many other applications of next-generation sequencing technologies. The EagleView software is available at no charge for not-for-profit use.
Methods
Efficiency test
We tested the efficiency of three tools, consed (ver. 16.0), Hawkeye (ver. 2.0.4), and EagleView (ver. 1.6), on a 64-bit Linux server with 24-GB memory. The 64-bit version of each tool was used for this test. The genome assembly file used for this test is a reference-based genome assembly of E. coli K-12 genome by Illumina sequencing technology from our collaborators at the Washington University Genome Sequencing Center (WUGSC). The assembly contains a reference genome of length 4,661,217 bases and 6,872,388 Illumina 32-base reads. This data set was selected because the assembly could be loaded on our 24-GB memory Linux server by all three programs. In the test, both consed and EagleView loaded the assembly file in the ACE format, while Hawkeye loaded the assembly file in its native bank format converted from the ACE assembly file. The CPU time and memory usage for each tool were measured after it loaded and displayed Contig view. Two larger testing assemblies were subsets of the whole-genome resequencing study of C. elegans of which the primary sequencing data were also from WUGSC (Hillier et al. 2008). The two larger assemblies contain 14,562,818, and 19,566,095 Illumina 32-base reads, respectively. All assembly files are available at the EagleView Web site.
Data file formats
EagleView reads a genome assembly file in the standard ACE format, a tag-based format commonly used by genome assembly programs (a detailed description of the ACE format is available at http://bozeman.mbt.washington.edu/consed/consed.html). EagleView uses three optional, auxiliary data files: READS, EGL, and MAP files (see Table 3). The READS and EGL files are paired together for storing base qualities and technology-specific trace signals of sequence reads. The READS file contains all read data while the EGL file is just the indexes of the contig start locations in the corresponding READS file. EagleView automatically loads base quality and trace information, if both the READS and the EGL files are present in the same directory as the ACE assembly file. The MAP file is for storing location mapping information of genome features, such as genes, exons, or SNPs. If present, the MAP file is also loaded automatically. All three optional files are in tab-delimited text formats (detailed format descriptions are provided in the EagleView documentation).
Table 3.
EagleView data files
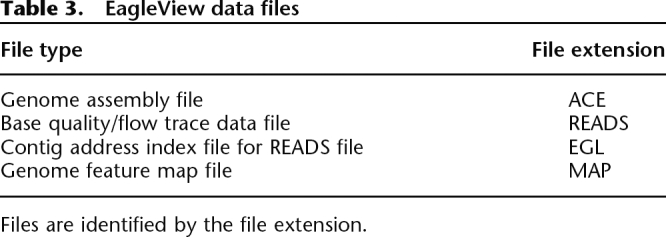
Files are identified by the file extension.
Utility tools
EagleView comes with three data conversion tools to prepare the optional data files. EagleIndexFasta converts FASTA files containing base quality and read trace information to the corresponding READS and EGL files. EagleIndexSff and EagleIndexSffM, both specific to 454 reads, extract base quality and flow signal information from the 454 binary SFF files and convert into the READ and EGL formats. EagleIndexSff converts from a single SFF file; EagleIndexSffM can convert from multiple SFF files. Detailed usage is described at EagleView’s documentation.
Acknowledgments
We thank Dr. Elaine R. Mardis at WUGSC for providing 454 and Illumina sequence data for our software testing. We also thank all EagleView beta testers for their helpful feedback. This research was supported by a grant to G.M. (no. R01 HG003698) from the National Human Genome Research Institute, National Institutes of Health.
Footnotes
[Supplemental material is available online at www.genome.org.]
Article published online before print. Article and publication date are at http://www.genome.org/cgi/doi/10.1101/gr.076067.108.
References
- Barski A., Cuddapah S., Cui K., Roh T.Y., Schones D.E., Wang Z., Wei G., Chepelev I., Zhao K., Cuddapah S., Cui K., Roh T.Y., Schones D.E., Wang Z., Wei G., Chepelev I., Zhao K., Cui K., Roh T.Y., Schones D.E., Wang Z., Wei G., Chepelev I., Zhao K., Roh T.Y., Schones D.E., Wang Z., Wei G., Chepelev I., Zhao K., Schones D.E., Wang Z., Wei G., Chepelev I., Zhao K., Wang Z., Wei G., Chepelev I., Zhao K., Wei G., Chepelev I., Zhao K., Chepelev I., Zhao K., Zhao K. High-resolution profiling of histone methylations in the human genome. Cell. 2007;129:823–837. doi: 10.1016/j.cell.2007.05.009. [DOI] [PubMed] [Google Scholar]
- Gordon D., Abajian C., Green P., Abajian C., Green P., Green P. Consed: A graphical tool for sequence finishing. Genome Res. 1998;8:195–202. doi: 10.1101/gr.8.3.195. [DOI] [PubMed] [Google Scholar]
- Hillier L.W., Marth G.T., Quinlan A.R., Dooling D., Fewell G., Barnett D., Fox P., Glasscock J.I., Hickenbotham M., Huang W., Marth G.T., Quinlan A.R., Dooling D., Fewell G., Barnett D., Fox P., Glasscock J.I., Hickenbotham M., Huang W., Quinlan A.R., Dooling D., Fewell G., Barnett D., Fox P., Glasscock J.I., Hickenbotham M., Huang W., Dooling D., Fewell G., Barnett D., Fox P., Glasscock J.I., Hickenbotham M., Huang W., Fewell G., Barnett D., Fox P., Glasscock J.I., Hickenbotham M., Huang W., Barnett D., Fox P., Glasscock J.I., Hickenbotham M., Huang W., Fox P., Glasscock J.I., Hickenbotham M., Huang W., Glasscock J.I., Hickenbotham M., Huang W., Hickenbotham M., Huang W., Huang W., et al. Whole-genome sequencing and variant discovery in C. elegans. Nat. Methods. 2008;5:183–188. doi: 10.1038/nmeth.1179. [DOI] [PubMed] [Google Scholar]
- Huang W., Umbach D.M., Li L., Umbach D.M., Li L., Li L. Accurate anchoring alignment of divergent sequences. Bioinformatics. 2006;22:29–34. doi: 10.1093/bioinformatics/bti772. [DOI] [PubMed] [Google Scholar]
- Mikkelsen T.S., Ku M., Jaffe D.B., Issac B., Lieberman E., Giannoukos G., Alvarez P., Brockman W., Kim T.K., Koche R.P., Ku M., Jaffe D.B., Issac B., Lieberman E., Giannoukos G., Alvarez P., Brockman W., Kim T.K., Koche R.P., Jaffe D.B., Issac B., Lieberman E., Giannoukos G., Alvarez P., Brockman W., Kim T.K., Koche R.P., Issac B., Lieberman E., Giannoukos G., Alvarez P., Brockman W., Kim T.K., Koche R.P., Lieberman E., Giannoukos G., Alvarez P., Brockman W., Kim T.K., Koche R.P., Giannoukos G., Alvarez P., Brockman W., Kim T.K., Koche R.P., Alvarez P., Brockman W., Kim T.K., Koche R.P., Brockman W., Kim T.K., Koche R.P., Kim T.K., Koche R.P., Koche R.P., et al. Genome-wide maps of chromatin state in pluripotent and lineage-committed cells. Nature. 2007;448:553–560. doi: 10.1038/nature06008. [DOI] [PMC free article] [PubMed] [Google Scholar]
- Ng P., Tan J.J., Ooi H.S., Lee Y.L., Chiu K.P., Fullwood M.J., Srinivasan K.G., Perbost C., Du L., Sung W.K., Tan J.J., Ooi H.S., Lee Y.L., Chiu K.P., Fullwood M.J., Srinivasan K.G., Perbost C., Du L., Sung W.K., Ooi H.S., Lee Y.L., Chiu K.P., Fullwood M.J., Srinivasan K.G., Perbost C., Du L., Sung W.K., Lee Y.L., Chiu K.P., Fullwood M.J., Srinivasan K.G., Perbost C., Du L., Sung W.K., Chiu K.P., Fullwood M.J., Srinivasan K.G., Perbost C., Du L., Sung W.K., Fullwood M.J., Srinivasan K.G., Perbost C., Du L., Sung W.K., Srinivasan K.G., Perbost C., Du L., Sung W.K., Perbost C., Du L., Sung W.K., Du L., Sung W.K., Sung W.K., et al. Multiplex sequencing of paired-end ditags (MS-PET): A strategy for the ultra-high-throughput analysis of transcriptomes and genomes. Nucleic Acids Res. 2006;34:e84. doi: 10.1093/nar/gkl444. [DOI] [PMC free article] [PubMed] [Google Scholar]
- Robertson G., Hirst M., Bainbridge M., Bilenky M., Zhao Y., Zeng T., Euskirchen G., Bernier B., Varhol R., Delaney A., Hirst M., Bainbridge M., Bilenky M., Zhao Y., Zeng T., Euskirchen G., Bernier B., Varhol R., Delaney A., Bainbridge M., Bilenky M., Zhao Y., Zeng T., Euskirchen G., Bernier B., Varhol R., Delaney A., Bilenky M., Zhao Y., Zeng T., Euskirchen G., Bernier B., Varhol R., Delaney A., Zhao Y., Zeng T., Euskirchen G., Bernier B., Varhol R., Delaney A., Zeng T., Euskirchen G., Bernier B., Varhol R., Delaney A., Euskirchen G., Bernier B., Varhol R., Delaney A., Bernier B., Varhol R., Delaney A., Varhol R., Delaney A., Delaney A., et al. Genome-wide profiles of STAT1 DNA association using chromatin immunoprecipitation and massively parallel sequencing. Nat. Methods. 2007;4:651–657. doi: 10.1038/nmeth1068. [DOI] [PubMed] [Google Scholar]
- Schatz M.C., Phillippy A.M., Shneiderman B., Salzberg S.L., Phillippy A.M., Shneiderman B., Salzberg S.L., Shneiderman B., Salzberg S.L., Salzberg S.L. Hawkeye: An interactive visual analytics tool for genome assemblies. Genome Biol. 2007;8:R34. doi: 10.1186/gb-2007-8-3-r34. [DOI] [PMC free article] [PubMed] [Google Scholar]
- Swaminathan K., Varala K., Hudson M.E., Varala K., Hudson M.E., Hudson M.E. Global repeat discovery and estimation of genomic copy number in a large, complex genome using a high-throughput 454 sequence survey. BMC Genomics. 2007;8:132. doi: 10.1186/1471-2164-8-132. [DOI] [PMC free article] [PubMed] [Google Scholar]


