Abstract
Magnetically aligned bicelles are increasingly being used as model membranes in solutionand solid-state NMR studies of the structure, dynamics, topology, and interaction of membraneassociated peptides and proteins. These studies commonly utilize the PISEMA pulse sequence to measure dipolar coupling and chemical shift, the two key parameters used in subsequent structural analysis. In the present study, we demonstrate that the PISEMA and other rotating-frame pulse sequences are not suitable for the measurement of long-range heteronuclear dipolar couplings, and that they provide inaccurate values when multiple protons are coupled to a 13C nucleus. Furthermore, we demonstrate that a laboratory-frame separated-local-field experiment is capable of overcoming these difficulties in magnetically aligned bicelles. An extension of this approach to accurately measure 13C-31P and 1H-31P couplings from phospholipids, which are useful to understand the interaction of molecules with the membrane, is also described. In these 2D experiments, natural abundance 13C was observed from bicelles containing DMPC and DHPC lipid molecules. As a first application, these solid-state NMR approaches were utilized to probe the membrane interaction of an antidepressant molecule, desipramine, and its location in the membrane.
Introduction
While structural studies using solution NMR and crystallography have provided significant insights into the functional aspects of water-soluble molecules, extension of such studies to membrane-associated molecules has been a challenge.1 However, a great deal of progress in obtaining high-resolution structures of membrane proteins using crystallography and solution NMR methods has recently been made.2-9 These pioneering advances strongly rely on the preparation of samples that satisfy the requirements of the chosen method.3,5 For example, crystallography requires a single crystal that provides high quality diffraction data while solution NMR experiments need well-behaved protein-containing micelles that can tumble rapidly enough to provide high-resolution spectra. These requirements are difficult to satisfy for most membrane-associated systems. In addition, such samples are not suitable to measure protein-membrane interactions at a high-resolution, which determine the properties of molecules embedded in the cell membrane. This is unfortunate since the structure, dynamics, folding and function of a significant number of proteins in the human genome are controlled by their ability to interact with the cell membrane. Therefore, it is highly valuable to measure the membrane interaction of such molecules and it is also essential to develop biophysical techniques that can deliver such information for any membrane protein. Recent studies have shown that solid-state NMR spectroscopy of phospholipid bilayers is well-suited for such measurements.5,10-20
Lipid bilayers in the form of either unaligned multilamellar vesicles (MLVs) or aligned samples are typically used for solid-state NMR studies. MLVs are used under static sample conditions to measure the anisotropic interactions like chemical shift, dipolar coupling and quadrupolar coupling which are useful to characterize the dynamics of a protein and to determine various properties of lipid bilayers including phase, domains, and curvature strain.21,22 MLVs are also used under magic angle spinning (MAS) conditions to obtain high-resolution spectra that can be utilized to determine the high-resolution structure of embedded proteins/peptides. However, recent studies have shown that such structural studies require either low water content and/or frozen samples to suppress molecular dynamics that degrade the spectral resolution.18,19 On the other hand, macroscopically oriented bilayer samples have been used under well-hydrated conditions to determine the backbone conformation, dynamics and topology of transmembrane proteins.5,10-14,23 Such samples have also been used to determine the structure and function of membrane-permeating peptides.21,22,24-26 In these studies bilayer samples are prepared either by mechanical alignment using glass plates or by magnetic alignment. While the preparation of an aligned sample depends on the physicochemical properties of a protein present in the sample, use of well-aligned samples has the unique advantage of preserving anisotropic spin interactions, which are highly informative in the structural studies. Recent studies demonstrated that the magnetically aligned bicelles are more suitable than mechanically aligned samples for the structural studies of membrane proteins.5,13,27 The major advantages of using bicelles are that they occupy less volume, which reduces the radiofrequency (RF) coil size and thereby the RF power requirement, relatively easy to prepare, and are stable for a long time. Therefore, considerable efforts have been devoted to develop magnetically aligned bicelles for structural studies.27-34
Bicelles are aggregates composed of short-and long-chain phospholipids in an aqueous buffer that exhibit a liquid crystalline phase macroscopically orientating in the presence of an external magnetic field. The shape and size of these aggregates is controlled by the molar ratio, q, of long-chain lipids to short-chain ones. At a high q > 2.5 value, the phase can be described as perforated, dynamical lamellar bilayers.35 Decreasing the q value produces the disc-shaped bicelle morphology where a flat bilayer composed of long-chain lipids is surrounded on the perimeter by short-chain molecules.30 Bicelles can be prepared with any desired degree of ordering: highly oriented aggregates are used in solid state NMR studies, while weakly aligned bicelles are employed as an alignment medium for structural studies on weakly aligned biomolecules using solution NMR methods. Several studies have reported on the preparation, characterization and applications of bicelles,28-34 and recent publications demonstrated the usefulness of bicelles for structural studies of proteins using heteronuclear dipolar couplings.27,36,37
One of the most popular approaches to measure heteronuclear dipolar couplings is the 2D separation of heteronuclear dipolar interactions according to chemical shifts. Since dipolar couplings correspond to local magnetic fields in the molecule, this class of experiments is referred to as separated local field (SLF) spectroscopy.12,38,39 Dipolar couplings between directly bonded 1H-13C spin pairs as well as generally weaker dipolar interactions between remote spins can be accessed depending on the experimental design. Large 13C chemical shift dispersion provides a high chemical resolution, which simplifies the assignment and allows for the separation of dipolar coupling multiplets. There are several experimental protocols for SLF spectroscopy which differ in the details of the preparation and evolution periods; while in all cases the 13C signal is observed during the detection period t2 as it evolves under the 13C chemical shift interaction and in the presence of 1H decoupling. These general protocols are applicable to both stationary and MAS sample.12,39 In the present study, we have compared three different 2D approaches for the measurement of 13C-1H dipolar interactions from the lipid molecules in aligned bicelles containing DMPC and DHPC molecules under static conditions. Our results suggest that the PISEMA (polarization inversion and spin exchange at the magic angle)40-42 and other rotating-frame pulse sequences are not suitable for the measurement of long-range heteronuclear dipolar couplings, and they provide inaccurate values when multiple protons are coupled to a 13C nucleus. Instead, a 2D PDLF (proton detected local field) sequence43, which is a laboratory-frame separated-local-field experiment, is capable of overcoming these difficulties in magnetically aligned bicelles. These results are directly transferable to 2D SLF studies of 15N nuclei, where they are typically applied for structural measurements on uniformly 15N labeled membrane proteins. Furthermore, with a simple modification in the 2D PDLF sequence, we demonstrate that, in addition to 1H-13C couplings, remote 13C-31P and 1H-31P couplings from phospholipids can be measured in bicelles. It should be mentioned here that the 2D PDLF pulse sequence has been used in previous studies to obtain high-resolution SLF spectra of solids by overcoming the difficulties found when multiple protons are coupled with a 13C nucleus.43
Since lipids play important roles in the folding and function of membrane-associated molecules, these experiments will be useful to measure the dynamics and conformation of lipid molecules. Such measurements also provide insights into the function of membrane-permeating peptides such as antimicrobial, toxin, fusion and channel-forming molecules. Similar information has previously been obtained in 2H NMR studies of deuterated lipids44 and proton spin diffusion measurements.45,46 The approach proposed in the present study, besides avoiding the isotopic labeling, benefits from the higher chemical resolution and a more straightforward signal assignment. In contrast to 2H NMR, our results show that the structural information obtained in 13C spectra is not limited to the orientation of a single bond C-H vector. Coupling between remote 13C and 1H spins, as well as between 13C and 31P nuclei are also accessible. These solid-state NMR approaches are presently being utilized to understand the membrane interaction of a variety of molecules including antidepressants, dendrimers, proteins and polypeptides. As an application, the topology of an antidepressant molecule, desipramine, determined from these measurements is presented in this paper.
Experimental
Sample preparation
1,2-dimyristoyl-sn-glycero-3-phosphatidylcholine (DMPC) and 1,2-dihexanoyl-sn-glycero-3-phosphatidylcholine (DHPC) were purchased from Avanti Polar Lipids, Inc. (Alabaster, AL). DMPC and DHPC with a molar ratio (q=DMPC:DHPC) of 3.5:1 was dissolved in chloroform. The solvent was slowly evaporated under a stream of nitrogen gas at room temperature and completely removed by overnight lyophilization. A 100 mM HEPES buffer at pH 7.0 was added to obtain a concentration of 37.5% (w/w) phospholipids to solution. The sample was vortexed until all of the lipids were solubilized in the HEPES buffer. The solubilized sample was gently sonicated in an ice-cold water bath. The final sample was obtained by several freeze and thaw cycles until a clear transparent solution was formed. Bicelles containing desipramine were also prepared using the above-mentioned procedure.
NMR measurements
NMR experiments were carried out on a Chemagnetics/Varian Infinity-400 MHz solid-state NMR spectrometer using a 5 mm double-resonance magic-angle spinning probe under static sample conditions. About 100 mg of sample was loaded in a 5 mm NMR glass tube of 4 cm length and the tube was closed tightly with Teflon tape and a cap. The sample was equilibrated for about 1 hour in the magnet at 37°C prior to the measurement. 31P NMR spectra were recorded using Hahn-echo experiments with a 90° pulse length of 5 μs and under a 30 kHz continuous-wave proton decoupling. A ramped-cross-polarization (ramp-CP)47 sequence with a contact time of 5 ms was used to record the 1D 13C spectra under proton decoupling using various decoupling sequences for a comparative study, while the FLOPSY(flip-flop spectroscopy)-848 multiple pulse sequence was used in other experiments as it provided the best resolution. 2D 13C spectra were obtained using 128 t1 experiments, 64 scans, 5 s recycling delay, and a 20 kHz 1H decoupling. All measurements were performed at 37°C.
Results and Discussion
Orientation of bicelles in the magnetic field
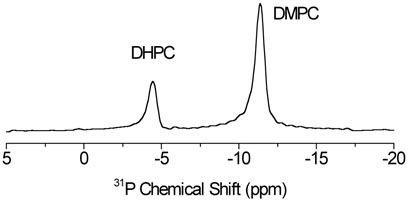
To obtain a highly resolved 13C NMR spectrum of stationary bicelles, it is essential to align the sample in the magnetic field of the spectrometer. The degree of alignment of bicelles was examined by recording the proton decoupled 31P chemical shift spectra. Figure 1 shows the 31P chemical shift spectrum of a 3.5:1 DMPC:DHPC bicelle sample at 37°C, referenced by setting the isotropic chemical shift peak observed at 10°C to 0 ppm. Two peaks in the spectrum are assigned to DMPC (−11.4 ppm) and DHPC (−4.4. ppm) molecules in the sample as indicated based on previous studies on bicelles30; the ratio of signal intensities equals the DMPC:DHPC molar ratio. The frequency position (–11.4 ppm) and a narrow linewidth (100 Hz) of the DMPC resonance in the spectrum suggest that the bicelle sample is well aligned with the bilayer normal (or the bicelle axis) perpendicular to the external magnetic field of the spectrometer.
Fig. 1.
31P NMR spectrum obtained by acquiring the FID after a 90° RF pulse in the presence of proton decoupling. 64 transients were accumulated. The chemical shift scale was referenced by setting the isotropic chemical shift peak observed at 10°C to 0 ppm.
Two-dimensional 13C separated-local-field experiments
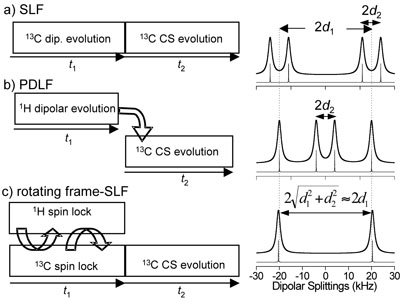
In the conventional SLF sequence,39 the 13C transverse magnetization evolves under multiple 1H–13C heteronuclear dipolar couplings during the evolution period t1 (Figure 2a). In the protondetected local field (PDLF) experiment,43 on the other hand, the 1H transverse magnetization evolves under the local field of 13C spins during t1 and is subsequently transferred to carbons for detection (Figure 2b). In the case of rare carbon-13 spins (spin S) coupled with abundant protons (spins I), the heteronuclear dipolar interaction term of the spin Hamiltonian can be written as
| (1) |
where is the dipolar coupling constant. Since the Hamiltonians for individual IS couplings commute, the time evolution of the transverse magnetization is calculated by successive action of individual dipolar coupling terms on the density operator.39 The structure of the modulation experienced by evolved spins is, however, different in conventional SLF and PDLF experiments. In the conventional SLF sequence, where an S spin evolves in the presence of local fields, the relevant term of the density operator contributing to the detected signal is given by
| (2) |
On the other hand, in the case of a PDLF experiment, where each evolving spin I(i) is subject to the evolution under the heteronuclear coupling to a single S spin, the relevant density operator has the form
| (3) |
Therefore, the dipolar coupling dimension of the conventional 2D SLF spectrum, where each additional proton contributes with a successive first-order splitting, has a more complicated multiplet-type structure. In contrast, the dipolar coupling dimension of the 2D PDLF spectrum is governed by a simple two-spin interaction and presents a superposition of dipolar coupling doublets.
Fig. 2.
Experimental protocols of 2D experiments used for the measurements of heteronuclear dipolar couplings and the corresponding simulated dipolar coupling spectra for a three spin system CH2 with dCH(1) = 20 kHz and dCH(2) = 4 kHz. (a) SLF; (b) PDLF; (c) Rotating-frame SLF.
In rotating-frame local field experiments (Figure 2c),12,38 the dipolar couplings are monitored through oscillations resulting from the coherent spin exchange in the rotating frame. In the presence of the spin-lock rf fields matched at the Hartmann-Hahn condition12,39 the heteronuclear dipolar coupling Hamiltonian is given by the flip-flop terms
| (4) |
The non-commuting nature of the individual terms in this Hamiltonian results in the truncation of small heteronuclear couplings and therefore the resolution of large dipolar coupling is enhanced.12 This effect is well demonstrated in experiments that employed rotating-frame local field pulse sequences like PISEMA,40 SAMMY,49 BB-PISEMA (i.e., broadband-PISEMA),50,51 PITANSEMA (Polarization Inversion Time Averaged Nutation Spin Exchange at the Magic Angle)52,53 and HIMSELF (heteronuclear isotropic mixing leading to spin exchange via the local field).54-56 Experimental and simulated results suggest that the dipolar coupling resolution in all these methods is comparable when there are only a few protons in a spin cluster.
Efficient homonuclear 1H decoupling during the evolution (or t1) period of an SLF sequence is important for an accurate measurement of heteronuclear dipolar couplings. The windowless sequences BLEW-n57, WIM (windowless isotropic mixing)-2458, LG (Lee-Goldburg)59, FFLG (Flip-Flop Lee-Goldburg60 or Frequency Switched Lee-Goldburg61) and magic echo sandwiches62 have been employed to achieve adequate resolution in the rotating-frame SLF experiments. The uses of FFLG decoupling and magic echo sandwiches were named as PISEMA40 and SAMMY41 respectively. Recently, WIM-2455 and BLEW-type54 sequences have also been introduced in such experiments. The unique feature of WIM and BLEW spin-locking is that they create an isotropic mixing dipolar coupling Hamiltonian, and therefore the corresponding 2D sequences are called HIMSELF.54-56
In a PDLF experiment, where each pair-wise 13C-1H spin interaction in a 13CHn spin system results in a separate doublet, the observed dipolar splitting Δv is related to the coupling constant d simply by Δv = 2kd; k = 0.42 is the scaling factor of the homonuclear decoupling sequence BLEW-48, this value was calibrated using a 2D 1H/13C HETCOR experiment and closely matched the theoretically predicted value of 0.424.39 Therefore, the measurement of heteronuclear dipolar couplings is straightforward using this 2D experiment. In contrast, in a 2D PISEMA spectrum, such a simple relationship holds only for the case of an isolated 13C-1H spin pair or for a CH2 group with two equivalent C-H dipolar couplings (scaling factors are, respectively, k = 0.79 and in the case of BB-PISEMA). Generally, for a CH2 spin system the two dipolar couplings are entangled in the spectral splitting, Δv = 2k(d12+d22)½, and cannot easily be extracted from PISEMA and other rotating-frame experiments. For a rapidly rotating CH3 methyl group, the theory predicts that the dipolar coupling PISEMA spectrum exhibits three different dipolar splittings: and . Numerical simulations performed using the SIMPSON program63 for a three spin H-C-H system are given in Figure 2. The dipolar coupling constants d1 = 20 and d2 = 4 kHz were used in the simulations. Increasing the number of remote protons deteriorates the resolution of large dipolar coupling spectral lines in the conventional SLF and to a less extent in rotating-frame SLF while it is essentially unaffected in PDLF.43,56,64 In the PDLF experiment, a short contact time of the CP step suppresses signal from weak dipolar couplings while a very long contact time could allow contributions from very remote spins which could result in doublets with very small splittings or an unresolved zero-frequency peak in the dipolar coupling spectrum. Therefore, a careful choice of contact time allows to maximize the resolution in the 2D PDLF spectrum.
2D 13C SLF spectra of oriented bicelles
In this section, we demonstrate and compare the 2D dipolar coupling spectra obtained using SLF, PDLF and PISEMA techniques. The details of the pulse sequences can be found elsewhere.12,39,40,43 For the PISEMA experiment the frequency offset-compensated modification of the basic sequence (called the broadband-PISEMA)50,51 was used to suppress the effects of the chemical shifts and the proton resonance frequency offsets.
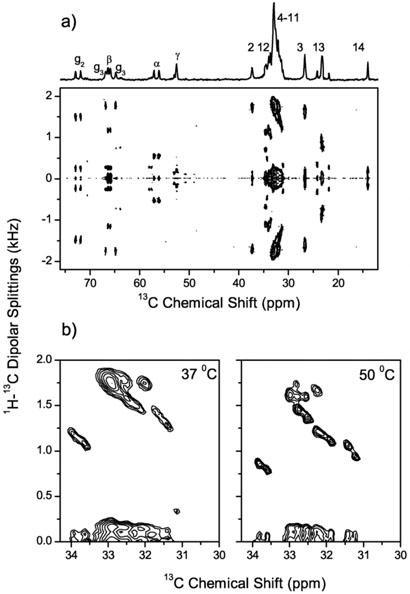
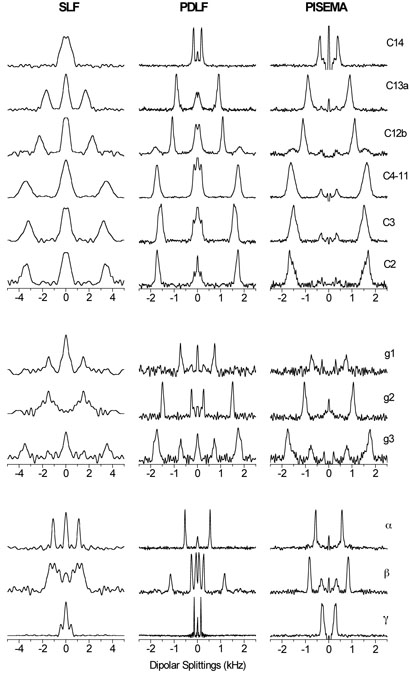
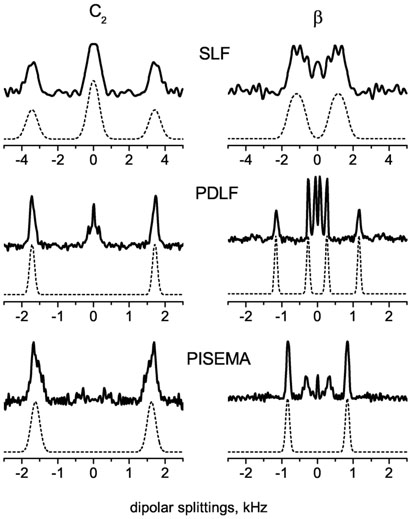
A 2D PDLF spectrum that correlates the 13C chemical shift and 1H-13C dipolar couplings is shown in Figure 3(a). Also shown is the 1D 13C chemical shift spectrum of DMPC/DHPC bicelles along with the assignment of peaks to DMPC carbons. The 2D spectrum exhibits highly resolved doublets in the indirect frequency dimension corresponding to the combined dipolar and scalar interactions between directly bonded 13C-1H spin pairs. A number of doublets with small splittings arising from dipolar couplings between remote spins are also seen in Figure 3(a). Some of the heavily overlapped signals in the chemical shift dimension, from C4 to C11 sites of acyl chains of DMPC, are resolved in the 2D spectrum. The resolution of this group is increased at a higher temperature as shown in Figure 3(b). Representative slices along the dipolar coupling dimension of the PDLF spectrum are displayed in Figure 4 (middle column). These spectral slices are compared with the corresponding slices obtained from conventional 2D SLF and PISEMA spectra. As expected, peaks in the conventional SLF spectrum are very broad. PDLF provides a resolution which is better than or comparable to PISEMA. The inner doublets with smaller splittings in the PDLF spectrum are due to couplings between remote spins. If assigned, these splittings could provide additional valuable structural constraints. The dipolar splitting values obtained from three different 2D experiments are, in general, in good agreement.
Fig. 3.
(a) A 2D PDLF spectrum of DMPC/DHPC bicelles at 37°C. 64 scans were accumulated for each of 200 points in the t1 dimension with an increment time of 384 μs. The contact time for the CP transfer was set to 3.0 ms. Proton RF field during the t1 evolution corresponded to 31 kHz. A 1D 13C chemical shift spectrum is shown at the top with assignments of peaks to individual carbons of the DMPC molecule. (b) Part of the PDLF spectrum in DMPC/DHPC bicelles at 50°C demonstrating the increased dipolar resolution in the crowded spectra range between 31 and 34 ppm. Corresponding part of the PDLF spectrum obtained at 37°C is also shown for comparison.
Fig. 4.
Representative slices along the dipolar coupling dimensions from SLF, PDLF and PISEMA spectra. Frequency axes were corrected for the respective dipolar scaling factors k = 0.42 (SLF and PDLF) and 0.79 (PISEMA).
Experimental dipolar coupling spectra were simulated using the SIMSON program. Simulated and experimental dipolar coupling spectra for C2 and β carbons of the DMPC molecule are given in Figure 5. Coupling constants used in the simulations are d1=d2=1.7 kHz for C2 and d1=1.15 and d2=0.26 kHz for β (as given in Table 1). For an easier comparison the frequency axes in the Figure were corrected with the scaling factor of the corresponding pulse sequence, 0.42 (for SLF and PDLF) and (for BB-PISEMA). Only couplings to directly bonded protons are accounted for in the simulations. All coupling constant d (d = [DCH+JCH/2]) values are given in Table 1; where JCH and DCH are the scalar coupling constant and motionally averaged dipolar coupling constant, respectively.
Fig. 5.
Simulated (dashed lines) and experimental (solid lines) 1H-13C dipolar coupling spectra corresponding to C2 and β carbons of the DMPC molecule obtained using SLF, PDLF and PISEMA pulse sequences. Only couplings to directly bonded protons are accounted for in the simulations. Frequency axes were corrected for the respective dipolar coupling scaling factors k = 0.42 (SLF and PDLF) and 0.79 (PISEMA).
Table 1.
1H-13C coupling constants(a) (given in kHz) measured from magnetically aligned DMPC:DHPC bicelles (q=3.5) at 37°C using different 2D solid-state NMR techniques. Full line width at half-maximum is given in parenthesis. Dipolar couplings measured using the PDLF technique from bicelles (q=3.5) containing 2 mole % and 10 mole % of desipramine are also given.
| Site |
SLFb) |
PDLFb) |
PISEMAc) |
Desipramine 2 mole % |
Desipramine 10 mole % |
|---|---|---|---|---|---|
| C14 | -- | 0.17(0.03) | -- | 0.13 | 0.13 |
| C13 | 0.85(0.20) | 0.91(0.06) | 0.90(0.10) | 0.66 | 0.68 |
| C12 | 1.14(0.30) | 1.08(0.05) | 1.11(0.10) | 1.00 | 0.93 |
| C4-11 | 1.73(0.40) | 1.73(0.10) | 1.63(0.16) | 1.52 | 1.63 |
| C3 | 1.61(0.40) | 1.59(0.10) | 1.53(0.15) | 1.51 | 1.61 |
| C2 | 1.72(0.30) | 1.73(0.07) | 1.67(0.15) | 1.67 | 1.81 |
| g1 | 0.74(0.20) | 0.72(0.05) | 0.76(0.08) | 0.69 | 0.79 |
| g2 | 1.50(0.25) | 1.50(0.05) | 1.48(0.08) | 1.49 | 1.62 |
| g3 | 1.77(0.30) | 1.75(0.10) | 1.77(0.10) | 1.68 | 1.77 |
| α | 0.55(0.10) | 0.54(0.02) | 0.56(0.03) | 0.43 | 0.35 |
| β | -- | 1.15/0.26 (0.05/0.03) |
1.19(0.06) | 1.19 | 1.28 |
| γ | 0.11(0.10) | 0.14(0.01) | -- | 0.15 | 0.17 |
absolute values of coupling constant |d| = |DCH+JCH/2], where JCH and DCH are the scalar coupling constant and motionally averaged dipolar coupling constant, respectively.
d = Δ /(2k), where Δ is the spectral splitting and k = 0.42 is the scaling factor of the BLEW48 sequence.
d = Δ / for CH2 methylenes (except β) and d = Δ / (2k) for the CH pair (g2 site) and for the β site, where Δ is the spectral splitting and k = 0.79 is the scaling factor for the BB-PISEMA pulse sequence.
Generally, C-H dipolar and scalar (or J) couplings are entangled in the observed splittings. The contribution from the J-coupling is significant for a directly bonded C-H spin pair, particularly in the highly mobile terminal groups of the lipid molecule. While the value and sign of J-coupling is known from other NMR studies, the ambiguity of extracting the dipolar coupling remains since the sign of the dipolar coupling term is generally not obvious. Geometry arguments can be invoked to solve this issue.65 In addition to 13C– 1H couplings, 13C– 31P dipolar couplings of phospholipids can be accurately measured from the 2D PDLF spectrum. Since different 13C– 31P multiplets, overlapped in a 1D 13C spectrum, are well separated in the 2D spectrum due to the difference in the 13C– 1H coupling values for different carbon sites, the resolution is increased and the peak assignment is straightforward. (Another way to separate the 13C– 31P multiplets is to perform the conventional 13C– 31P 2D separated local field experiment in the presence of proton heteronuclear decoupling.66 This, however, requires a 13C/31P/1H triple channel probe.)
For most of the CH2 sites, the spin couplings estimated from the splittings in PISEMA spectra under the assumption of equivalent dipolar couplings, d1=d2, are in agreement with those measured directly from PDLF spectra. An exception is, however, found in the case of the β–carbon coupling. This is because the specific average orientation of the βCH2 segment with respect to the main molecular rotational axis results in inequivalent 13C-1H dipolar couplings. From the two distinct doublets observed for this site in the PDLF spectrum, the spin couplings are estimated to be d1(PDLF) = 1.15 and d2(PDLF) = 0.26 kHz. Hence, the apparent coupling constant in the PISEMA experiment is calculated to be (d12+d22)½ = 1.18 kHz, which is consistent with that estimated from the experimental PISEMA splitting (see Table 1).
13C-31P and 1H-31P SLF
Other types of heteronuclear dipolar interactions, useful to quantify the order and conformation of the lipid headgroup and the glycerol moiety, are 13C-31P and 1H-31P dipolar couplings. Some of the 13C-31P dipolar splittings can be identified in the 1D 13C spectrum (see Fig. 3, 1D spectrum on the top). The splitting due to the 1H-31P dipolar interaction can be observed in a 2D experiment which correlates the 1H chemical shift and 1H-31P dipolar coupling evolution in the indirect dimension with the 13C chemical shift and 13C-31P dipolar coupling evolution in the direct dimension. The RF pulse sequence is obtained from the 2D PDLF sequence by removing the 1H refocusing pulse in the middle of the evolution period. Note that no irradiation at the 31P frequency is required in this experiment. Hence, a double resonance 1H-13C NMR probehead can be used. (The decoupling of 31P spins to remove the coupling to 31P nuclei during the evolution and/or detection period may be useful to assist the spectral assignment).
For a dipolar coupled heteronuclear three spin system I–S–K (proton, carbon-13, and phosphorus-31 spin, respectively), the spin interaction Hamiltonians effective during the evolution (t1) and detection periods (t2) of this pulse sequence are
| (5) |
and
| (6) |
respectively. Here, ωI and ωs denote the I and S spin chemical shift, and ωIK and ωSK are I-K and S-K dipolar coupling constants, respectively. (J-couplings can be accounted for as additive constants to ωIK and ωSK). During the I-S polarization transfer step, the spin-locked component Ix or Iy is transferred to Sx for subsequent detection. By performing the product operator calculation,39 the following observable time domain NMR signal is obtained
| (7) |
After a double Fourier transformation, a 2D spectrum results with two peaks at frequency coordinates (ωI+ωIK, ωS+ωSK) and (ωI−ωIK, ωS−ωSK). The projections on the ω1 and ω2 frequency axes correspond to I-K and S-K dipolar coupling spectra, respectively.
In addition to providing the information on the 1H-31P dipolar couplings, this experiment increases the resolution of 13C-31P dipolar splittings as compared to the 1D 13C experiment. This is because the different 13C-31P dipolar doublets overlapped in the 1D 13C spectrum are well separated in a 2D plane due to the difference in the chemical shifts of protons to which a particular carbon is correlated.
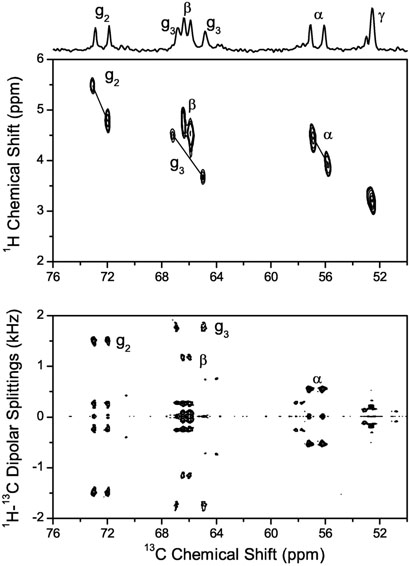
Part of the 2D 13C-1H-31P correlation spectrum shown in Figure 6 contains the resonances from the atoms in the headgroup and glycerol region. The 1H-31P couplings are easily recognized in the g2 and α signals, which appear as tilted doublets. This tilt arises from simultaneous splittings by 13C-31P and 1H-31P interactions along the horizontal (direct dimension) and vertical (indirect dimension) axes, respectively. Similar splittings for the g3 and β sites were assigned by comparison to the peaks in the PDLF spectrum. Since in the PDLF spectrum the 1H-31P couplings are refocused at the end of the evolution period by the 1H 180° pulse, both doublet peaks are located on the same horizontal line in the bottom spectrum of Figure 6. Experimentally measured dipolar couplings are given in Table 2.
Fig. 6.
Contour plot of the headgroup and glycerol region of the 2D 13C-1H correlation spectrum (top). The tilted dipolar doublets are indicated by solid lines. The doublets are due to 13C-31P and 1H-31P dipolar interactions resulting in splittings of the 13C-1H cross peaks along the horizontal axis and vertical axis, respectively. The experimental conditions are as mentioned for the PDLF spectrum in Fig. 3. Comparison to the 13C-1H PDLF spectrum (bottom) was used to assign the peaks.
Table 2.
13C-31P and 1H-31P dipolar couplings (given in Hz ± 10 Hz) measured from magnetically aligned DMPC:DHPC bicelles (q=3.5) at 37°C.
| carbon site |
pure bicelles |
2 mole % desipramine |
10 mole % desipramine |
|||
|
13C-31P |
1H-31P |
13C-31P |
1H-31P |
13C-31P |
1H-31P |
|
| g2 | 52 | 138 | 48 | 112 | 55 | 130 |
| g3 | 102 | 163 | 118 | 100 | 135 | 147 |
| α | 51 | 107 | 42 | 71 | 40 | 71 |
| β | 25 | 48 | 18 | 18 | 25 | 88 |
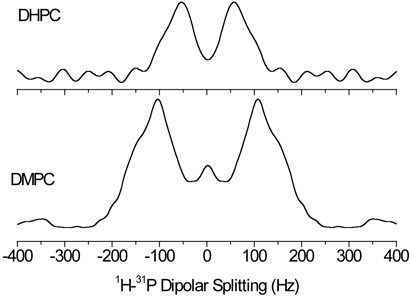
The 1H-31P dipolar couplings can also be measured in a more direct way by recording a 2D 31P-1H PDLF spectrum. We performed such an experiment and the dipolar coupling slices taken at the 31P resonances are shown in Figure 7. While the observed splitting for DMPC signal is generally consistent with the values given in Table 2, the lines in Figure 7 are broad and the individual dipolar coupling doublets are not resolved in contrast to the data from the 2D 13C-31P-1H experiment (Figure 6).
Fig. 7.
Cross sections from the 2D 31P-1H PDLF spectrum at the chemical shift of the 31P resonance in DMPC and DHPC molecules. 64 transients were accumulated for each of 32 points in the t1 dimension with an increment time of 2300 μs.
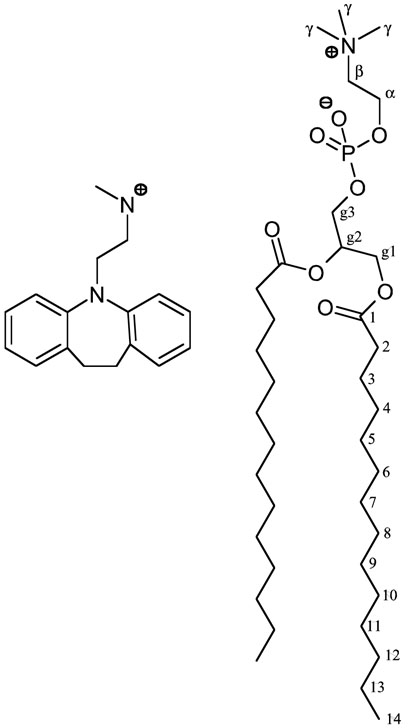
The location of a desipramine molecule relative to a DMPC lipid in bicelles. A change in the head group conformation of DMPC is also indicated. The relevant hydrogen atoms are included in the figure, while all other hydrogen atoms are not represented.
Topology of Desipramine
An antidepressant, desipramine, was introduced into bicelles in order to study its effect on the heteronuclear dipolar couplings investigated above. DMPC:DHPC (q = 3.5) bicelles containing 2 and 10 mole % of desipramine were prepared. 31P chemical shift spectra (data not shown) were used to judge the alignment of samples as mentioned earlier, which were found to be of comparably high quality. 2D PDLF experiments were performed on both desipramine:bicelle samples. The 2D data (spectra not shown) consisted of well-resolved peaks, which enabled the measurement of 1H- 13C dipolar coupling values for each carbon site; the values are given in Table 1. We have also performed similar experiments to understand the membrane interaction of polypeptides and proteins with bicelles (data not shown). The presence of desipramine or other molecules did not alter the line width of dipolar spectral lines suggesting that the pulse sequence performs well when bicelles contain ligands such as drugs, peptides and proteins. Therefore, this method provides a straightforward and highly informative way to investigate the effect that such ligands have on lipid bilayer properties.
The experimental data obtained from desipramine-doped bicelles (Table 1) consist of several interesting features that are worth noting. In the terminal carbons (C12, C13 and C14) of DMPC, the measured C-H dipolar coupling values decrease with the increasing desipramine concentration. The response from carbons 2 to 11 of DMPC, as well as from the glycerol backbone carbons (g1 and g3), is more complex. As a general trend, a slight decrease of dipolar couplings was observed in the sample with 2 mole % desipramine incorporated. In contrast, when the desipramine concentration was increased to 10 mole %, the 1H-13C dipolar couplings in this region generally are increased above the values observed in pure bicelles. In the choline headgroup region, the α carbon site shows a linear decrease of 1H-13C dipolar coupling, while the 13Cβ-1H dipolar coupling increases with the desipramine concentration. The γ position shows a very slight increase in dipolar coupling, analogous to the β position. The complex response of the upper acyl chain and the glycerol backbone regions of the DMPC bilayer to the incorporation of desipramine could be further confirmed by 13C-31P and 1H-31P SLF experimental results. The 13C-31P and 1H-31P dipolar coupling values measured from both desipramine:bicelle samples are given in Table 2. For none of the observable carbon sites (α, β, g2, g3) was a linear change of the dipolar splitting with the desipramine content observed.
The above-mentioned experimental findings can be rationalized as follows. The desipramine molecule consists of a hydrophobic tricyclic ‘core’ segment and an aliphatic ‘sidechain’ that carries a positive charge on a secondary amine (Figure 8). An incorporation of this molecule into lipid bilayers has to accommodate the amphiphilic properties of the molecule. Most likely, the bulky hydrophobic tricycle will partition into the hydrophobic portion of the lipid bilayer, while the hydrophobic polar sidechain will reach (or ‘snorkel’) into the hydrophilic headgroup region of lipids. An earlier 14N NMR study indeed found the desipramine molecule to be located near the headgroup region in lipid bilayers.67 Since the hydrophobic region of desipramine is bulky and rather short when compared to the DMPC molecule, such an arrangement in the interface between hydrophobic and hydrophilic bilayer regions will affect DMPC molecules in bilayers. Figure 8 shows both molecules in comparison; striking differences in their size and shape are evident. The presence of desipramine would most likely restrict DMPC molecules in their upper acyl chain and glycerol backbone regions, while the terminal segments of a DMPC molecule would experience a reduced steric hindrance resulting in an increased segmental mobility. These considerations are in full agreement with the experimental data reported in this study. An increase in the mobility in the terminal acyl chain carbons would result in decreased 1H-13C dipolar coupling values, as observed. A strong interaction of desipramine with the upper acyl chain and glycerol backbone carbons of DMPC is reflected in the non-monotonous response of the observed 1H-13C dipolar couplings (Table 1), as well as 13C-31P and 1H-31P dipolar couplings (Table 2), to desipramine content.
Fig. 8.
Molecular structures of desipramine (left) and DMPC (right).
In the headgroup region of DMPC, the observed 1H-13C dipolar couplings can be interpreted in terms of desipramine-induced changes in the headgroup dynamics and/or conformation. Any changes in the dynamics of the lipid headgroup would have the same effect on both α and β carbon sites, and the 1H-13C dipolar couplings at both sites would be expected to change in the same direction. Therefore, the measured counter-directional changes in the 1H-13C dipolar couplings at α and β carbon sites cannot be explained solely by the changes in the dynamics of the headgroup. On the other hand, these results can be explained in terms of a conformational change in the phosphocholine headgroup of DMPC. Previous NMR studies have shown that the addition of a cationic amphiphile to lipid bilayers can move the N+ end of the lipid's P−-N+ dipole toward the water phase of the bilayer, whereas an anionic amphiphile has the opposite effect.68-70 Since the desipramine sidechain is positively charged, it could repel the N+ end of the P−-N+ dipole vector that would move the dipole toward the water phase of the bilayer. This would alter the conformation of the phosphocholine headgroup of the DMPC molecule. This interpretation is in excellent agreement with a previous 14N NMR study that reported a significant reduction in the 14N quadrupole coupling due to the electrostatic interaction between the positively charged N-H group of the drug and the C=O and P-O- groups of the DMPC molecule.67 This interaction causes the lipid head group to move towards the water phase of bilayers, thereby increasing the symmetry at the 14N nucleus of the choline group and decreasing the quadrupolar interaction.67 In addition, our interpretation is in good agreement with previous 2H NMR studies that reported the effects of cations68 and cationic peptides70 on the conformation of the lipid headgroup.
Conclusions
Carbon-13 NMR spectroscopy of lipid bilayers, when applied as a 2D SLF experiment, provides a number of important advantages over the traditional 2H NMR approach. These include more straightforward signal assignment, accessibility of remote couplings and couplings to heterospins other than protons, and resolving the ambiguous splitting within the methylene groups. Thus, the information content in the 2D spectrum that is useful for structural studies is increased dramatically. Our results suggest that the 2D PDLF is the most efficient experiment on bicelles as compared to other separated local field techniques in terms of the resolution of the dipolar couplings. However, BB-PISEMA or HIMSELF sequences provided the best resolution in rigid solids. Since the spectral splitting in a spin cluster with multiple spin dipolar couplings behave distinctly in PDLF and PISEMA-type techniques, some ambiguity issues in assigning the dipolar doublets are resolved by comparing the data of these two experiments. Therefore, a combination of PDLF with one of the rotating-frame experiments like BB-PISEMA or HIMSELF is highly recommended. Our results also suggest that the 2D experiment can be used to measure the membrane interaction of ligands. Interestingly, this approach does not depend on the molecular size and therefore it should be useful in studying the interaction of membrane proteins with the lipid bilayer environment. This approach will also be applicable to study the structure of 13C or 15N-labeled proteins in bicelles. In particular, the laboratory-frame SLF experiment like PDLF and its variants will be valuable in determining the structure and dynamics of soluble domains, loop regions, and mobile parts of membrane proteins.
Acknowledgements
This research was supported by research funds from the National Institutes of Health (AI054515).
References
- 1.Gao FP, Cross TA. Genome Biol. 2005;6 doi: 10.1186/gb-2005-6-13-244. Art. No. 244. [DOI] [PMC free article] [PubMed] [Google Scholar]
- 2.Hwang PM, Kay LE. Methods Enzymol. 2005;394:335–50. doi: 10.1016/S0076-6879(05)94013-5. [DOI] [PubMed] [Google Scholar]
- 3.Tian CL, Karra MD, Ellis CD, Jacob J, Oxenoid K, Sonnichsen F, Sanders CR. Methods Enzymol. 2005;394:321–334. doi: 10.1016/S0076-6879(05)94012-3. [DOI] [PubMed] [Google Scholar]; Sanders CR, Sonnichsen F. Magn. Reson. Chem. 2006;44:24–40. doi: 10.1002/mrc.1816. [DOI] [PubMed] [Google Scholar]
- 4.Tian CL, Breyer RM, Kim HJ, Karra MD, Friedman DB, Karpay A, Sanders CR. J. Am. Chem. Soc. 2006;128:5300–5300. doi: 10.1021/ja051161b. [DOI] [PubMed] [Google Scholar]; Evanics F, Hwang PM, Cheng Y, Kay LE, Prosser RS. J. Am. Chem. Soc. 2006;128:8256–64. doi: 10.1021/ja0610075. [DOI] [PubMed] [Google Scholar]
- 5.Opella SJ, Marassi FM. Chem. Rev. 2004;104:3587–3606. doi: 10.1021/cr0304121. [DOI] [PMC free article] [PubMed] [Google Scholar]
- 6.Arora A, Tamm LK. Curr. Opin. Struct. Biol. 2001;11:540–7. doi: 10.1016/s0959-440x(00)00246-3. [DOI] [PubMed] [Google Scholar]; Cierpicki T, Liang B, Tamm LK, Bushweller JH. J. Am. Chem. Soc. 2006;128:6947–51. doi: 10.1021/ja0608343. [DOI] [PMC free article] [PubMed] [Google Scholar]
- 7.Fernandez C, Hilty C, Wider G, Guntert P, Wuthrich K. J. Mol. Biol. 2004;336:1211–21. doi: 10.1016/j.jmb.2003.09.014. [DOI] [PubMed] [Google Scholar]
- 8.Porcelli F, Buck-Koehntop BA, Thennarasu S, Ramamoorthy A, Veglia G. Biochemistry. 2006;45:5793–5799. doi: 10.1021/bi0601813. [DOI] [PubMed] [Google Scholar]
- 9.Porcelli F, Buck B, Lee DK, Hallock KJ, Ramamoorthy A, Veglia G. J. Biol. Chem. 2004;279:45815–45823. doi: 10.1074/jbc.M405454200. [DOI] [PMC free article] [PubMed] [Google Scholar]
- 10.Marassi FM, Opella SJ. J. Magn. Reson. 2000;144:150–155. doi: 10.1006/jmre.2000.2035. [DOI] [PMC free article] [PubMed] [Google Scholar]
- 11.Wang J, Denny J, Tian C, Kim S, Mo Y, Kovacs F, Song Z, Nishimura K, Gan Z, Fu R, Quine JR, Cross TA. J. Magn. Reson. 2000;144:162–167. doi: 10.1006/jmre.2000.2037. [DOI] [PubMed] [Google Scholar]
- 12.Ramamoorthy A, Wei Y, Lee DK. Annu. Rep. NMR Spectrosc. 2004;52:1–52. [Google Scholar]
- 13.De Angelis AA, Nevzorov AA, Park SH, Howell SC, Mrse AA, Opella SJ. J. Am. Chem. Soc. 2004;126:15340–15341. doi: 10.1021/ja045631y. [DOI] [PubMed] [Google Scholar]
- 14.Kamihira M, Vosegaard T, Mason AJ, Straus SK, Nielsen NC, Watts A. J. Struct. Biol. 2005;149:7–16. doi: 10.1016/j.jsb.2004.10.002. [DOI] [PubMed] [Google Scholar]
- 15.Crocker E, Eilers M, Ahuja S, Hornak V, Hirshfeld A, Sheves M, Smith SO. J. Mol. Biol. 2006;357:163–172. doi: 10.1016/j.jmb.2005.12.046. [DOI] [PubMed] [Google Scholar]
- 16.Yamamoto K, Tuzi S, Saito H, Kawamura I, Naito A. Biochim. Biophys. Acta. 2006;1758:181–189. doi: 10.1016/j.bbamem.2006.01.021. [DOI] [PubMed] [Google Scholar]
- 17.Yao XL, Hong M. Biochemistry. 2006;45:289–295. doi: 10.1021/bi051540h. [DOI] [PubMed] [Google Scholar]
- 18.Lange A, Giller K, Hornig S, Martin-Eauclaire MF, Pongs O, Becker S, Baldus M. Nature. 2006;440:959–962. doi: 10.1038/nature04649. [DOI] [PubMed] [Google Scholar]; Andronesi OC, Becker S, Seidel K, Heise H, Young HS, Baldus M. J. Am. Chem. Soc. 2005;127:12965–12974. doi: 10.1021/ja0530164. [DOI] [PubMed] [Google Scholar]; Baldus M. In: NMR spectroscopy of biological solids. Ramamoorthy A, editor. Taylor & Francis; New York: 2006. pp. 39–56. [Google Scholar]
- 19.Todokoro Y, Yumen I, Fukushima K, Kang SW, Park JS, Kohno T, Wakamatsu K, Akutsu H, Fujiwara T. Biophys J. 2006;91:1368–1379. doi: 10.1529/biophysj.106.082735. [DOI] [PMC free article] [PubMed] [Google Scholar]
- 20.Luca S, Heise H, Baldus M. Acc. Chem. Res. 2003;36:858–865. doi: 10.1021/ar020232y. [DOI] [PubMed] [Google Scholar]
- 21.Hallock KJ, Lee DK, Ramamoorthy A. Biophys. J. 2003;84:3052–3060. doi: 10.1016/S0006-3495(03)70031-9. [DOI] [PMC free article] [PubMed] [Google Scholar]
- 22.Henzler-Wildman KA, Martinez GV, Brown MF, Ramamoorthy A. Biochemistry. 2004;43:8459–8469. doi: 10.1021/bi036284s. [DOI] [PubMed] [Google Scholar]
- 23.Hallock KJ, Henzler-Wildman KA, Lee DK, Ramamoorthy A. Biophys. J. 2002;82:2499–2503. doi: 10.1016/S0006-3495(02)75592-6. [DOI] [PMC free article] [PubMed] [Google Scholar]
- 24.Strandberg E, Ulrich AS. Concep. Magn. Reson. 2004;23:89–120. [Google Scholar]
- 25.Hallock KJ, Lee DK, Omnaas J, Mosberg HI, Ramamoorthy A. Biophys. J. 2002;83:1004–1013. doi: 10.1016/S0006-3495(02)75226-0. [DOI] [PMC free article] [PubMed] [Google Scholar]
- 26.Henzler-Wildman KA, Lee DK, Ramamoorthy A. Biochemistry. 2003;42:6545–6558. doi: 10.1021/bi0273563. [DOI] [PubMed] [Google Scholar]
- 27.Park SH, Prytulla S, De Angelis AA, Brown JM, Kiefer H, Opella SJ. J. Am. Chem. Soc. 2006;128:7402–7403. doi: 10.1021/ja0606632. [DOI] [PMC free article] [PubMed] [Google Scholar]
- 28.Sanders CR, Prestegard JH. Biophys. J. 1990;58:447. doi: 10.1016/S0006-3495(90)82390-0. [DOI] [PMC free article] [PubMed] [Google Scholar]
- 29.Sanders CR, Schwonek JP. Biochemistry. 1992;31:8898. doi: 10.1021/bi00152a029. [DOI] [PubMed] [Google Scholar]
- 30.Sanders CR, Hare BJ, Howard KP, Prestegard JH. Prog. Nucl. Magn. Reson. Spectrosc. 1994;26:421. [Google Scholar]
- 31.Howard KP, Opella SJ. J. Magn. Reson. B. 1996;112:91–4. doi: 10.1006/jmrb.1996.0116. [DOI] [PubMed] [Google Scholar]
- 32.Sanders CR, Prosser RS. Structure. 1998;6:1227–1234. doi: 10.1016/s0969-2126(98)00123-3. [DOI] [PubMed] [Google Scholar]
- 33.Cardon TB, Dave PC, Lorigan GA. Langmuir. 2005;21:4291–4298. doi: 10.1021/la0473005. [DOI] [PubMed] [Google Scholar]
- 34.Minto RE, Adhikari PR, Lorigan GA. Chem. Phys. Lipids. 2004;132:55–64. doi: 10.1016/j.chemphyslip.2004.09.005. [DOI] [PubMed] [Google Scholar]
- 35.Gaemers S, Bax A. J. Am. Chem. Soc. 2001;123:12343. doi: 10.1021/ja011967l. [DOI] [PubMed] [Google Scholar]
- 36.Lu JX, Damodaran K, Lorigan GA. J. Magn. Reson. 2006;178:283–287. doi: 10.1016/j.jmr.2005.09.006. [DOI] [PubMed] [Google Scholar]
- 37.Dvinskikh S, Dürr U, Yamamoto K, Ramamoorthy A. J. Am. Chem. Soc. 2006;128:6326–6327. doi: 10.1021/ja061153a. [DOI] [PMC free article] [PubMed] [Google Scholar]
- 38.Hester RK, Ackerman JL, Neff BL, Waugh JS. Phys. Rev. Lett. 1976;36:1081. [Google Scholar]
- 39.Schmidt-Rohr K, Spiess HW. Multidimensional Solid-state NMR and Polymers. Academic Press; San Diego: 1994. [Google Scholar]
- 40.Wu CH, Ramamoorthy A, Opella SJ. J. Magn. Reson. Ser. A. 1994;109:270. [Google Scholar]
- 41.Ramamoorthy A, Opella SJ. Solid state NMR Spectrosc. 1995;4:387. doi: 10.1016/0926-2040(95)00054-t. [DOI] [PubMed] [Google Scholar]
- 42.Ramamoorthy A, Wu CH, Opella SJ. J. Magn. Reson. 1999;140:131. doi: 10.1006/jmre.1999.1827. [DOI] [PubMed] [Google Scholar]
- 43.Schmidt-Rohr K, Nanz D, Emsley L, Pines A. J. Phys. Chem. 1994;98:6668–6670. [Google Scholar]; Hong M, Pines A, Caldarelli S. J. Phys. Chem. 1996;100:14815. [Google Scholar]
- 44.Seelig J. Q. Rev. Biophys. 1977;10:353. doi: 10.1017/s0033583500002948. [DOI] [PubMed] [Google Scholar]
- 45.Kumashiro KK, Schmidt-Rohr K, Murphy OJ, Ouellette KL, Cramer WA, Thompson LK. J. Am. Chem. Soc. 1998;120:5043–5051. [Google Scholar]
- 46.Gallagher GJ, Hong M, Thompson LK. Biochemistry. 2004;43:7899–7906. doi: 10.1021/bi0356101. [DOI] [PubMed] [Google Scholar]
- 47.Metz G, Wu XL, Smith SO. J. Magn. Reson. Ser. A. 1994;110:219–227. [Google Scholar]
- 48.Kadkhodaie M, Rivas O, Tan M, Mohebbi A, Shaka AJ. J. Magn. Reson. 1991;91:437–4349. [Google Scholar]
- 49.Nevzorov AA, Opella SJ. J. Magn. Reson. 2003;164:182. doi: 10.1016/s1090-7807(03)00240-4. [DOI] [PubMed] [Google Scholar]
- 50.Yamamoto K, Lee DK, Ramamoorthy A. Chem. Phys. Lett. 2005;407:289–293. doi: 10.1016/j.cplett.2005.04.017. [DOI] [PMC free article] [PubMed] [Google Scholar]
- 51.Dvinskikh SV, Sandström D. J. Magn. Reson. 2005;175:163. doi: 10.1016/j.jmr.2005.03.016. [DOI] [PubMed] [Google Scholar]
- 52.Lee DK, Narasimhaswamy T, Ramamoorthy A. Chem. Phys. Lett. 2004;399:359–362. [Google Scholar]
- 53.Yamamoto K, Ermakov VL, Lee DK, Ramamoorthy A. Chem. Phys. Lett. 2005;408:118–122. doi: 10.1016/j.cplett.2005.04.017. [DOI] [PMC free article] [PubMed] [Google Scholar]
- 54.Dvinskikh SV, Yamamoto K, Ramamoorthy A. Chem. Phys. Lett. 2006;419:168. [Google Scholar]
- 55.Yamamoto K, Dvinskikh SV, Ramamoorthy A. Chem. Phys. Lett. 2006;419:533. [Google Scholar]
- 56.Dvinskikh SV, Yamamoto K, Ramamoorthy A. J. Chem. Phys. 2006;125:034507. doi: 10.1063/1.2212939. [DOI] [PubMed] [Google Scholar]
- 57.Burum DP, Linder M, Ernst RR. J. Magn. Reson. 1981;44:173. [Google Scholar]
- 58.Caravatti P, Braunschweiler L, Ernst RR. Chem. Phys. Lett. 1983;100:305. [Google Scholar]
- 59.Lee M, Goldburg WI. Phys. Rev. A. 1965;140:1261. [Google Scholar]
- 60.Mehring M, Waugh JS. Phys. Rev. B. 1972;5:3459. [Google Scholar]
- 61.Bielecki A, Kolbert AC, de Groot HJM, Griffin RG, Levitt MH. Adv. Magn. Reson. 1990;14:111. [Google Scholar]
- 62.Takegoshi K, Mcdowell CA. Chem. Phys. Lett. 1985;116:100. [Google Scholar]
- 63.Bak M, Rasmussen JT, Nielsen NC. J. Magn. Reson. 2000;147:296. doi: 10.1006/jmre.2000.2179. [DOI] [PubMed] [Google Scholar]
- 64.Dvinskikh SV, Sandström D, Zimmermann H, Maliniak A. Chem.Phys Lett. 2003;382:410–417. [Google Scholar]
- 65.Hong M, Schmidt-Rohr K, Pines A. J. Am. Chem. Soc. 1995;117:3310. [Google Scholar]
- 66.Hong M, Schmidt-Rohr K, Nanz D. Biophys. J. 1995;69:1939. doi: 10.1016/S0006-3495(95)80064-0. [DOI] [PMC free article] [PubMed] [Google Scholar]
- 67.Santos JS, Lee DK, Ramamoorthy A. Magn. Reson. Chem. 2004;42:105–114. doi: 10.1002/mrc.1327. [DOI] [PubMed] [Google Scholar]
- 68.Scherer PG, Seelig J. Biochemistry. 1989;28:7720–7728. doi: 10.1021/bi00445a030. [DOI] [PubMed] [Google Scholar]
- 69.Semchyschyn DJ, MacDonald PM. Magn. Reson. Chem. 2004;42:89–104. doi: 10.1002/mrc.1333. [DOI] [PubMed] [Google Scholar]
- 70.Porcelli F, Buck B, Lee DK, Hallock KJ, Ramamoorthy A, Veglia G. J. Biol. Chem. 2004;279:45815–45823. doi: 10.1074/jbc.M405454200. [DOI] [PMC free article] [PubMed] [Google Scholar]


