

Abstract
The kinetic mechanism of homoisocitrate dehydrogenase from Saccharomyces cerevisiae was determined using initial velocity studies in the absence and presence of product and dead-end inhibitors in both reaction directions. Data suggest a steady state random kinetic mechanism. The dissociation constant of the Mg-homoisocitrate complex (MgHIc) was estimated as 11 ± 2 mM as measured using Mg2+ as a shift reagent. Initial velocity data indicate the MgHIc complex is the reactant in the direction of oxidative decarboxylation, while in the reverse reaction direction, the enzyme likely binds uncomplexed Mg2+ and α-ketoadipate. Curvature is observed in the double reciprocal plots for product inhibition by NADH and the dead-end inhibition by 3-acetylpyridine adenine dinucleotide phosphate when MgHIc is the varied substrate. At low concentrations of MgHIc, the inhibition by both nucleotides is competitive, but as the MgHIc concentration increases the inhibition changes to uncompetitive consistent with a steady state random mechanism with preferred binding of MgHIc before NAD. Release of product is preferred and ordered with respect to CO2, α-ketoadipate and NADH. Isocitrate is a slow substrate with a rate of V/Et 216-fold lower than that measured with HIc. In contrast to HIc, the uncomplexed form of isocitrate and Mg2+ bind to enzyme. The kinetic mechanism in the direction of oxidative decarboxylation of isocitrate, on the basis of initial velocity studies in the absence and presence of dead-end inhibitors, suggests random addition of NAD and isocitrate with Mg2+ binding before isocitrate in rapid equilibrium, and the mechanism approximates rapid equilibrium random. The Keq for the overall reaction measured directly using the change in NADH as a probe is 0.45 M.
Homoisocitrate dehydrogenase (3-carboxy-2-hydroxyadipate dehydrogenase; EC 1.1.1.87) (HIcDH)1 catalyzes the fourth reaction of the α–aminoadipate pathway (AAA) for lysine synthesis, the NAD-dependent conversion of homoisocitrate to α–ketoadipate (α-Ka) (Scheme 1) (1). Among the 20 common proteinogenic amino acids, lysine is the only one known to have two diverse pathways for its synthesis (2). In bacteria, plants and lower fungi such as phycomycetes or algal fungi, lysine is synthesized via the diaminopimelate pathway, beginning with the phosphorylation of aspartate by aspartokinase. However, it is synthesized via the α–aminoadipate pathway in euglenoids and higher fungi such as Saccharomyces cerevisiae, and human pathogenic fungi such as Candida albicans, Cryptococcus neoformas, and Aspergillus fumigatus and plant pathogens like Magnaporthe grisea use this pathway (2,3,4). The uniqueness of the α–aminoadipate pathway makes it a potential target for new antifungal drugs (5).
Scheme 1.

The reaction catalyzed by HIcDH.
HIcDH is a member of the family of pyridine nucleotide-dependent β–hydroxyacid oxidative decarboxylases which includes, among others, ICDH, IPMDH, malic enzyme, TDH, and 6-PGDH. The reactions catalyzed by these enzymes are essentially equivalent (6). With the exception of 6-PGDH which is metal-ion independent, all of the enzymes require a divalent metal ion activator. The NAD-specific ICDH selectively binds the Mn-isocitrate chelate complex where Mn2+ is coordinated to the α–hydroxyl and α–carboxylate of threo-Ds isocitrate (7). NAD-Malic enzyme and IPMDH bind the uncomplexed forms of the metal ion and substrate (8,9). In general, the overall kinetic mechanism of the enzymes that have been studied in detail are random; enzymes include the NAD-malic enzyme from Ascaris suum (9,10), the NADP malic enzyme from chicken liver (11), the NADP-dependent ICDH from pig heart (12,13) and Escherichia coli (14), 6-PGDH from Candida utilis (15) and sheep liver (16), IPMDH from Thermus thermophilus (8), and TDH from Pseudomonas putida (17). With the exception of 6-PGDH, which has a rapid equilibrium random kinetic mechanism, all have a steady-state random kinetic mechanism. In the case of HIcDH, the reported Km values for homoisocitrate and NAD are 10 μM and 0.33 mM, and the enzyme has a pH optimum of about 8.5 in the direction of oxidative decarboxylation of homoisocitrate, and about 7.0 in the direction of reductive carboxylation of α-Ka (2). Nothing is known of the mechanism of this enzyme.
In this paper, we use initial velocity studies in the absence and presence of product and dead-end inhibitors to elucidate the overall kinetic mechanism of HIcDH from Saccharomyces cerevisiae. Data are also used to estimate the equilibrium constant using the Haldane relationship, which is compared to the value obtained directly. The kinetic mechanism for the slow substrate, isocitrate, has also been studied, and compared with that using homoisocitrate (HIc).
MATERIALS AND METHODS
Chemicals
Isocitrate, citrate, oxalate, and 3-AcPyADP were obtained from Sigma. β–NADH, β-NAD, LB broth, and LB agar were purchased from USB. The nickel-nitrilotriacetic acid (Ni-NTA) agarose resin was from Qiagen. Isopropyl β-D-thiogalactopyranoside (IPTG), NdeI, XhoI, Turbo Pfu polymerase, and T4 DNA ligase were from Invitrogen. Ampicillin was from Fisher Biotech, and Hepes was from Research Organics. Homoisocitrate was the generous gift of Dr. David R. J. Palmer (University of Saskatchewan, Canada).
α-Ketoadipate was prepared according to a published procedure (18). The Claisen condensation of diethyl glutarate with diethyl oxalate gave a 67% yield of ethyl α-oxalylglutarate, which was treated with conc. hydrochloride acid to obtain α-Ka in 71% yield. The melting point of the final α-Ka product was 120−124°C. Data from 1H NMR (300 MHz) in acetone d6 gave the following δ values in ppm: 1.88 (p, J = 7.5 Hz, 2H, C(4)-H2), 2.39 (t, J = 7.5Hz, 2H, C(5)-H2), 2.98 (t, J = 7.5 Hz, 2H, C(3)-H2), 10.8 (bs, COOH); 13C (75.5 MHz, CDCl3) gave 195.9 (C2), 174.6 (C6), 162.2 (C1), 38.2 (C3), 32.9 (C5), 19.0 (C4).
Molecular Cloning, Cell Growth, and Protein Expression
Two primers, 5-GGACTCCCATATGTTAGATCTGTTGCTACTAG-3 and 5-CCGCTCGAGCTTCTAT AATCTCGACAAAACGTCG-3, were designed for PCR to obtain a DNA fragment corresponding to the Lys 12 gene encoding HIcDH from S. cerevesiae. The first primer introduced an NdeI restriction site (underlined), while the second one introduced an XhoI restriction site. An 1116 bp fragment was amplified by PCR using yeast genomic DNA as the template via the following protocol: one cycle of initial denaturation at 95°C for 4 min, followed by 45 cycles of denaturation at 95°C for 1 min, annealing at 60°C for 1 min, and extension at 72°C for 1 min 30 s, followed by one cycle of extension at 72°C for 10 min. The enzyme used was Pfu polymerase, which produces blunt end PCR products. The amplified DNA fragment was digested with NdeI and XhoI restriction endonucleases and subcloned into the similarly digested pET16b vector which adds a 10 His-tag to the N-terminal end of the protein. The sequence of the cloned gene was confirmed by DNA sequencing carried out by the Laboratory for Genomics and Bioinformatics of the University of Oklahoma Health Sciences Center in Oklahoma City. The plasmid was used to transform E. coli BL21*DE3 or BL21*DE3 RIL competent cells, which were grown in LB medium at 25°C, with gentle shaking until the OD reached ∼0.6. IPTG was added to a concentration of 1 mM and after a 5 h induction period the cells were harvested by centrifugation at 4,500 g. Cells were then lysed in extraction buffer (20 mM Tris-HCl, 500 mM NaCl, 10 mM MgCl2, 2 mM β–ME, pH 7.5) by sonication on ice using a MISONIX Sonicator XL for 5 minutes (15 s pulse followed by 15 s rest). The cell extract was loaded onto a 5.5 × 2 cm Ni-NTA column equilibrated with 20 mM Tris-HCl, 500 mM NaCl, 10 mM MgCl2, 2 mM β–ME, pH 7.5. The same buffer containing imidazole at concentrations of 20, 30, 90, 120, 150, 200, 300, and 500 mM was then used to elute the enzyme. The HIcDH eluted at 150−200 mM imidazole. The enzyme solution was maintained at −80°C in the elution buffer with 10% glycerol.
Enzyme Assay
The reaction was followed by measuring the appearance or disappearance of NADH at 340 nm (ε = 6,220 M−1cm−1) using a Beckman DU 640 spectrophotometer. All assays were carried out at 25°C and the temperature was maintained with a Neslab RTE-111 circulating water bath. A unit of enzyme activity is defined as the amount of enzyme catalyzing the production or utilization of 1 μmole of NADH per min at 25°C.
In the direction of oxidative decarboxylation of HIc (forward reaction), rate measurements were carried out in 0.5 mL of 50 mM Hepes, pH 7.5. Reactions were initiated by addition of 5 μL of an appropriately diluted enzyme solution to a mixture that contained all other reaction components, and the initial linear portion of the time course was used to calculate the initial velocity. Since the diluted enzyme solution (protein concentration of about 150 μg/mL) is not stable when kept on ice for about half a day, it was prepared fresh daily. In the direction of reductive carboxylation of α-Ka (reverse reaction), rate measurements were carried out in 0.5 mL of 1 M Hepes, pH 7.0. The reactions were initiated by adding 5 μL of enzyme solution (protein concentration of about 1.5 mg/mL). With isocitrate used as a substrate, reactions were initiated by adding 50 μL of enzyme solution (protein concentration of about 1.5 mg/mL), and all other conditions are as for assays with HIc.
Determination of the Mg-HIc Dissociation Constant by 1H NMR
The dissociation constant of the Mg-HIc chelate complex was determined by 1H-NMR using Mg2+ as a shift reagent. A solution in D2O of 10 mM HIc at pD 7.7 was prepared. Different concentrations of MgSO4 (0, 5, 10, 50, 100, 200, 300, 500 mM) were added to the HIc solution. All NMR experiments were performed on a Varian Mercury VX-300 MHz spectrometer with a Varian 4-nuclei auto-switchable PFG probe. 1H NMR spectra were collected using the PRESAT pulse sequence supplied by Varian Inc. The spectra were collected with a sweep width of 4803.1 Hz and 16 transients.
1H NMR referenced to HDO (4.68 ppm) and collected at pH 7 and 21°C with no added Mg2+ gave δ 3.82 (d, 1H, C(2)-H), δ 2.31 (dd, 1H, C(3)-H), δ 2.03 (t, 2H, C(5)-H2), δ 1.61 (m, 2H, C(4)-H2). As Mg2+ was added, the resonance at 3.8 ppm (reflecting C(2)-H) of HIc showed the biggest shift, as expected. The Mg2+-dependence of the change in chemical shift was fitted using eq. 1 to estimate the Kd.
| (1) |
In eq. 1, y is the chemical shift change, x is Mg2+ concentration, and ymax is the maximum chemical shift change.
Initial Velocity Studies
Systematic Analysis
In the direction of α-Ka formation, the initial rate was measured as a function of NAD concentration (0.2, 0.3, 0.5, and 2 mM) at different fixed concentrations of HIc (15, 30, 50, and 150 μM) and a fixed concentration of MgCl2 (0.5 mM). The experiment was then repeated at several additional MgCl2 concentrations (1, 2, and 5 mM). Once it was determined that MgHIc is the substrate, initial rate studies were carried out using varying concentration of MgHIc at different fixed levels of NAD.
Initial velocity studies were also carried out in the direction of reductive carboxylation of α-Ka. In this case, the initial rate was measured as a function of α-Ka (2.5, 5, 10, and 25 mM) at different fixed levels of NADH (0.025, 0.05, 0.1, and 0.2 mM) and fixed concentrations of CO2 (4 mM) and MgCl2 (20 mM). The experiment was then repeated at several additional CO2 concentrations (10, 20, and 45 mM). CO2 was added as NaHCO3, and its concentration was calculated using the Henderson-Hasselbalch equation and a pK of 6.1 for H2CO3.
With isocitrate as the substrate the initial rate was measured as a function of NAD concentration (2, 5, 10, and 20 mM), and at different fixed concentrations of isocitrate (1, 2, 5, and 10 mM) and a fixed concentrations of MgCl2 (0.5 mM). The experiment was then repeated at several additional MgCl2 concentrations (1, 2, and 5 mM).
Pair-wise Analysis
Initial velocities were measured at varying concentrations of one substrate at different fixed concentrations of a second, and with the third substrate saturating. For the reaction in the direction of reductive carboxylation of α-Ka, the initial rate was measured as a function of α-Ka at several fixed levels of CO2 (4, 8, 15, and 45 mM) and with NADH fixed at 0.8 mM (10 Km). Because of the high absorbance at 340 nm, data were collected at 363 nm using an ε363 of 3.11 mM−1cm−1. The rate was also measured as a function of CO2 at several fixed levels of NADH (0.025, 0.05, 0.1, and 0.2 mM) and with α-Ka fixed at 60 mM (20 Km). In all case the Mg2+ concentration was maintained at 20 mM.
Similar experiments were carried out for the isocitrate reaction. For example, the initial rate was measured as a function of isocitrate at several fixed levels of Mg2+ (0.5, 1, 2, and 5 mM) and with NAD saturating (20 Km). For the Mg2+/NAD pair was 20 mM (10 Km).
Product and Dead-end Inhibition Studies
Initial velocity patterns were obtained by measuring the initial rate at different concentrations of one reactant, with the concentration of the other reactants fixed at their respective Km values, and at different fixed concentrations of the inhibitor including zero. In all cases, an initial estimate of the Ki for the inhibitor was obtained by fixing the varied substrate at its Km value and varying the inhibitor concentration. The appKi was initially estimated by Dixon analysis, a plot of 1/v vs. I, with all reactants equal to their Km, extrapolating to 1/v equal to zero, and dividing the value of I by 2.
Data Analysis
Initial velocity data were first analyzed graphically using double-reciprocal plots of initial velocity versus substrate concentration and suitable secondary plots. Data were then fitted using the appropriate equation, and the Marquardt-Levenberg algorithm supplied with the EnzFitter program from BIOSOFT, Cambridge, U.K. Kinetic parameters and their corresponding standard errors were estimated using a simple weighting method.
Data obtained from the systematic analysis for the reaction using MgHIc as a substrate were fitted using eq 2. For the reaction using isocitrate as a substrate, data were fitted using eqs. 3 and 4 for a terreactant kinetic mechanism (see Results and Discussion). For the reverse of the HIc reaction, data were fitted using eqs. 3 and 5 for a terreactant kinetic mechanism. For the data sets obtained from a pair-wise analysis for the isocitrate reaction and two data sets for the reverse reaction using α-Ka as the substrate were fitted using either eq. 2 for a sequential mechanism, eq. 6 for an equilibrium ordered mechanism, or eq. 7, with the constant term absent. Data conforming to competitive, noncompetitive, or uncompetitive inhibition were fitted using eqs. 8-10. Data obtained for oxalate inhibition against HIc or NAD were fitted using eq. 11.
| (2) |
| (3) |
| (4) |
| (5) |
| (6) |
| (7) |
| (8) |
| (9) |
| (10) |
| (11) |
In eqs 2-11, v and V are initial and maximum velocities, A, B, and C are substrates concentrations, I is inhibitor concentration, Ka, Kb, and Kc are Michaelis constants for substrates A, B, and C, respectively. In eq. 2, Kia is the dissociation constant of A from the EA complex. In eqs 3-5, the coef terms are products of kinetic constants that are mechanism dependent (see Discussion). In eqs 8-10, Kis and Kii represent inhibition constants for slope and intercept, respectively. In eq. 11, Ki is the dissociation constant for oxalate from the E:oxalate, and from E:(oxalate)2 complex, Kium is the dissociation constant for oxalate binding to E:NADH product, while Kidenum is a constant that contributes to the hyperbolic nature of intercept effect, and all the other terms are the same as defined above.
Determination of Keq and the Haldane Relationship for the Reaction Using HIc as Substrate
In a 500 μL reaction, the concentrations of HIc, NAD, NADH, CO2, and MgCl2 were fixed at 0.05 mM, 0.01 mM, 0.2 mM, 0.5 mM, and 10 mM, respectively, and the concentration of α-Ka was varied over the range 0.1−5 mM. Reaction was initiated by the addition of enzyme. The difference in A340 representing displacement from equilibrium was plotted against the α-Ka concentration. The Keq is obtained using the concentrations given above and the concentration of α-Ka that gave a ΔA340 of zero according to eq. 12.
| (12) |
The Keq was also estimated from one of the Haldane relationships for a Bi-Ter kinetic mechanism according eq. 13.
| (13) |
RESULTS
Protein Expression, and Purification
The HIcDH is eluted from the Ni-NTA column most efficiently with 150−200 mM imidazole, and the purity of the eluted HIcDH is about 98% as judged by SDS PAGE. About 2.5 mg of enzyme is obtained per g wet cell paste. His-tagged HIcDH is stored with 10% glycerol at −80°C in elution buffer. The protein is stable under these conditions for more than 1 month.
Determination of the Mg-HIc Dissociation Constant by 1H NMR
The chemical shift at 3.8 ppm (reflecting C(2)-H) showed the biggest shift with increasing Mg2+ concentration as expected since it is alpha to one of the coordination positions for Mg2+. A plot of the change in chemical shift vs. Mg2+ concentration was used to estimate a Kd of 11 ± 2 mM for the Mg-HIc complex (Fig. 1).
Figure 1.
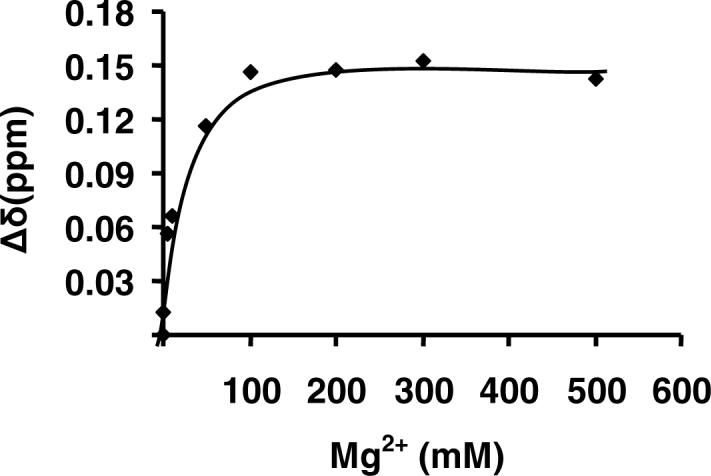
Determination of the metal-chelate dissociation constant for Mg-HIc. The difference in the chemical shift change of the peak at 3.8 ppm (C2 of HIc) from the 1H NMR spectra is plotted against Mg2+ concentration. The points are experimental, while the solid line is theoretical based on a fit to equation 1.
Determination of the True Substrate in the Both Reaction Directions
Since HIcDH requires a divalent metal ion for activity, it is important to determine whether uncomplexed metal and reactant or the metal-reactant chelate complex is the true substrate. In the direction of reductive carboxylation of α-Ka, an attempt to measure the dissociation constant of the Mg-α-Ka complex by 1H NMR gave no obvious complex formation over the range 0−3 ppm (data not shown). Therefore, enzyme likely binds the uncomplexed species. During the course of these experiments it was noted that Mg2+ catalyzed the rapid deuteration of α-Ka at C3 as shown by loss of the C3 resonance.
In the direction of oxidative decarboxylation, an initial velocity pattern was obtained by varying Mg2+ at several different fixed level of HIc with NAD fixed at 5 Km. Data were then plotted in double reciprocal form, with 1/v plotted against vs. the Mg-HIc complex concentration. If Mg-HIc is the reactant, all 16 points should fall on a straight line, whereas if the uncomplexed species bind to enzyme, a series of straight lines will be obtained. Data shown in Fig. 2, indicate Mg-HIc is the substrate for HIcDH. With isocitrate as the substrate, however, the uncomplexed forms of Mg2+ and isocitrate are true activator and reactant, respectively (data not shown).
Figure 2.

MgHIc is the substrate for HIcDH. A. Double-reciprocal plots obtained upon varying Mg2+ at several different fixed levels of HIc with NAD fixed at 2 mM. Rates were measured in 50 mM Hepes, pH 7.5, and 25°C. B. Double-reciprocal plot with 1/v plotted against the Mg-HIc complex concentration calculated using the Kd for MgHIc determined from Fig. 1.
Systematic Analysis
The initial velocity was measured at different concentrations of NAD and several different fixed levels of MgHIc. The double reciprocal plots intersected to the left of the ordinate, suggesting a sequential mechanism (data not shown). Data were fitted to eq. 2, and kinetic parameters are summarized in Table 1.
Table 1.
Kinetic Parameters of HIcDH Using Homoisocitrate and Isocitrate as Substrates.a
|
Oxidative Decarboxylation of HIc | |
|---|---|
| KNAD (mM) | 0.45 ± 0.08 |
| KMgHIc (mM) | 0.0042 ± 0.0009 |
| KiMgHIc (mM) | 0.002 ± 0.001 |
| V1/Et (s−1) | 13 ± 1 |
| V1/KNADEt (M−1·s−1) | (2.8 ± 0.2)×104 |
| V1/KMgHIc Et (M−1·s−1) | (3.1 ± 0.2)×106 |
|
Reductive Carboxylation of α-Ka | |
|---|---|
| KNADH (mM) | 0.090 ± 0.001 |
| Kα-Ka (mM) | 3.2 ± 0.1 |
| KCO2 (mM) | 16.3 ± 0.3 |
| constant (mM3) | 0.29 ± 0.09 |
| coefA(mM2) | 26 ± 2 |
| V2/Et (s−1) | 2.8 ± 0.2 |
| V2/KNADHEt (M−1·s−1) | (3.1 ± 0.2)×103 |
| V2/Kα-Ka Et (M−1·s−1) | 88 ± 5 |
| V2/KCO2 Et (M−1·s−1) | 17 ± 3 |
|
Oxidative Decarboxylation of Isocitrate | |
|---|---|
| KNAD (mM) | 2.5 ± 0.8 |
| KIsoc (mM) | 2.6 ± 0.6 |
| coef A (mM2) | 0.6 ± 0.5 |
| coef C (mM2) | 16 ± 4 |
| constant (mM3) | 35 ± 6 |
| V1/Et (s−1) | 0.062 ± 0.004 |
| V1/KNADEt (M−1·s−1) | 26 ± 2 |
| V1/KIsocEt (M−1·s−1) | 25 ± 2 |
Data were obtained in the direction of oxidative decarboxylation at pH 7.5, 25°C and the direction of reductive carboxylation at pH 7.0, 25°C.
Data were also obtained in the reverse reaction direction at pH 7.0. The initial rate was measured as a function of NADH at different fixed levels of α–Ka, and a fixed concentration of CO2 (added as HCO3−) and Mg2+. The experiment was then repeated at several different levels of CO2. Estimates of all of the kinetic parameters in this reaction direction were obtained by fitting the data to the equation for a fully random terreactant mechanism (eq. 3). The constant term (not possible in a sequential mechanism) and coef B terms were undefined. From a graphical analysis of the data, the values of V and coef C were very well defined. Numeric values of these terms were fixed to generate eq. 4 and the data were then fitted to this new equation. Values of the remaining kinetic parameters determined were identical to those obtained using eq. 3, and are summarized in Table 1.
Initial velocity patterns were obtained for the reaction using isoctitrate as a substrate varying the concentrations of NAD and isocitrate at different fixed concentrations of Mg2+. The crossover points for all double-reciprocal plots were to the left of the ordinate (data not shown). All of the initial velocity data were fitted to the equation for a fully random terreactant mechanism (eq. 3) to determine which terms in the denominator of the rate equation are absent. The Kc term was undefined, which suggests a kinetic mechanism with rapid equilibrium addition of Mg2+. Kinetic parameters are summarized in Table 1.
Pair-wise Analysis
In order to further define the terreactant kinetic mechanism for the reserve reaction, initial velocity patterns varying one substrate at different fixed concentrations of a second, and with the third substrate saturating were obtained and are shown in Figure 3. An intersecting initial velocity pattern was obtained for the α– Ka/CO2 pair (Fig. 3A), while the NADH/CO2 pair gave a parallel pattern (Fig. 3B). These patterns are consistent with several kinetic mechanisms, including a fully ordered one, and one that requires ordered addition of NADH, followed by random addition of CO2 and α–Ka. Kinetic parameters were obtained by fitting the data to eqs. 3 and 4. The values of kinetic parameters were in good agreement with those obtained via the systematic analysis discussed above.
Figure 3.

Pair-wise analysis of the HIcDH reductive carboxylation reaction using MgHIc as the substrate. Double-reciprocal plots obtained upon varying one substrate at different fixed concentrations of a second, and with the third substrate saturating. Rates were measured in 1 M Hepes, pH 7.0, and 25°C. A. Initial velocity pattern obtained with the α-Ka/CO2 pair with NADH at 0.8 mM (10 Km). B. Initial velocity pattern obtained with the NADH/CO2 pair with α-Ka at 60 mM (20 Km). The points are experimental, while the solid lines are theoretical based on a fit to equation 2 in A, and to equation 7 in B.
To define the terreactant kinetic mechanism for the isocitrate reaction, the same experiments were carried out as for HIc and the results are shown in Fig. 4. The initial velocity pattern for the isocitrate/Mg2+ pair intersects on the ordinate, which indicates equilibrium ordered addition of Mg2+ before isocitrate. The Mg2+/NAD pair gave a parallel pattern, suggesting isocitrate adds between NAD and Mg2+. On the basis of these results, data from double reciprocal initial velocity studies were then fitted to eq. 3 and 5, and values of the kinetic parameters determined using eq. 5 were similar to those obtained using eq. 3.
Figure 4.

Pair-wise analysis of the HIcDH oxidative decarboxylation reaction using isocitrate as the substrate. Double-reciprocal plots obtained upon varying one substrate at different fixed concentrations of a second, and with the third substrate saturating. Rates were measured in 50 mM Hepes, pH 7.5, and 25°C. A. Initial velocity pattern obtained with the isocitrate/Mg2+ pair with NAD at 40 mM (20 Km). B. Initial velocity pattern obtained with the NAD/Mg2+ pair with isocitrate at 20 mM (10 Km). The points are experimental, while the solid lines are theoretical based on a fit to equation 2 in A, and to equation 7 in B.
Product Inhibition Studies
Product inhibition data for the reactions using HIc or isocitrate as substrate in the direction of α-Ka formation are summarized in Table 2. In the HIc reaction, NADH is NC vs. NAD. When MgHIc is varied, curvature is observed in the double reciprocal plots in the presence of NADH. At low levels of MgHIc, NADH was competitive vs. MgHIc, while at high levels, inhibition became uncompetitive (Fig. 5). Data are suggestive of steady state random addition of MgHIc and NAD. α-Ka is UC vs. NAD and MgHIc.
Table 2.
Product Inhibition Patterns for HIcDH with HIc as Substrate.a
| Variable Substrate |
Fixed substrate b |
Inhibitor |
Kisc(mM) |
Kiic(mM) |
Pattern |
|---|---|---|---|---|---|
| NAD |
MgHIc |
NADH |
0.32 ± 0.05 |
1.1 ± 0.2 |
NC |
| MgHIc (low) |
NAD |
NADH |
0.24 ± 0.03 |
-- |
C |
| MgHIc (high) |
NAD |
NADH |
-- |
0.35 ± 0.01 |
UC |
| NAD |
MgHIc |
α-Ka |
-- |
7.7 ± 0.5 |
UC |
| MgHIc | NAD | α-Ka | -- | 5.8 ± 0.7 | UC |
Data were obtained at pH 7.5, 25°C
Fixed substrates are maintained at their respective Km.
Kis and Kii represent inhibition constants for slope and intercept, respectively.
Figure 5.
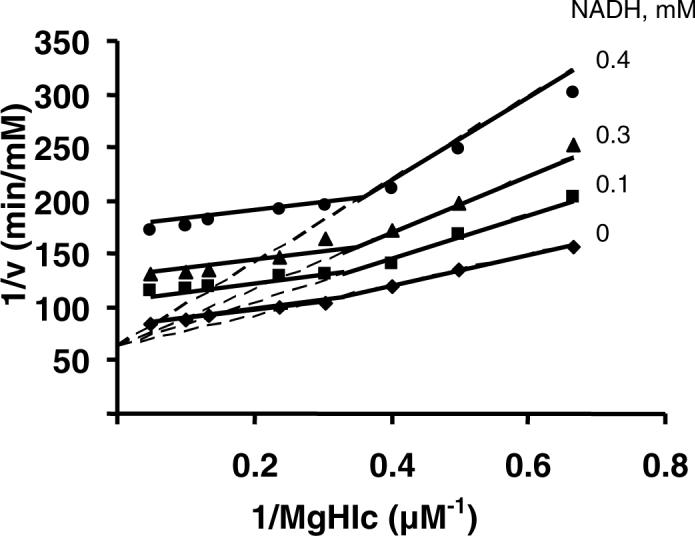
Product inhibition by NADH against MgHIc at pH 7.5. The concentration of NAD is fixed at its Km, and the MgHIc concentration is varied as indicated. Solid lines are a composite obtained from a fit of the data for 1.5−3.3 μM MgHIc to eq. 8 and 4.2−21 μM MgHIc to eq. 10. Points are experimental values.
Dead-end Inhibition Studies
For the HIc reaction, when isocitrate (slow substrate, Table 1) is used as a dead-end inhibitor of HIc, it is C vs. MgHIc, and NC vs. NAD. Citrate, another dead-end analogue of HIc, is also C vs. MgHIc, and NC vs. NAD. Using oxalate as a dead-end inhibitor, a unique inhibition pattern is observed. The secondary slope replot for oxalate inhibition vs. MgHIc (Fig. 6) or NAD (data not shown) is parabolic, while the intercept replot is hyperbolic indicating S-parabolic I-hyperbolic NC inhibition (Fig. 6).
Figure 6.

S-parabolic I-hyperbolic noncompetitive inhibition by oxalate against MgHIc. A. Primary plot exhibiting the S parabolic I-hyperbolic noncompetitive inhibition by Mgoxalate versus MgHIc with NAD fixed at its Km. B. Secondary plot of the slope versus oxalate concentration. C. Secondary plot of the intercept versus oxalate concentration. Rates were measured in 50 mM Hepes, pH 7.5, and 25°C. The points are experimental or from a graphical analysis, whereas the solid lines are theoretical based on the kinetic parameters from a fit to equation 11.
3-AcPyADP was used as a dead-end analogue of NAD, and is C vs. NAD. It gave a pattern similar to that inhibited with NADH as a product inhibitor when MgHIc is varied, i.e. it is C vs. MgHIc at low levels of MgHIc, but UC at high levels (Fig. 7). All dead-end inhibition constants are summarized in Table 3.
Figure 7.
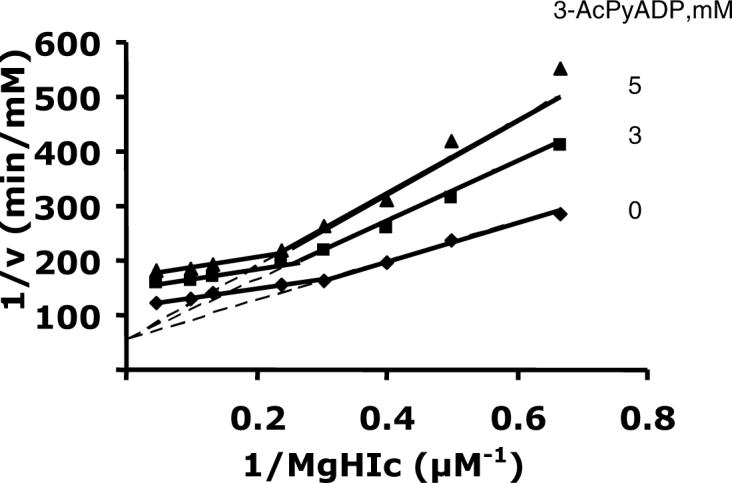
Dead-end inhibition by 3-AcPyADP against MgHIc at pH 7.5. The concentration of NAD is fixed at its Km, and the MgHIc concentration is varied as indicated. Solid lines are a composite obtained from a fit of the data for 1.5−3.3 μM MgHIc to eq. 8 and 4.2−21 μM MgHIc to eq. 10. Points are experimental values.
Table 3.
Dead-end Inhibition Patterns for HIcDH with HIc as substrate.a
| Variable substrate |
Fixed substrateb |
Inhibitor |
Kisc(mM) |
Kiic(mM) |
Inhibition Pattern |
|
|---|---|---|---|---|---|---|
| MgHIc |
NAD |
Isocitrate |
5 ± 1 (5 ± 1) |
-- |
C |
|
| NAD |
MgHIc |
Isocitrate |
6 ± 1 (1.9 ± 0.3) |
7 ± 1 (3.5 ± 0.7) |
NC |
|
| MgHIc |
NAD |
citrate |
11 ± 2 (11 ± 2) |
-- |
C |
|
| NAD |
MgHIc |
citrate |
54 ± 13 (17 ± 3) |
85 ± 15 (42 ± 8) |
NC |
|
| MgHIc (low) |
NAD |
AcPyADP |
5.7 ± 0.5 (1.8 ± 0.3) |
-- |
C |
|
| MgHIc (high) |
NAD |
AcPyADP |
-- |
9.9 ± 0.5 (5.0 ± 0.5) |
UC |
|
| NAD | MgHIc | AcPyADP | 2.5 ± 0.4 (2.5 ± 0.4) | -- | C | |
| Variable substrate |
Fixed substrateb |
Inhibitor |
Kid (mM) |
Knom (mM) |
Kdenom (mM) |
Inhibition Pattern |
|---|---|---|---|---|---|---|
| MgHIc |
NAD |
Oxalate |
20 ± 3 |
9 ± 5 |
4 ± 1 |
S-parabolic I-hyperbolic NC |
| NAD | MgHIc | Oxalate | 28 ± 2 | 22 ± 6 | 6 ± 1 | S-parabolic I-hyperbolic NC |
Data were obtained at pH 7.5, 25°C
Fixed substrates are maintained at their respective Km.
Kis and Kii represent inhibition constants for slope and intercept, respectively.
Average Ki for binding two molecules of oxalate to enzyme.
e The values in parentheses are corrected for the fixed substrates where applicable.
For the isocitrate reaction, citrate was chosen as a dead-end analogue of isocitrate, and is C vs. isocitrate, and NC vs. NAD. Oxalate, another dead-end inhibitor of isocitrate, is also C vs. MgHIc, and NC vs. NAD. 3-AcPyADP was used as a dead-end analogue of NAD, and is C vs. NAD, and NC vs. isocitrate. All dead-end inhibition constants are summarized in Table 4.
Table 4.
Dead-end Inhibition Patterns for HIcDH with Isocitrate as substrate.a
| Variable substrate |
Fixed substrate b |
Inhibitor |
Kisc(mM) |
Kiic(mM) |
Inhibition Pattern |
|---|---|---|---|---|---|
| Isocitrate |
NAD |
Citrate |
3.8 ± 0.8 (3.8 ± 0.8) |
-- |
C |
| NAD |
Isocitrate |
Citrate |
2 ± 1 (1.0 ± 0.4) |
1.3 ± 0.4 (0.6 ± 0.1) |
NC |
| Isocitrate |
NAD |
Oxalate |
3.1 ± 0.2 (3.1 ± 0.2) |
-- |
C |
| NAD |
Isocitrate |
Oxalate |
12 ± 4 (6 ± 2) |
7 ± 1 (3.5 ± 0.6) |
NC |
| Isocitrate |
NAD |
AcPyADP |
1.6 ± 0.5 (0.8 ± 0.3) |
6 ± 4 (1.5 ± 0.3) |
NC |
| NAD | Isocitrate | AcPyADP | 0.64 ± 0.09 (0.55 ± 0.07) | -- | C |
Data were obtained at pH 7.5, 25°C
Fixed substrates are maintained at their respective Km.
Kis and Kii represent inhibition constants for slope and intercept, respectively.
d The values in parentheses are corrected for the fixed substrates where applicable.
Determination of Keq
With all reactants, with the exception of α-Ka, fixed as discussed in Methods, the change in A340 (at equilibrium after enzyme was added) was plotted against the α-Ka concentration. The ΔA340 is an indicator of displacement from the equilibrium position, Fig. 8. The concentration of α–Ka that gave a ΔA340 of zero is 2.3 ± 0.1 mM. The Keq calculated using fixed concentrations of the other reactants and 2.3 mM α-Ka (eq. 12) is 0.45 M, while the Keq calculated from the Haldane relationship using the kinetic constants given in Table 1 and eq. 13 is 0.68 ± 0.03 M.
Figure 8.
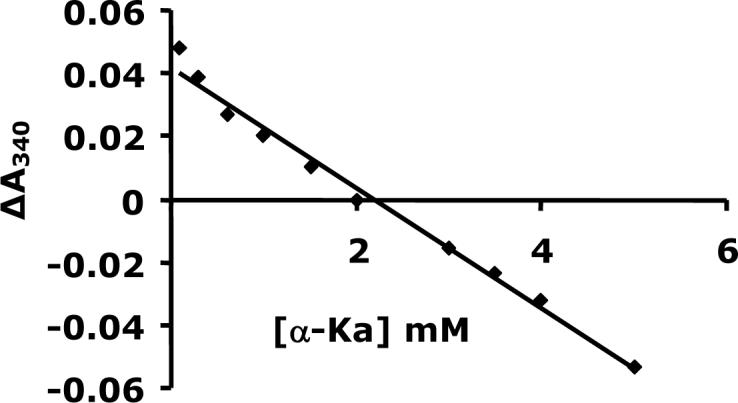
Determination of Keq based on the difference in A340 vs. α–Ka (0.1−5 mM). The points are experimental, while the solid lines are theoretical based on fit to the equation for a straight line.
DISCUSSION
The Reaction Catalyzed by HIcDH Using MgHIc as a Substrate
Initial Velocity Studies
An intersecting initial velocity pattern was observed when the initial rate was measured at different concentrations of NAD and different fixed levels of MgHIc, suggesting a sequential kinetic mechanism. The mechanism could be either steady state ordered or random.
In general, for a sequential terreactant mechanism, the initial velocity patterns obtained by varying concentrations of any two substrates with the third fixed at a non-saturating concentration are all intersecting. If the second substrate to add in an ordered mechanism is fixed at a saturating concentration, the initial velocity pattern obtained by varying the first substrate at different fixed level of the last becomes parallel (19); while three intersecting patterns would be consistent with a fully random mechanism whatever the concentration of the fixed reactant.
In the direction of reductive carboxylation of α-Ka, the data from the systematic analysis were fitted to eq. 3 for a fully random terreactant mechanism, the B term in the denominator of the rate equation is not defined, suggesting the EB (E:α-Ka) binary complex is not present. Data are consistent with a fully ordered mechanism or a random one with NADH adding only to free enzyme. Saturation with α-Ka and varying CO2/NADH gave a parallel pattern. These data are also consistent with the two mechanisms described above.
Interpretation of Product Inhibition Patterns
In the direction of oxidative decarboxylation of HIc, NADH and α-Ka were used as product inhibitors. When MgHIc is varied at a low concentration of NAD (Km), the NADH inhibition pattern is complex with biphasic double reciprocal plots (Fig. 5). (Biphasicity is very slight at zero NADH.) At low concentrations of MgHIc, NADH is competitive, likely indicating competition for free enzyme. As the concentration of MgHIc is increased, the pattern becomes uncompetitive, suggesting NADH forms a dead-end complex with MgHIc. At low concentrations of MgHIc, free enzyme predominates, while at high concentrations, the E:MgHIc complex is predominant. Data are consistent with switching pathways in a steady state random mechanism. The pathway with MgHIc adding before NAD is slower than that with NAD adding first, and with synergism of binding between the two substrates (20). Inhibition by NADH is noncompetitive vs. NAD when MgHIc is maintained at a low concentration (Km). Data are consistent with binding to free enzyme before NAD, which binds with higher affinity to MgHIc.
α-Ketoadipate is uncompetitive against both MgHIc and NAD, consistent with its release after CO2 and before NADH. Data are consistent with results of the pair-wise analysis, i.e., saturation with α-Ka gave a parallel initial velocity pattern, when CO2 and NADH were varied.
Dead-end Inhibition
3-Acetylpyridine adenine dinucleotide (3-AcPyADP) was chosen as a dead-end analogue of NAD. It shows competitive inhibition vs. NAD and a complex pattern vs. MgHIc similar to one observed with NADH as a product inhibition (Fig. 8). At low concentrations of MgHIc, there is competition between MgHIc and 3-AcPyADP for free enzyme, but as the concentration of MgHIc is increased, most of the enzyme is present as E:MgHIc and 3-AcPyADP becomes an uncompetitive inhibitor.
Isocitrate, a dead-end analogue of HIc, is competitive vs. MgHIc with NAD at its Km, while when NAD is varied, isocitrate is noncompetitive. This indicates either that isocitrate binds to free enzyme and NAD does not or that isocitrate binds to free enzyme competing with NAD and also binds to the E:NAD complex. The latter explanation is also consistent with the proposed random mechanism. Citrate, another dead-end inhibitor of HIc, gave qualitating identical to those with isocitrate as the inhibitor.
Using oxalate as a dead-end inhibitor, an inhibition pattern is obtained that differs from the others. The secondary slope replot for oxalate inhibition vs. MgHIc and NAD is parabolic, while the intercept replot is hyperbolic. The parabolic slope effect indicates the formation of a E:(Oxa)2 complex, i.e., two oxalate molecules bind to free enzyme in order for inhibition to be observed. The second molecule has a tighter binding than the first one, and traps the first molecule on enzyme. This is a reasonable result, since each of the small oxalate molecules mimics part of the HIc structure, likely binding to the carboxylate binding sites. The intercept effect observed with either MgHIc or NAD varied likely reflects binding to E:NADH. The hyperbolic intercept effect indicates oxalate cannot trap NADH on enzyme and NADH can be released at a lower rate for the E:NADH:oxalate complex compared to E:NADH. Data thus suggest there is either some randomness on the product site with α-Ka able to bind to E or the small oxalate can bind to enzyme whether or not NADH is bound. The rate constant for V at infinite oxalate concentration will be which must be about 3-fold lower than V1 (Table 3 and Fig. 6).
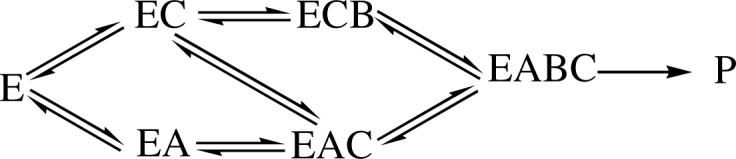
An overall kinetic mechanism using MgHIc as a substrate can be proposed and is shown in Scheme 2. On the basis of this mechanism, the rate equation in the direction of HIc formation, eq. 4, can be defined in terms of kinetic constants as shown in eq. 14.
| (14) |
A refit of all initial velocity data using eq.14 gave a Kia value of 0.0047 ± 0.003 mM, a Kib value of 1.7 ± 0.2 mM, and a Kic value is 2.2 ± 0.1 mM. All other constants are given in Table 1.
Scheme 2.

Proposed kinetic mechanism for HIcDH with MgHIc as substrate.
Kinetic Mechanism of HIcDH Using Isocitrate as Substrate
The kinetic mechanism with isocitrate, a slow substrate for HIcDH, was studied to compare to that suggested with HIc as the substrate. Slow substrates can simplify kinetic mechanism as a result of decreasing the rate of the catalytic portion of the mechanism. Intersecting initial velocity patterns were obtained in the direction of oxidative decarboxylation using isocitrate as a substrate. In this case, the uncomplexed species (Mg2+ and isocitrate) bind to enzyme, unlike the situation with MgHIc. When the data from the systematic analysis were fitted to eq. 3 for a fully random terreactant mechanism, the Kc term is not defined, which suggests the addition of Mg2+ in rapid equilibrium. Saturation with NAD and varying isocitrate/Mg2+ gave a pattern that intersected on the ordinate, suggesting equilibrium ordered addition of Mg2+ prior to isocitrate. A parallel pattern was observed for Mg2+/NAD at a saturating concentration of isocitrate (Fig. 4). Since Mg2+ adds in a rapid equilibrium prior to isocitrate, the pattern derives from isocitrate trapping Mg2+ on enzyme prior to NAD binding. Data suggest ordered binding of Mg2+ followed by isocitrate, but with random addition of NAD.
Citrate , oxalate and 3-AcPyADP were chosen as dead-end analogues of isocitrate and NAD, respectively. Citrate shows competitive inhibition vs. isocitrate, indicating that it binds to the isocitrate binding site. It is a noncompetitive inhibitor vs. NAD, indicating that it binds to the E:Mg and E:Mg:NAD enzyme forms. Oxalate gives the patterns qualitatively identical to those obtained with citrate. The hyperbolic intercept effect is eliminated since none of the E:NADH complex builds up in the steady state. The parabolic slope effect with isocitrate varied is not seen, suggesting only one molecule of oxalate binds to the E or E:NAD complex. Competitive inhibition by 3-AcPyADP vs. NAD suggests that it binds to the same enzyme forms as NAD. The noncompetitive inhibition vs. isocitrate indicates that it binds to E:Mg and E:Mg:isocitrate. These dead-end inhibition patterns are consistent with the proposed random mechanism shown in Scheme 3. Indeed, use of the slow substrate simplified the analysis, and the mechanism reduced to one that at least approximates rapid equilibrium random; not surprising given the >200 fold decrease in V/Et for isocitrate compared to MgHIc.
Scheme 3.
Proposed kinetic mechanism for HIcDH with isocitrate as substrate. In the Scheme, A, B, and C are NAD, isocitrate, and Mg2+.
For dead-end inhibitors, the measured appKi values must be corrected for the fixed reactant concentrations to give the true Ki value. The dead-end inhibition data were quantitatively analyzed according to (21).
Although isocitrate and HIc have a very similar structure, the chelate complex, MgHIc, is the form that binds to enzyme, similar to MgIsocitrate for ICDH (22). However, uncomplexed isocitrate and metal ion are substrates for HIcDH. The kinetic mechanism for both substrates is random in the forward reaction direction. The larger Km value and lower kcat value with isocitrate as the substrate are consistent with HIcDH being specific for HIc.
ACKNOWLEDGEMENTS
We thank Dr. Lei Li for help with sub-cloning the gene for HIcDH. We thank Dr. David R. J. Palmer for supplying homoisocitrate.
Footnotes
This work is supported by a grant from the National Institute of Health GM 071417 (to P. F. C. and A. H. W.), and the Grayce B. Kerr Endowment to the University of Oklahoma (to P. F. C.).
Abbreviations: HIcDH, homoisocitrate dehydrogenase; AAA, α–aminoadipate pathway; 6-PGDH, 6-phosphogluconate dehydrogenase; ICDH, isocitrate dehydrogenase; IPMDH, 3-isopropylmalate dehydrogenase; TDH, tartrate dehydrogenase; NAD, nicotinamide adenine dinucleotide (the + charge on the nicotinamide ring is omitted for convenience); NADH, reduced nicotinamide adenine dinucleotide; α-Ka, α–ketoadipate; HIc, homoisocitrate; MgHIc, Mg2+ and homoisocitrate complex; Hepes, 4-(2-hydroxyethyl)-1-piperazine-ethanesulfonic acid; IPTG, isopropyl β-D-thiogalactopyranoside; LB, Luria-Bertani; β-ME, mercaptoethanol; 3-AcPyADP, 3-acetylpyridine adenine dinucleotide phosphate; C, competitive inhibition; NC, noncompetitive inhibition; UC, uncompetitive inhibition; Ni-NTA, nickel-nitrilotriacetic acid.
REFERENCE
- 1.Strassman M, Ceci LN. Enzymatic Formation of α–Ketoadipate Acid from Homoisocitric Acid. J. Biol. Chem. 1965;240:4357–4361. [PubMed] [Google Scholar]
- 2.Zabriskie TM, Jackson MD. Lysine Biosynthesis and Metabolism in Fungi. Nat. Prod. Rep. 2000;17:85–97. doi: 10.1039/a801345d. [DOI] [PubMed] [Google Scholar]
- 3.Garrad RC, Bhattacharjee JK. Lysine Biosynthesis in Selected Pathogenic Fungi: Characterization of Lysine Auxotrophs and the Cloned LYS 1 Gene of Candida albicans. J. Bacteriol. 1992;174:7379–7384. doi: 10.1128/jb.174.22.7379-7384.1992. [DOI] [PMC free article] [PubMed] [Google Scholar]
- 4.Andi B, West AH, Cook PF. Stabilization and Characterization of Histidine-tagged Homocitrate Synthase from Saccharomyces cerevisiae. Arch. Biochem. Biophys. 2004;421:243–254. doi: 10.1016/j.abb.2003.11.005. [DOI] [PubMed] [Google Scholar]
- 5.Johansson E, Steffens JJ, Lindqvist Y, Schneider G. Crystal Structure of Saccharopine Reductase from Magnaporthe grisea, an Enzyme of the alpha-Aminoadipate Pathway of Lysine Biosynthesis. Structure. 2000;8:1037–1047. doi: 10.1016/s0969-2126(00)00512-8. [DOI] [PubMed] [Google Scholar]
- 6.Karsten WE, Cook PF. Pyridine Nucleotide-dependent β–Hydroxyacid Oxidative Decarboxylases: An Overview. Prot. Pep. Ltrs. 2000;7:281–286. [Google Scholar]
- 7.Cohen PF, Colman RF. Role of Manganous Ion in the Kinetics of Pig-Heart NAD-Specific Isocitrate Dehydrogenase. Eur. J. Biochem. 1974;47:35–45. doi: 10.1111/j.1432-1033.1974.tb03665.x. [DOI] [PubMed] [Google Scholar]
- 8.Dean AM, Dvorak L. The Role of Glutamate 87 in the Kinetic Mechanism of Thermus thermophilus Isopropylmalate Dehydrogenase. Protein Science. 1995;4:2156–2167. doi: 10.1002/pro.5560041022. [DOI] [PMC free article] [PubMed] [Google Scholar]
- 9.Park SH, Kiick DM, Harris BG, Cook PF. Kinetic Mechanism in the Direction of Oxidative Decarboxylation for NAD-malic Enzyme from Ascaris suum. Biochemistry. 1984;23:5446–5454. doi: 10.1021/bi00318a011. [DOI] [PubMed] [Google Scholar]
- 10.Mallick S, Harris BG, Cook PF. Kinetic Mechanism of NAD-malic Enzyme from Ascaris suum in the Direction of Reductive Carboxylation. J. Biol. Chem. 1991;266:2732–2738. [PubMed] [Google Scholar]
- 11.Weiss PM, Gavva SR, Harris BG, Urbauer JF, Cleland WW, Cook PF. Multiple Isotope Effects with Alternative Dinucleotide Substrates as a Probe of the Malic Enzyme Reaction. Biochemistry. 1991;30:5755–5763. doi: 10.1021/bi00237a018. [DOI] [PubMed] [Google Scholar]
- 12.Uhr ML, Thompson VW, Cleland WW. The Kinetics of Pig Heart Triphosphopyridine Nucleotide-Isocitrate Dehydrogenase. I. Initial Velocity, Substrate and Product Inhibition, and Isotope Exchange Studies. J. Biol. Chem. 1974;249:2920–2927. [PubMed] [Google Scholar]
- 13.Northrop DB, Cleland WW. The Kinetics of Pig Heart Triphosphopyridine Nucleotide-Isocitrate Dehydrogenase. II. Dead-end and Multiple Inhibition Studies. J. Biol. Chem. 1974;249:2928–2931. [PubMed] [Google Scholar]
- 14.Dean AM, Koshland DE. Kinetic Mechanism of Escherichia coli Isocitrate Dehydrogenase. Biochemistry. 1993;32:9302–9309. doi: 10.1021/bi00087a007. [DOI] [PubMed] [Google Scholar]
- 15.Berdis AJ, Cook PF. Overall Kinetic Mechanism of 6-Phosphogluconate Dehydrogenase from Candida utilis. Biochemistry. 1993;32:2036–2040. doi: 10.1021/bi00059a021. [DOI] [PubMed] [Google Scholar]
- 16.Price NE, Cook PF. Kinetic and Chemical Mechanism of the Sheep Liver 6-Phosphogluconate Dehydrogenase. Arch. Biochem. Biophys. 1996;336:215–223. doi: 10.1006/abbi.1996.0551. [DOI] [PubMed] [Google Scholar]
- 17.Tipton P. Intermediate Partitioning in the Tartrate Dehydrogenase-Catalyzed Oxidative Decarboxylation of D-malate. Biochemistry. 1993;32:2822–2827. doi: 10.1021/bi00062a013. [DOI] [PubMed] [Google Scholar]
- 18.Nelson RB, Gribble GW. On the Preparation of α–Ketoadipic Acid. Organic Preparation and Procedures Int. 1973;5:55–58. [Google Scholar]
- 19.Cleland WW. Steady-state Enzyme Kinetics. In: Boyer PD, editor. The Enzymes. Vol. 2. Academic Press; New York: 1970. pp. 1–65. [Google Scholar]
- 20.Park SH, Kiick DM, Harris BG, Cook PF. Kinetic Mechanism in the Direction of Oxidative Decarboxylation for NAD-Malic Enzyme from Ascaris suum. Biochemistry. 1984;23:5446–5453. doi: 10.1021/bi00318a011. [DOI] [PubMed] [Google Scholar]
- 21.Xu H, West AH, Cook PF. Overall Kinetic Mechanism of Saccharopine dehydrogenase from Saccharomyces cerevisiae. Biochemistry. 2006;45 doi: 10.1021/bi0610808. in press. [DOI] [PubMed] [Google Scholar]
- 22.Willson VJC, Tipton KF. The Activation of Ox-Brain NAD+-dependent Isocitrate Dehydrogenase by Magnesium Ion. Eur. J. Biochem. 1981;113:477–483. doi: 10.1111/j.1432-1033.1981.tb05088.x. [DOI] [PubMed] [Google Scholar]