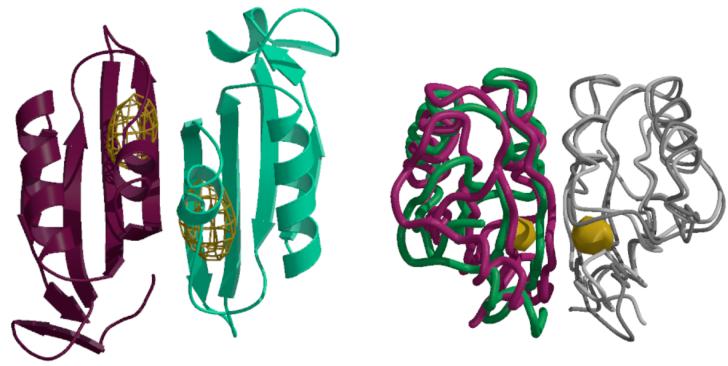
Figure 3.
(A) Anomalous difference Fourier map calculated at 5.2 Å resolution illustrating the binding of selenomethionine to the C2-domains of MetNI following a 1 mM soak of transporter crystals. The electron density is contoured at 6 times the standard deviation of the map. (B) Comparison of the relative orientations of C2-domains observed in the MetNI and free MetN-C2 structures, following superposition of one subunit in each dimer. The green and dark gray traces correspond to the C2-domain dimer in MetNI, while the magenta and light gray traces represent the isolated C2-domain structure. The binding site for selenomethionine is denoted by the gold surface. The view is roughly perpendicular about the horizontal axis from that in (A).

