

Abstract
Multi-dimensional liquid chromatography in combination with tandem mass spectrometry has been used to analyze a variety of biological structures including protein complexes. Incorporating this approach with autosampling devices presents a number of problems including decreased sensitivity due to exposure to extra surfaces, carry over from run to run, and increased dead volume. We developed a device, termed Radial Column Array for Distribution and Automation (RCADiA), to automate multiple MuDPIT experiments while eliminating many of these problems and maintaining a high resolution and sensitive analysis. The design, which places each sample downstream of any common fluid path, presents a low risk of carryover between successive analyses. Beyond the convenience of automation, the RCADiA platform also produces data of similar quality to the standard method of performing individual MuDPIT experiments. We demonstrate this device by performing a comparative analysis of mitochondria enriched from rat liver and spinal cord.
Keywords: automation, high-throughput, MuDPIT, differential profiling, comparative proteomics
The use of separations together with tandem mass spectrometry and protein sequence database searching has provided important new tools for the analysis of biological experiments. To increase the complexity of the biological experiments that can be analyzed, multi-dimensional liquid chromatography has been used to improve the resolution of separations 1. Two-dimensional liquid chromatography coupled to tandem mass spectrometry has been used to analyze protein complexes, organelles, cells and tissues 2-4. The process involves proteolytic digestion of proteins followed by loading of the sample onto the microcolumn. Sample loading can be accomplished by one of three methods: pressure-loading directly onto a microcolumn, loading through an autosampler, or injecting through a sample injector. All of the above methods have advantages and disadvantages.
Direct pressure loading of samples insures the maximum amount of the sample is directly loaded onto the microcolumn with a minimum of exposure to new surfaces. By loading samples through a sample injector, a sample is exposed to the injection needle, internal surfaces of the injector and the sample loop. Such devices also increase the dead volume of the system until the sample loop is taken off line. This method is convenient although samples can not be loaded unattended. An autosampler injects a set volume of liquid into the flow line and through a valve or series of valves into the flow stream of the HPLC column. It is difficult to completely inject all of the liquid from the vial onto the column and generally a preset volume is loaded. In some systems the volume loaded for each sample vial can be varied but this must be pre-programmed into the system. Dead volume is generally larger but these considerations can be minimized by using a separate pump to load sample onto a precolumn prior to elution onto an analytical column.
Currently a limited number of options exist for automated 2-DLC-MS/MS analysis, although no methods have yet been developed specifically for MuDPIT. All current autosampling systems use a single fluid path and column system for 2-DLC analysis. Autosamplers work best when not analyzing small quantities of samples or when dealing with large batches of moderately complex samples and may be appropriate for analyses involving highly complex samples in non-comparative studies 5. Attempting to use an autosampler in comparative settings, however, can prove difficult without the use of appropriate blank runs to insure no sample carryover between analyses. Samples of high complexity may run the risk of sample cross-contamination. Such an effect of “carryover” or “ghosting” is long-associated with autosampler use and is the result of performing multiple analyses of different samples using the same column, tubing, and injector 6, 7. Such issues may be reconciled by performing blank runs in attempt to elute or wash out any sample previously retained. Washing steps could be used to clean a 2-DLC column, but the use of a blank analysis to insure no carryover would be time consuming.
In this study we demonstrate a method for automating MuDPIT experiments that is as sensitive as the single standard column configuration. A major advantage of this method is that during analysis samples are placed downstream of any common fluid path. Such strategies have proven to be highly effective in eliminating carryover between samples 8. By preventing carryover, peptide identifications may be considered without concern for identifying contaminants resulting from sample carryover from consecutive runs. For these reasons, our automated method could be useful for comparing protein profiles. A system to multiplex HPLC separations into a mass spectrometer has been developed by Xu et al 9 that is designed to improve the throughput of sample analysis. In this study the MUX system uses four separate HPLC fluid paths to achieve its throughput gains and injects different samples onto each of the columns through a four-plex autosampler. Throughput is optimized in the MUX system and not sensitivity.
We have created a simple device consisting of a multiposition valve and a stage in which multiple microcolumns can be arranged in a radial pattern to spray into the centrally located heated capillary of a mass spectrometer. The platform, named Radial Column Array for Distribution and Automation or RCADiA, utilizes the prior loading of sample onto individual columns via a pressurized device. Each column is connected to the multiposition valve and positioned on the stage. Through use of the multiposition valve synchronized control of both voltage and buffer flow is possible. By integrating the multiposition valve with software controlling the mass spectrometer, multiple columns may be individually run and switched in sequence, without the need for robotic manipulation. In this paper we evaluate the performance of the system with regards to sensitivity at each position of the array, sample cross-talk between positions, and demonstrate utility with a comparative analysis of a mitochondrial sample from rats.
Experimental Section
RCADiA Platform Design
The design of the system was based on the amount of space available near the heated capillary of the mass spectrometer to position 8 columns. The system consists of a Cheminert eight channel multiposition valve fitted with a PEEK stator and rotor (VICI Valco, Houston, TX) and retrofitted with a custom-fabricated Delrin slotted coupler and clamp ring (Scripps Research Institute Instrumentation and Design Laboratory, La Jolla, CA). A transitional stage was created (Scripps Research Institute Instrumentation and Design Laboratory, La Jolla, CA) to position each of the columns at the front of the mass spectrometer. Positions for columns on the stage were built symmetrically at angles of +/- 6.4, 19.3, 32.1, and 45.0 degrees relative to the central axis of the heated capillary on the mass spectrometer. Integration of valve switching with the XCalibur datasystem software (Thermo Finnigan, Palo Alto, CA) was possible by connecting the multiposition actuator control module to the ‘contact closure out’ terminal of the mass spectrometer. A FC-62C video-microscope (Edmund Scientific, Barrington, NJ) was used to monitor column tip position and spray conditions throughout the course of each run. Additionally, a piece of projector transparency film of 0.15 mm thickness was machine-inscribed with a grid of lines approximately 0.05 mm thick and spaced 0.2 mm apart. The mounted/removable film combined with the video-microscope assisted in accurately gauging distances of the column tips relative to each other and the heated capillary of the mass spectrometer.
Qualitative analysis of spray isolation
Columns on the platform were consecutively assigned to spray a solution of angiotensin I (1pmol/μL in 50% MeOH and 0.1% acetic acid) into the heated capillary of an LTQ mass spectrometer (Thermo Finnigan, Palo Alto, CA) while scanning in the XCalibur Tune program. Electrospray was visualized via video-microscope by illumination with a red, hand held Aquarii Value Laser Pointer (Adva-lite, St. Petersburg, FL).
Column cross-talk analysis
Individual purified proteins (rabbit glycogen phosphorylase, bovine serotransferrin precursor, bovine carbonic anhydrase, bovine catalase, Saccharomyces cerevisiae alcohol dehydrogenase, bovine alpha crystallin, bovine serum albumin, and chick ovalbumin (Sigma-Aldrich, St. Louis, MO) were digested at 37 degrees C overnight using trypsin (Roche, Penzberg, Germany) at a concentration of 1:100, substrate to enzyme in a buffer of Tris-HCl, pH 8.6. A total of 1 pmol of each digest was individually pressure loaded onto a respective single phase microcolumn. Each column was assembled using a 100 μm inner diameter (ID) fused silica column laser-pulled to a 5 μm orifice and packed with 8 cm of Aqua 3 um C18 resin (Phenomenex, Ventura, CA). The buffer solutions used were 5% acetonitrile/0.1% formic acid (buffer A) and 80% acetonitrile/0.1% formic acid (buffer B). While a total of eight columns were simultaneously positioned on the stage, each round of automation was performed by running a 90 min gradient of 0-45% buffer B on the column in position 1, switching the multiposition valve one position forward, and immediately running another gradient on the column in position 2. This process was repeated until all eight columns had been run. As peptides eluted from the microcolumn, they were electrosprayed directly into an LCQ-Classic mass spectrometer (Thermo Finnigan, Palo Alto, CA) with the application of a distal 3.5 kV spray voltage. A cycle of one full-scan mass spectrum (400-1400 m/z) followed by 3 data-dependent MS/MS spectra at a 35% normalized collision energy was used. Application of mass spectrometer scan functions, HPLC solvent gradients, and the multiposition valve were controlled by the XCalibur datasystem.
Electrospray Sensitivity Analysis
Using the LCQ-Classic precision syringe pump and a 250μL gastight syringe (Hamilton, Bonaduz, Switzerland) a solution of angiotensin I (1pmol/μL in 50% MeOH and 0.1% acetic acid) was infused at a constant rate of 1.0 μL/min through the multiposition valve into one of eight unpacked laser-pulled 100um ID fused silica columns. From each column the angiotensin solution was sprayed into an LCQ-Classic mass spectrometer for a ‘spray stabilization’ period of approximately 1 minute in which no data was collected followed by five minutes of data collection. Without altering the HPLC tubing configuration, four replicate analyses were performed on six columns simultaneously fixed in positions 1-6 at +/- 6.4, 19.3, and 32.1 degrees on the RCADiA stage and individually on the standard axial stage (0.0 degrees) for comparison. Using the grid-inscribed transparency film, we placed the tips of columns 1-6 to spray at distances of 2.2 (columns 1 and 6), 2.7 (columns 2 and 5), and 3.2 mm (columns 3 and 4) from the heated capillary. Distance between adjacent column tips was approximately 0.6 mm. When using the standard axial stage the column tip was placed at a distance of 2.4 mm from the heated capillary. Full mass spectrum (200-2000 m/z) data was collected using the XCalibur Tune program.
Subcellular fractionation and MuDPIT analysis of rat spinal cord mitochondria
Liver and spinal cord from non-transgenic rats were collected and immediately placed on ice. Subcellular fractionation to obtain mitochondrial material was performed as described previously with modifications 10. Briefly, tissues were homogenized in buffer containing 210 mM mannitol, 70 mM sucrose, 10 mM tris pH 7.5 and 1 mM EDTA, pH 7.5, with a 1:5 (w/v) ratio. Homogenized material was centrifuged at 1300g for 10 min to remove nuclei. The nuclear pellet was washed with a 50% volume of the same buffer twice. All supernatants were combined and centrifuged again at 17,000g for 15 min to obtain the crude mitochondrial pellet. The mitochondrial pellet was washed once with 50 mM KCl before further purification on the Nycodenz gradient. Density purification of mitochondria was performed in a gradient tube containing 34% (0.4 mL) / 30% (0.7 mL) / 25% (1.0 mL) / 23% (0.7 mL) / 20% (0.2 mL) Nycodenz in 5 mM Tris pH7.4/1 mM EDTA diluted by a buffer containing 0.25 M sucrose, 5 mM Tris pH7.4 and 1 mM EDTA. The mitochondrial pellet was resuspended in a small volume of the original homogenization buffer and diluted in 1 mL of 25% Nycodenz. The gradient was centrifuged at 52,000g for 1.5 hours. The material at the interphase of 25% and 30% Nycodenz was collected and centrifuged again as a mitochondrial pellet. Protein concentrations were measured using the BCA method (Pierce, Rockford, IL,). Approximately 750 μg from each cell type was solubilized using 200 μL of 5× Invitrosol (Invitrogen, Carlsbad, CA), 8M urea, and 5mM TCEP. Solubilization was followed by incubation and moderate vortexing for 1 hour. Samples were then alkylated using 10mM iodoacetamide and finally diluted using 240 μL of 100mM tris, pH 8.5. Each sample was digested as described previously except that 1.25 μL of trypsin (0.5μg/μL in 1% acetic acid) was used 11. Each digest was divided into four equal parts containing approximately 175 μg of protein each. These tubes were centrifuged at 14,000g for 1 hour. Supernatant from each was collected and pressure-loaded onto a fused silica capillary desalting column containing 5 cm of 5 μm Polaris C18-A material (Metachem, Ventura, CA) packed into a 250-μm inner diameter (I.D.) capillary with a 2 μm filtered union (UpChurch Scientific, Oak Harbor, WA). The desalting column was washed with buffer containing 95% water, 5% acetonitrile, and 0.1% formic acid. After desalting, a 100μm I.D. capillary with a 5-μm pulled tip packed with 10 cm 3-μm Aqua C18 material (Phenomenex, Ventura, CA) followed by 3 cm 5-μm Partisphere strong cation exchanger (Whatman, Clifton, NJ) was attached to the filter union and the entire split-column (desalting column–filter union–analytical column) was placed inline with an Agilent 1100 quaternary HPLC (Palo Alto, CA). Peptides were analyzed using a modified 6-step separation described previously 12. The buffer solutions used were 5% acetonitrile/0.1% formic acid (buffer A), 80% acetonitrile/0.1% formic acid (buffer B), and 500 mM ammonium acetate/5% acetonitrile/0.1% formic acid (buffer C). Step 1 consisted of a 60 min gradient from 0-100% buffer B. Steps 2-5 had the following profile: 3 min of 100% buffer A, 5 min of X% buffer C, a 2 min gradient from 0-10% buffer B, and a 110 min gradient from 10-35% buffer B. The 10 min buffer C percentages (X) were 25, 50, 65, and 85% respectively for the 6-step analysis. In the final step, the gradient contained 3 min of 100% buffer A, 15 min of 100% buffer C, a 2 min gradient from 0-10% buffer B, a 120 min gradient from 10-20% buffer B, and a 10 min gradient from 20-100% buffer B. As peptides eluted from the microcolumn, they were electrosprayed directly into an LTQ 2-dimensional ion trap mass spectrometer (Thermo Finnigan, Palo Alto, CA) with the application of a distal 3.5 kV spray voltage. A cycle of one full-scan mass spectrum (400-1400 m/z) followed by 8 data-dependent MS/MS spectra at a 35% normalized collision energy was repeated continuously throughout each step of the multidimensional separation. Application of mass spectrometer scan functions and HPLC solvent gradients were controlled by the XCalibur datasystem.
Analysis of Tandem Mass Spectra
Tandem mass spectra were analyzed using the following software analysis protocol. Poor quality spectra were removed from the dataset using an automated spectral quality assessment algorithm 13. Tandem mass spectra remaining after filtering were searched with the SEQUEST™ algorithm 14 against either (i) sequences for the eight purified proteins listed above appended to the Saccharomyces Genome Database (updated Dec. 16, 2005) or (ii) the Ensembl International Protein Index Rat Proteome database (version 3.17, updated May 10, 2006) concatenated to a decoy database in which the sequence for each entry in the original database was reversed 5. All searches were parallelized and performed on a Beowulf computer cluster consisting of 100 1.2 GHz Athlon CPUs 15. No enzyme specificity was considered for any search. SEQUEST results were assembled and filtered using the DTASelect (version 2.0) program 16, 17. DTASelect 2.0 uses a linear discriminant analysis to dynamically set XCorr and DeltaCN thresholds for the entire dataset to achieve a user-specified false positive rate (5% in this analysis). The false positive rates are estimated by the program from the number and quality of spectral matches to the decoy database. A minimum requirement of 2 spectral matches per protein was applied in addition to the above criteria.
Results and Discussion
We developed a platform to allow up to 8 individual 2-DLC columns to be analyzed sequentially using a single HPLC pump. We maintained a common practice of off-line loading of sample onto a MuDPIT column to maximize sensitivity and minimize sample carry over between analyses by only using a column once. HPLC flow is directed to each of the columns in turn using a multi-position valve (Scheme 1). We tested this configuration for uniform electrospray ionization and sensitivity across all 8 columns as well as to determine the possible presence of column cross-talk. The concept of using multiple columns with one mass spectrometer is not new, but our system was designed for use with microcolumns to achieve high sensitivity analysis of complex peptide mixtures using 2-DLC/MS/MS 8, 9.
Scheme 1.
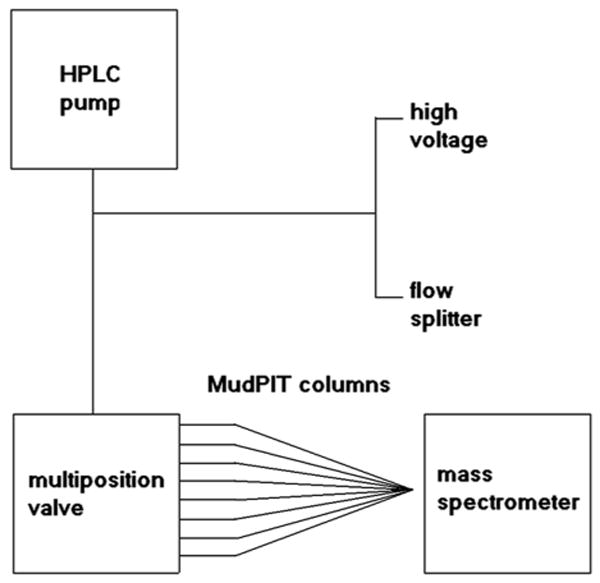
Diagram of the RCADiA platform
Our hypothesis was that by applying a distal voltage upstream of a multiposition valve, synchronized directional control of buffer and voltage flow could be possible. To qualitatively test the ability of the multiposition valve to isolate the flow of voltage and buffer to a particular column, we used laser light to illuminate the tips of eight columns on the RCADiA platform while spraying a solution of angiotensin. Initial analyses were plagued by voltage leaking to multiple columns simultaneously, an effect demonstrated by visualization of multiple spray plumes. Upon replacing the factory clamp ring and slotted coupler on the multiposition valve with that made of Delrin, the appearance of multiple spray plumes no longer persisted. Accordingly, when selecting a particular channel on the multiposition valve a spray plume was visualized only at the respective column tip (Figure 1a-h). For this reason we concluded that voltage and buffer flow were synchronously delivered to the individual columns using the RCADiA design.
Figure 1a-h.
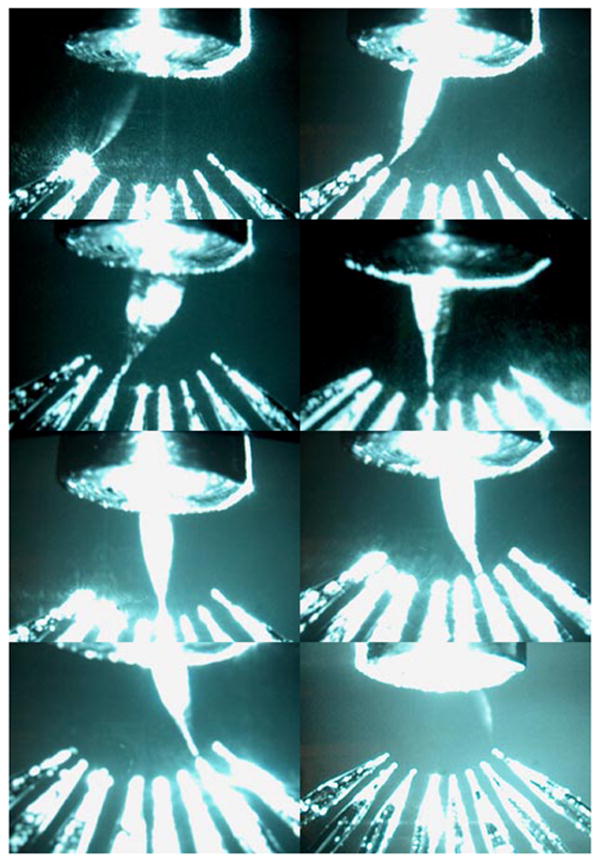
Laser-aided visualization of an individual electrospray plume at the tip of each column on the RCADiA platform indicates isolated, synchronous delivery of liquid buffer and voltage.
The possibility remained that in the RCADiA platform non-selected columns might also emit ions without producing a plume that was noticeable in our first experiment if the voltage, and not the buffer, continued to leak at very low levels. Such a leaking effect would be deleterious, potentially acting as a means of contamination via column cross-talk. To further test this possibility we individually loaded eight different purified proteins on eight respective columns and ran each in sequence for five replicate rounds. Upon searching the resultant spectra we found that in all cases all of the peptides detected during the run of a column were the ones specific to the protein digest loaded in that column. From these results we concluded that no detectable effect of column cross-talk is produced in the RCADiA platform. These findings are in agreement with previously published results of a similar electrospray device which features a column array 9.
It is important to note that the design of the RCADiA platform columns which await analysis have potential to become dried, un-equilibrated, and even clogged. Our investigation of signal sensitivity consisted of analyses which were quick, and thus we were able to avoid such issues. MuDPIT columns, which consist of multiple solid phase materials and generally set to spray for extended periods (commonly 12 hrs.), are more prone to such effects of idle waiting. In our differential profiling of mitochondrial proteomes the MuDPIT columns only occasionally became dried while awaiting analysis. Our simplest solution for this issue was to perform extended spray stabilization periods (100% buffer A, ∼10 min) prior to running each MuDPIT sequence. This was sufficient to re-equilibrate each column before beginning analysis and allowed normal MuDPIT experiments to follow. Though it was not explicitly tested in this study, we hypothesize that implementing a quick round of re-equilibration steps for each idle column (100% buffer A, perhaps 5 min in duration) between successive MuDPIT experiments may be a way to more reliably avoid a drying/clogging phenomenon. Such a re-equilibration step will come at the cost of extending the array run time (ART), which may be defined as the total time required for completing an entire set of runs.
Additional ways in which ART will be extended is by increasing the total number of columns in the array and/or analysis time for each. The throughput advantage of the RCADiA platform will become static at the point where ART is equal to the time required to completely run a blank gradient on a single column. For instance, single phase analyses may require at least 3 (or more) blank gradients to completely remove sample carryover for a particular sample/column combination. In the case that 3 blank gradients will completely remove sample carryover then a total of 4 arrayed columns would maximize throughput advantage. This is because using more than 4 columns will result in an equal or greater ART during which the first column may be completely cleaned and re-equilibrated. Thus, for single phase analyses an appropriate number of columns for an RCADiA platform may be approximated by the total number of gradients (including the analysis) required to completely remove sample carryover for a single sample.
The issue of throughput advantage for MuDPIT columns is unique as users commonly do not reuse columns and opt instead to build new ones. This is due to issues particular to MuDPIT experiments, such as dramatically increased sample complexity and multiple separations materials, which significantly complicate performing blank runs to efficiently remove sample carryover within a column. In the case of creating a new column for each sample one must now consider the time required to build and load a new MuDPIT column as a basis for maximal throughput advantage versus minimum column number. Because MuDPIT column assembly, equilibration, and sample loading do not vary with analysis time, shorter MuDPIT experiments will have a greater throughput advantage than longer ones. For example, assembly and sample loading for a typical MuDPIT column may take four hours. Analysis time may be 12- (average) or 3- (short) hours long. Because in the duration of even a short MuDPIT analysis it is possible to produce another readied column, it seems ostensibly that the throughput advantage is maximized when using a single column. However, it is the experience of the authors that unless work is performed in shifts a normal work day may consistently yield only a single 12-hour and perhaps 3 3-hour MuDPIT experiments. Here it is a practical throughput advantage may be gained from using the RCADiA platform to automate MuDPIT experiments, allowing 2 12-hour experiments or even 8 3-hour experiments. In the case of performing 3-hour analyses, achieving 8 runs in 24 hours might involve running 2 samples during a typical work day and queue-up an array of 6 additional samples for overnight automated analysis. Thus for most MuDPIT experiments arrays will appropriate range from 2-6 columns.
We compared signal sensitivity among each of the column positions using a 6 column array. In order to test signal sensitivity, we infused an angiotensin solution through each column positioned in the array and monitored base peak intensity for a five minute period. We recognized that there can be slight variations in orifice shape and size among the columns even though all were laser-pulled using identical conditions. Because these differences can ultimately produce variations in spray sensitivity from column to column 18, we performed a control experiment for each column by also using the standard axial stage. As shown by the signal response histogram (Figure. 2, Table S-1), each of the six columns produce signals of equivalent intensity from the respective positions on the RCADiA stage. This indicates that signal sensitivity is the same from any position in the 6 column array. Moreover, the mean base peak signal intensity of any given position was quite similar in comparison with using the single column axial stage. These results show that there is not a significant difference in ion signal from any of the 6 angles on the RCADiA stage and the standard axial stage, and thus we conclude the angle of the column does not have an adverse effect on the sensitivity of the analysis.
Figure 2.

Comparison of electrospray sensitivity of six columns from positions on the RCADiA stage or the standard axial stage: base peak intensity of angiotensin was averaged over four replicate analyses in either position.
Finally, we tested the RCADiA platform in a proteomic experiment: the differential profiling of mitochondria from rat liver versus spinal cords. In many human diseases, reasons for tissue specificity have remained a mystery. This is particularly true for neurodegenerative diseases where mutations in ubiquitously expressed proteins lead to loss of cells only within the nervous system and often in very specific subgroups of neurons 19. A comparative approach to identifying tissue specific differences of proteins may prove invaluable to understanding why particular cells are vulnerable in these diseases. Here we have chosen liver, a tissue that is usually unaffected in neurodegenerative diseases, and spinal cord, a tissue that may be profoundly affected in neurodegenerative diseases. Focusing on identifying proteins found only in the mitochondria of cells in each tissue has allowed us to reduce the proteomic complexity of the samples and increase the comprehensiveness of our analysis.
Three technical replicates of 6-step MuDPIT for liver and wild-type mitochondria purifications were performed using the RCADiA stage. Additionally, another technical replicate of either purification was run using the standard axial stage. We compared each of the three samples run on the RCADiA stage to the respective sample run using the standard axial stage (Figure 3a-f) while focusing on proteins common to each pair of MuDPIT analyses. In order to account for any number of slight differences in columns and sample loading, we normalized each of the MuDPIT runs using a method previously developed by Washburn and colleagues 20. We calculated a Normalized Spectral Count Value (NSV) using spectral count per protein length for each protein divided by the sum of the spectral count per protein length for all proteins detected in that run. In a graphical comparison of the RCADiA stage and the axial stage we plotted the NSV of proteins identified using the RCADiA stage in the x-direction and using the axial stage in the y-direction. In all six pairs of analyses, plotted proteins fit a line angled at 45 degrees. This is evidence that, after normalization, data produced using the either RCADiA or the standard axial stage is equivalent. We conclude that normalized protein spectra counts from columns positioned on any angle of the RCADiA stage appear to be comparable to that of columns run individually using the standard axial stage.
Figure 3a-f.

Comparisons of SOD1G93A (G93A) and SOD1wild type (WT) samples (L-1, 2, 3 and S-1, 2, 3) run using the RCADiA stage versus the standard axial stage (L-Reg and S-Reg). Normalized Spectra Count Values (NSV) is plotted for the subset of proteins detected in each comparison.
Considering all four replicates of either purification, the differential proteomic profile of liver and wild type samples is displayed in Figure 4. Normalized spectra count values for each protein were averaged over all eight runs and illustrated in another x-y correlation plot. This approach, described previously by Roth et al 21, allows the visualization of protein identifications which are biased to a particular sample. Proteins which are found to localize near or at an axis are indicated to be differentially present in that particular sample. Performing a Student's T-test for each protein contributes further confidence to candidate proteins which fall into either of these biased groups (Table S-2). Using this strategy, our attention was drawn to a group of 379 proteins with a P-value of < 0.05 which were confidently identified 3 or 4 times in only one type of sample (Table S-3).
Figure 4.

Differential proteomic profiles of liver versus spinal cord mitochondria. Correlation plot of Mean Normalized Spectra Count Values (NSV) for each protein detected in eight MuDPIT experiments. Blue dots represent all proteins identified while pink dots represent a subset of these proteins found to be significantly biased to either liver versus spinal cord mitochondria (P-value <0.05). Zero spectra counts for proteins were substituted with a value of 0.000001 to allow these proteins to be represented logarithmically.
As a positive control we point to groups of proteins which we identified to be specific to liver or spinal cord mitochondria. For liver, this group includes mitochondrial proteins associated with known liver specific pathways including the P450 detoxification pathways (Cytochrome P450 2C70), urea acid cycle (Ornithine carbamoyltransferase), and detoxification of bile acids, steroids, and phenols (UDP-glucuronosyltransferase 2B4 precursor). Included in the list of spinal cord specific proteins are formyltetrahydrofolate synthetase and Glycerol-3-phosphate dehydrogenase, mitochondrial proteins expressed in both tissues, but expressed at higher levels in spinal cord tissues 19. While the majority of the proteins identified are mitochondrial as expected, we have also identified several proteins usually found in the cytosol or other organelles which we presume to have been inadvertently co-purified. These non-mitochondrial proteins also follow the expected tissue specific bias. For example, neurofilament triplet H, L, and M proteins, and glial fibrillary acidic protein, known to be in spinal cord and not liver, were found only in the spinal cord samples. In no cases did we identify proteins which, to our knowledge, are known to exist only in the liver or spinal cord.
Conclusion
We have developed a device for automating successive MuDPIT experiments which holds up to 8 columns. The device and the accompanying method involve isolating a sample to a single column thereby eliminating potential cross-contamination from common sample loading fluid paths. Sensitivity of analysis has been shown to be consistent among the different positions of the array and the possibility of contamination from cross-over of flow between columns is negligible. This strategy, while not as convenient as using a single 2-DLC column with an autosampler, eliminates the need to perform a column blank in between the analysis of different samples, and will increase the total throughput of a single 2-DLC-MS/MS system. A 2-DLC column blank would consume an inordinate amount of time to insure a column has been cleaned of the previous sample. This method permits high (continuous) throughput of highly sensitive proteomic analyses using 2-DLC-MS/MS. The comparison of neural mitochondria compared with liver mitochondria demonstrates the utility of differential proteome profiling using the RCADiA system. We have found 379 proteins specifically detected only in fractions enriched for mitochondria from rat liver or spinal cord, including several proteins already known to be liver or spinal cord specific. Determining the functional consequences of protein differences between liver and spinal cord mitochondria may yield important insights into why the nervous system is specifically damaged in neurodegenerative disease. We expect this method to be useful for automated 2-DLC analysis of wide range of samples, such as protein complexes.
Supplementary Material
Supplementary Tables 1-3
Table S-1. Mean base peak intensity of angiotensin infusion in six columns run on the RCADiA stage and the standard axial stage.
Table S-2. Proteins identified in four MuDPIT analyses of liver versus spinal cord mitochondrial purifications.
Table S-3.
Acknowledgments
We are extremely grateful for the valuable design input and craftsmanship of the RCADiA stage from the Instrument Design Laboratory at the Scripps Research Institute, particularly by Stanley R. Block. JRY is supported by NIH P41 RR11823-10.
References
- 1.Link AJ, Eng J, Schieltz DM, Carmack E, Mize GJ, Morris DR, Garvik BM, Yates JR., 3rd Nat Biotechnol. 1999;17:676–682. doi: 10.1038/10890. [DOI] [PubMed] [Google Scholar]
- 2.Oh P, Li Y, Yu J, Durr E, Krasinska KM, Carver LA, Testa JE, Schnitzer JE. Nature. 2004;429:629–635. doi: 10.1038/nature02580. [DOI] [PubMed] [Google Scholar]
- 3.Cagney G, Park S, Chung C, Tong B, O'Dushlaine C, Shields DC, Emili A. J Proteome Res. 2005;4:1757–1767. doi: 10.1021/pr0500354. [DOI] [PubMed] [Google Scholar]
- 4.Wu CC, MacCoss MJ, Mardones G, Finnigan C, Mogelsvang S, Yates JR, 3rd, Howell KE. Mol Biol Cell. 2004;15:2907–2919. doi: 10.1091/mbc.E04-02-0101. [DOI] [PMC free article] [PubMed] [Google Scholar]
- 5.Peng J, Elias JE, Thoreen CC, Licklider LJ, Gygi SP. J Proteome Res. 2003;2:43–50. doi: 10.1021/pr025556v. [DOI] [PubMed] [Google Scholar]
- 6.Dolan JW. LC/GC. 2001;19:164–168. [Google Scholar]
- 7.Wu J, Watson A. J Chromatogr B Biomed Sci Appl. 1998;714:113–118. doi: 10.1016/s0378-4347(98)00036-x. [DOI] [PubMed] [Google Scholar]
- 8.Liu H, Felten C, Xue Q, Zhang B, Jedrzejewski P, Karger BL, Foret F. Anal Chem. 2000;72:3303–3310. doi: 10.1021/ac000115l. [DOI] [PubMed] [Google Scholar]
- 9.Xu R, Wang T, Isbell J, Cai Z, Sykes C, Brailsford A, Kassel DB. Anal Chem. 2002;74:3055–3062. doi: 10.1021/ac0255476. [DOI] [PubMed] [Google Scholar]
- 10.Okado-Matsumoto A, Fridovich I. J Biol Chem. 2001;276:38388–38393. doi: 10.1074/jbc.M105395200. [DOI] [PubMed] [Google Scholar]
- 11.McDonald WH, Ohi R, Miyamoto DT, Mitchison TJ, Yates JR., III Int J Mass Spectrom. 2002;219:245–251. [Google Scholar]
- 12.Washburn MP, Wolters D, Yates JR., 3rd Nat Biotechnol. 2001;19:242–247. doi: 10.1038/85686. [DOI] [PubMed] [Google Scholar]
- 13.Bern M, Goldberg D, McDonald WH, Yates JR., 3rd Bioinformatics. 2004;20 1:I49–I54. doi: 10.1093/bioinformatics/bth947. [DOI] [PubMed] [Google Scholar]
- 14.Eng JK, McCormack AL, Yates JRI. J Am Soc Mass Spectrom. 1994;5:976–989. doi: 10.1016/1044-0305(94)80016-2. [DOI] [PubMed] [Google Scholar]
- 15.Sadygov RG, Eng J, Durr E, Saraf A, McDonald H, MacCoss MJ, Yates JR., 3rd J Proteome Res. 2002;1:211–215. doi: 10.1021/pr015514r. [DOI] [PubMed] [Google Scholar]
- 16.Cociorva D, Yates JR., III 54th ASMS Conference on Mass Spectrometry. 2006 [Google Scholar]
- 17.Tabb DL, McDonald WH, Yates JR., 3rd J Proteome Res. 2002;1:21–26. doi: 10.1021/pr015504q. [DOI] [PMC free article] [PubMed] [Google Scholar]
- 18.Zhou S, Cook KD. Anal Chem. 2000;72:963–969. doi: 10.1021/ac990912n. [DOI] [PubMed] [Google Scholar]
- 19.Taylor JP, Hardy J, Fischbeck KH. Science. 2002;296:1991–1995. doi: 10.1126/science.1067122. [DOI] [PubMed] [Google Scholar]
- 20.Zybailov B, Mosley AL, Sardiu ME, Coleman MK, Florens L, Washburn MP. J Proteome Res. 2006;5:2339–2347. doi: 10.1021/pr060161n. [DOI] [PubMed] [Google Scholar]
- 21.Roth AF, Wan J, Bailey AO, Sun B, Kuchar JA, Green WN, Phinney BS, Yates JR, Davis NG. Cell. 2006;125:1003–1013. doi: 10.1016/j.cell.2006.03.042. [DOI] [PMC free article] [PubMed] [Google Scholar]
Associated Data
This section collects any data citations, data availability statements, or supplementary materials included in this article.
Supplementary Materials
Supplementary Tables 1-3
Table S-1. Mean base peak intensity of angiotensin infusion in six columns run on the RCADiA stage and the standard axial stage.
Table S-2. Proteins identified in four MuDPIT analyses of liver versus spinal cord mitochondrial purifications.
Table S-3.