

Abstract
Identification of protein phosphorylation sites with their cognate protein kinases (PKs) is a key step to delineate molecular dynamics and plasticity underlying a variety of cellular processes. Although nearly 10 kinase-specific prediction programs have been developed, numerous PKs have been casually classified into subgroups without a standard rule. For large scale predictions, the false positive rate has also never been addressed. In this work, we adopted a well established rule to classify PKs into a hierarchical structure with four levels, including group, family, subfamily, and single PK. In addition, we developed a simple approach to estimate the theoretically maximal false positive rates. The on-line service and local packages of the GPS (Group-based Prediction System) 2.0 were implemented in Java with the modified version of the Group-based Phosphorylation Scoring algorithm. As the first stand alone software for predicting phosphorylation, GPS 2.0 can predict kinase-specific phosphorylation sites for 408 human PKs in hierarchy. A large scale prediction of more than 13,000 mammalian phosphorylation sites by GPS 2.0 was exhibited with great performance and remarkable accuracy. Using Aurora-B as an example, we also conducted a proteome-wide search and provided systematic prediction of Aurora-B-specific substrates including protein-protein interaction information. Thus, the GPS 2.0 is a useful tool for predicting protein phosphorylation sites and their cognate kinases and is freely available on line.
Post-translational modification of proteins provides reversible means to regulate the function of a protein in space and time. Recently computational studies of post-translational modifications (PTMs)1 of proteins have attracted much attention. Various PTMs regulate the functions and dynamics of proteins through specific modifications and are implicated in almost all cellular processes. In contrast to the labor-intensive and expensive experimental methods, in silico prediction of PTM-specific substrates with their sites has emerged as a popular alternative approach. To date, more than 32 computational prediction tools have been developed (1).
In the field of computational PTMs, protein phosphorylation is the most studied example. To predict general phosphorylation sites, several tools have been developed, such as DISPHOS (2), NetPhos (3), NetPhosYeast (4), and GANNPhos (5). As the need for performing large scale predictions and constructing reliable phosphorylation networks evolves, robust prediction of kinase-specific phosphorylation sites has become necessary and challenging. For example, Neuberger et al. (6) used pkaPS to predict potential protein kinase A (PKA) sites in the human proteome directly. With Predikin, Brinkworth et al. (7) predicted cognate PKs for 383 unannotated phosphorylation sites of 216 peptide sequences in yeast. Chang et al. (8) predicted 91 highly probable CDK substrates in budding yeast using the position-specific scoring matrix motif approach. Recently Linding et al. (9) developed NetworKIN and constructed a human phosphorylation network, which has gained diversified interest not only for human phosphorylation network prediction but also for general implication in cell biology. To predict kinase-specific phosphorylation sites, several on-line Web services have been implemented using various algorithms, including our previous work of GPS (10, 11) and PPSP (12), NetPhosK (13), ScanSite (14), KinasePhos (15, 16), PredPhospho (17), Predikin (18), PhoScan (19), pkaPS (6), etc.
Although ∼10 predictors are already available, two essential issues have remained elusive. In the previous work, there was no standard rule for protein kinase (PK) classification. We and others clustered PKs into subgroups casually by sequence similarity from BLAST results (9–13, 15–17, 19). The thresholds of PK classification varied in the previous publications, and the final PK subgroups were also quite different. Another issue is control of false positive rate (FPR) for large scale predictions. Usually the bona fide phosphorylation sites are only a small proportion of total Ser/Thr or Tyr residues present within a protein sequence. Thus, many false positive hits in the total prediction results could be generated even for a small FPR.
In this work, we refined the GPS software (Group-based Prediction System, version 2.0) for predicting kinase-specific phosphorylation sites in hierarchy. We adopted a PK classification established by Manning et al. (20) as the standard rule to cluster the human PKs into a hierarchical structure with four levels, including group, family, subfamily, and single PK. The training data were taken from Phospho.ELM 6.0 (21), and the modified version of the Group-based Phosphorylation Scoring algorithm (10, 11) was used. Also we defined a simple rule to calculate the theoretically maximal FPRs. Three cutoffs of high, medium, and low thresholds were established with FPRs of 2, 6, and 10% for serine/threonine kinases and 4, 9, and 15% for tyrosine kinases, respectively. The performance and robustness of the prediction system were extensively evaluated by self-consistency, leave-one-out validation, and 4-, 6-, 8-, and 10-fold cross-validations. Compared with other existing tools, GPS 2.0 carries a greater computational power with superior performance. The on-line Web server version and local packages of GPS 2.0 were implemented in Java and can predict kinase-specific phosphorylation sites for 408 PKs in human. Moreover we used GPS 2.0 to conduct a large scale prediction of more than 13,000 mammalian phosphorylation sites in which GPS 2.0 exhibited remarkable performance. Finally we demonstrated the accuracy of GPS 2.0 prediction based on a proteome-wide search for Aurora-B cognate substrates. Taken together, GPS 2.0 offers greater precision and computing power on predicting protein phosphorylation and enzyme-substrate relationship.
EXPERIMENTAL PROCEDURES
Protein Kinase Classification for the Training Data Set—
The training data set was derived from Phospho.ELM 6.0 (21), including 13,615 experimentally verified phosphorylation sites. First the redundant records were removed leaving 13,577 non-redundant entries. Then 3,161 non-redundant sites with respective kinase information were used for training. Because most of the verified sites were mammalian (13,254 of 13,579, ∼97.6%), we adopted a well established rule for human PK classification (20, 22) to cluster various PKs with their verified sites into a hierarchical structure with four levels, including group, family, subfamily, and single PK (20, 22) (see supplemental Table S1). The PK groups with less than three sites were singled out from this study.
The training data could be reused several times and included in different PK clusters (Fig. 1). For example, in the AGC group, the experimental sites with PK information of PKB_group, PKBβ, PKAα, PKA_group, and other AGC kinases were used as the training data. In the AGC/AKT family, the verified sites with PK information of PKB_group and PKBβ were used. Again for AGC/AKT/AKT2, the verified sites only with PK information of PKBβ were used. Also for the AGC/PKA family, only the verified sites with PK information of PKAα and PKA_ group were used. Currently there are only two PKAα sites identified. Thus, the PK cluster of AGC/PKA/PKAα was not used in GPS 2.0.
Fig. 1.

The training data could be reused several times and included in different PK clusters based on their cognate PKs information.
It has been reported that there are 518 human PKs identified (20). After careful curation, we found that PKG1 had two paralogs in human rather than one gene. In this regard, the total human kinome contains 519 unique PKs. As previously described, we used the experimentally verified phosphorylation sites as the positive data (+), whereas all other residues (Ser/Thr or Tyr) in the same substrates were regarded as the negative data (−) (10–12, 15–17).
Evaluation of Prediction Performance and Robustness of GPS 2.0—
The self-consistency validation was performed to evaluate the prediction performance. The jackknife validation and 4-, 6-, 8-, and 10-fold cross-validation were extensively performed to evaluate the robustness and stability of the prediction system. Four standard measurements of accuracy (Ac), sensitivity (Sn), specificity (Sp), and the Mathew correlation coefficient (MCC) were defined as follows.
 |
(Eq. 1) |
 |
(Eq. 2) |
 |
(Eq. 3) |
 |
(Eq. 4) |
The results of n-fold cross-validation were very similar to those with the leave-one-out validation (see supplemental Fig. S1). To simplify the analysis, we only adopted performances of the self-consistency and leave-one-out validation for further analysis. The receiver operating characteristic curves were drawn for 70 PK groups with ≥30 sites with the x axis of 1 − Specificity and the y axis of Sensitivity (see supplemental Fig. S2).
The Modified Version of the Group-based Phosphorylation Scoring Method Algorithm—
To predict kinase-specific phosphorylation sites, we used our previous Group-based Phosphorylation Scoring method with improvement (10, 11). First we defined a phosphorylation site peptide PSP(m, n) as a serine (Ser), threonine (Thr), or tyrosine (Tyr) amino acid flanked by m residues upstream and n residues downstream. The chief hypothesis of the algorithm is that if two short peptides share high sequence homology they may also bear similar three-dimensional structures and biochemical properties. Then we used the amino acid substitution matrix BLOSUM62 to calculate the similarity between two PSP(7, 7) peptides.
As described previously (10, 11), for two amino acids a and b, let the substitution score between them in BLOSUM62 be Score(a, b). The similarity between two PSP(7, 7) peptides (15 amino acids) A and B is defined as follows.
 |
(Eq. 5) |
If S(A, B) < 0, we simply redefine S(A, B) = 0.
Given a putative PSP(7, 7) peptide, it will be compared with all known sites pairwisely to calculate the substitution scores separately. The average value of the substitution scores is computed as the final prediction score of the given site. The basic idea of the Group-based Phosphorylation Scoring algorithm is also diagrammed (see Fig. 2). The gray dots represent the positive sites. The nearer distances indicate higher similarity scores between two sites. Given a putative PSP(7, 7) peptide, we can calculate its score. Then we can judge whether the given site is a potentially real phosphorylation site under different thresholds.
Fig. 2.
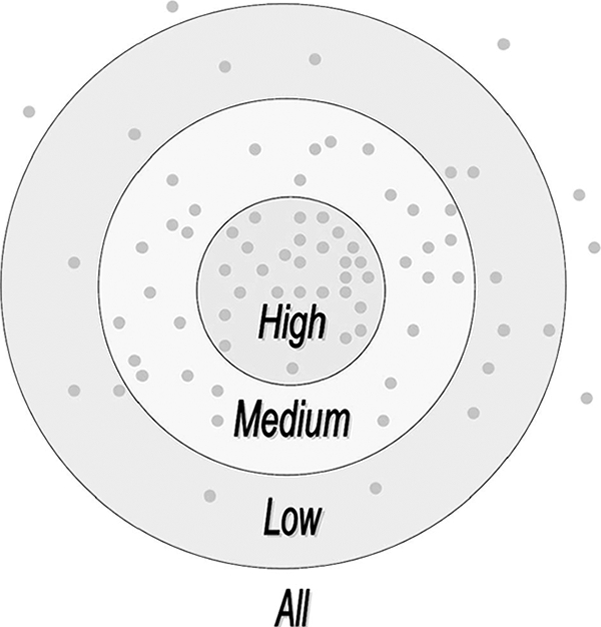
The basic idea of the Group-based Phosphorylation Scoring algorithm. The gray dots represent the positive sites. The nearer distances indicate higher similarity scores between two sites. Given a putative PSP(7, 7) peptide, we can calculate its score. Then we can judge whether the given site is a potentially real phosphorylation site under different thresholds.
In previous versions (GPS 1.0 and 1.10), we hypothesized that the bona fide pattern for PK recognition and modification might be compromised by heterogeneity of multiple structural determinants with different features. Then all known phosphorylation sites are automatically partitioned into several clusters with the Markov cluster algorithm to improve the prediction performance (10, 11). However, only ∼11% of the PK groups (eight of 71) could be divided into more than one cluster with improved performances. Thus, the clustering method was not used in GPS 2.0.
To improve the robustness of the prediction system globally without influencing the prediction performance significantly, we developed a simple method of matrix mutation (Fig. 3). First the amino acid substitution matrix BLOSUM62 was chosen as the initial matrix. The performance (Sn and Sp) of leave-one-out validation for each PK group was calculated. Then we fixed Sp at 90% to improve Sn by matrix mutation. The process of matrix mutation is halted when the Sn value is no longer increased. Although matrix mutation in other types was also valid, the method we used in this study could improve the leave-one-out validation significantly, whereas the self-consistency was only influenced moderately. Thus, such a procedure made the GPS 2.0 more robust and stable.
Fig. 3.

A simple method of matrix mutation.
Control of FPR—
To estimate the FPR, we tried to construct a near-negative data set by several approaches. The first method was to generate PSP(7, 7) peptides randomly. However, the abundances of the 20 amino acids are not equal in eukaryotes. Thus, the method was not used because it could not reflect the real distributions of PSP(7, 7) peptides in proteomes. Also the negative sites could also be randomly retrieved from eukaryotic proteomes. However, this method needs a large sequence file to retrieve PSP(7, 7) peptides, and this would slow the speed of computation. In this study, we chose a simple and fast method to construct the near-negative data set. First we calculated the distributions of amino acid composition in six organisms, including Saccharomyces cerevisiae, Schizosaccharomyces pombe, Caenorhabditis elegans, Drosophila melanogaster, Mus musculus, and Homo sapiens. Then we randomly generated PSP(7, 7) peptides based on the real frequencies of the 20 amino acids. And FPR values based on the latter two methods were very similar. By this method, we randomly generated 10,000 PSP(7, 7) peptides and used GPS 2.0 to estimate the theoretically maximal FPR. The process was repeated 20 times, and the mean value was calculated as the final FPR.
Threshold Setting—
Threshold setting was also a difficult problem. In general, we and others have chosen different thresholds for every PK group (6, 10–19). Here we propose a uniform rule to choose cutoff values based on calculated FPRs. For serine/threonine kinases, the high, medium, and low thresholds were established with FPRs of 2, 6, and 10%. For tyrosine kinases, the high, medium, and low thresholds were selected with FPRs of 4, 9, and 15%. The high threshold was validated by a large scale prediction of mammalian phosphorylation sites with satisfying performance. The medium threshold often reduced the stringency to be useful in small scale experiments. Also the low threshold reduced the Sp to improve Sn considerably; this is very useful in extensive experimental identification of all potential phosphorylation sites in substrates.
RESULTS
Construction of the GPS 2.0 Software—
The process of construction of GPS 2.0 software is summarized below (Fig. 4). An extensively adopted hypothesis for predicting kinase-specific phosphorylation sites is that PKs in a same group/subfamily will recognize similar sequence patterns of substrates for modification (9–19). In previous work, numerous PKs were classified into several groups simply based on sequence comparison by BLAST (9–19). Because the kinomes of several eukaryotic organisms have been comprehensively identified, phylogenetically analyzed, and classified into a hierarchical structure, including group, family, subfamily, and single PK (20), and because most of the phosphorylation sites in the public database have been experimentally verified in mammals (13,254 of 13,579, ∼97.6%), we directly used the classification of human kinome as the standard rule for GPS 2.0 (20). To date, the specific substrates with their relationships to respective cognate kinases have still not been identified. To predict potential phosphorylation sites for these kinases, a hypothesis should be adopted that the kinases in the same group, family, or subfamily could recognize similar patterns/motifs in substrates for modification. For example, both the CDK and MAPK families belong to the CMGC group (see supplemental Table S1) and could recognize a general motif of (pS/pT)P (where pS is phosphoserine and pT is phosphothreonine) for modification (23). Besides identification of substrates with relationships to well known PKs, GPS 2.0 could also predict substrate phosphorylation site information for many novel or less characterized PKs. Also the prediction capacity of GPS 2.0 is greater compared with the existing programs chosen. For example, GPS 1.0 and 1.10 (10, 11) could predict specific sites for Aurora-A and Aurora-B, respectively, whereas KinasePhos 2.0 could predict sites for Aurora group (AUR family; see supplemental Table S1). And GPS 2.0 could be used for AUR family, Aurora-A, and Aurora-B, respectively. Because of the data limitation, certain kinases contain very few known phosphorylation sites. For example, the numbers of GRK-1, GRK-2, GRK-3, GRK-4, and GRK-5 sites were 8, 28, 4, 4, and 11, respectively (see supplemental Table S3), whereas the number of GRK family sites was 84. When the data set is too small, the prediction robustness will be low. However, GPS 2.0 provided a hierarchical classification, and the experimentalist could choose the proper predictor for computing. The training data set was taken from Phospho.ELM 6.0 (21), containing 3,161 verified phosphorylation sites with respective kinase information. These sites were then hierarchically clustered into groups, families, subfamilies, and kinases. The Java programming language was used for the implementation of the on-line service and stand alone software of GPS 2.0 (Fig. 5). The current version contained 144 serine/threonine and 69 tyrosine PK clusters and could predict kinase-specific phosphorylation sites for 408 human PKs in hierarchy (see supplemental Tables S1, S2, and S3).
Fig. 4.

The process of construction of GPS 2.0 software. The training data were taken from the Phospho.ELM 6.0 database. All sites with kinase information were retained. Then these verified sites with their kinases were separated into a hierarchical structure with four levels, including group, family, subfamily, and single PK. The modified version of Group-based Phosphorylation Scoring algorithm was used. The matrix mutation was used to improve the robustness of the prediction system. Then we set the high, medium, and low thresholds based on the calculated FPR for each PK cluster. Finally GPS 2.0 was implemented in Java as the first stand alone software for computational phosphorylation.
Fig. 5.

The screen snapshot of GPS 2.0 software. As an example, the protein sequence of rat Spinophilin was adopted. And the prediction results of PKA-specific sites with medium threshold are shown. DMPK, myotonic dystrophy protein kinase; PKC, protein kinase C; PKG, protein kinase G; RSK, ribosomal S6 kinase; SGK, serum- and glucocorticoid-regulated protein kinase; TKL, tyrosine kinase-like.
Matrix Mutation to Improve the Robustness of the Prediction System—
In our previous work, the BLOSUM62 matrix was used to score the similarity between known phosphorylation sites and a given site (10–12). However, the performance of BLOSUM62 in comparison with other matrices was not evaluated. Here we used PKA as an example to depict the matrix selection. We tested the prediction performances of PKA for ∼60 matrices (BLOSUM30–100 and PAM10–500, etc.). Both self-consistency and leave-one-out validation were calculated for comparison. Theoretically the performances of the self-consistency and jackknife validation of a perfect predictor should be very similar. Performance comparisons for eight typical matrices are shown (Fig. 6). Although the self-consistency performances of BLOSUM90, PAM10, and PAM90 were very high, their leave-one-out validations were quite low. The leave-one-out validations of BLOSUM30, BLOSUM45, PAM250, and PAM500 were more similar to their self-consistency performances. However, both performances were lower than that of BLOSUM62. To balance the prediction performance and robustness of the prediction system, the BLOSUM62 matrix was adopted in GPS 2.0.
Fig. 6.

Comparison of various scoring matrices. Self, self-consistency. The BLOSUM62 matrix was adopted to balance the prediction performance and robustness of GPS 2.0.
Because different matrices will generate various performances, an interesting question is whether we can find an optimal or near-optimal matrix for each PK groups to improve the system stability without influencing the prediction performance significantly. To address this question, we developed a simple method to automatically mutate BLOSUM62 into a near-optimal matrix for each PK groups. First the performance (Sn and Sp) of leave-one-out validation for each PK group was calculated. Then we fixed Sp at 90% to improve Sn by matrix mutation. Using this approach, the leave-one-out validations of most of the PK groups were improved significantly, whereas the self-consistency performances were only influenced moderately (Fig. 7). For example, with an Sp of 90%, the leave-one-out validation (LOO) Sn values of AGC/PKA, AGC/AKT, CaMK/CaMKII, and CMGC/CDK were increased from 80.7, 85.7, 67.4, and 81.8% to 89.6, 92.9, 81.4, and 88.7%, respectively, whereas their self-consistency Sn values were altered from 87.5, 96.4, 97.7, and 88.5% to 91.1, 98.8, 96.5, and 92.1%, respectively (Table I).
Fig. 7.

Prediction performances before and after matrix mutations. For instance, we randomly chose 12 PK clusters to compare the performances. Usually the leave-one-out validations will be improved significantly. But the self-consistencies were only enhanced moderately. Thus, the process of matrix mutation improved both performance and robustness of GPS 2.0. MM, matrix mutation; Self, self-consistency; PKC, protein kinase C; RSK, ribosomal S6 kinase; MAPKAPK, MAPK-activated protein kinase.
Table I.
Matrix mutation
The procedure of matrix mutation improved the leave-one-out validation significantly, whereas the self-consistency performance was only moderately influenced. Here we fixed Sp at 90% to improve Sn by matrix mutation. PKC, protein kinase C; MAPKAPK, MAPK-activated protein kinase.
| PK cluster | Before MMa
|
After MMb
|
||
|---|---|---|---|---|
| Selfc | LOOd | Self | LOO | |
| % | % | |||
| AGC/PKA | 87.5 | 82.2 | 91.1 | 89.6 |
| AGC/PKC/α | 90.0 | 49.2 | 78.3 | 68.3 |
| Atypical/PIKK | 90.1 | 62.6 | 96.7 | 86.8 |
| CaMK/CaMKII/CaMKII-α | 100.0 | 69.0 | 100.0 | 93.1 |
| AGC/AKT | 96.4 | 86.9 | 98.8 | 92.9 |
| AGC/GRK | 90.5 | 52.3 | 98.8 | 61.9 |
| AGC/PKC | 72.7 | 64.1 | 79.2 | 75.0 |
| AGC/RSK | 98.2 | 76.8 | 100.0 | 83.9 |
| CaMK/CaMKII | 97.7 | 67.4 | 96.5 | 81.4 |
| CaMK/MAPKAPK | 100.0 | 43.8 | 100.0 | 62.5 |
| CMGC/CDK | 88.5 | 83.8 | 92.1 | 88.1 |
| Other/CK2 | 77.6 | 74.3 | 80.2 | 78.8 |
Before matrix mutation.
After matrix mutation.
Self, self-consistency Sn.
LOO, the Sn of leave-one-out validation.
Comparisons of GPS 2.0 with Other Existing Tools—
Here we compared the prediction performances of GPS 2.0 with several other existing tools, including ScanSite (14), KinasePhos (1.0 and 2.0) (15, 16), NetPhosK (13), and pkaPS (6). Because the leave-one-out validations for these programs were unavailable, we focused on the comparison of the self-consistency performances.
We chose four well known PK groups for comparison, including AGC/PKA, atypical/PIKK/ATM, CMGC/CDK/CDC2/CDC2, and TK/Src/Src. Both the positive and negative data sets we tested for GPS 2.0 were submitted on these on-line services directly. And the measurements of Sn and Sp were calculated for each program, respectively. Then we fixed the Sp to be nearly equal to that in other tools and compared the Sn values (Table II). For PKA site prediction, only ScanSite with a high threshold (Sp of 99.91%) was better than GPS 2.0 with Sn of 16.91 versus 8.61%. However, when the medium or low threshold was chosen, GPS 2.0 was better than ScanSite. As for CDC2, ScanSite under medium and high thresholds, KinasePhos 1.0 with 100% Sp, and KinasePhos 2.0 were better, whereas the performance of GPS 2.0 was comparable with the three tools. However, for both ATM and Src, GPS 2.0 was the best predictor in all circumstances. Taken together, GPS 2.0 is better or at least comparable with previously established programs.
Table II.
Comparison of GPS 2.0 with previous prediction tools, including ScanSite, KinasePhos 1.0 and 2.0, NetPhosK, and pkaPS
Both the positive and negative data we tested for GPS 2.0 were submitted on these Web servers. And we fixed Sp to be similar with that used in previous tools to compare the Sn values. The performances with better values than those from GPS 2.0 are bold.
| Predictors and threshold | PKA
|
ATM
|
CDC2
|
Src
|
||||
|---|---|---|---|---|---|---|---|---|
| Sn | Sp | Sn | Sp | Sn | Sp | Sn | Sp | |
| % | % | % | % | |||||
| ScanSite | ||||||||
| Low | 69.14 | 95.02 | 54.55 | 93.67 | 73.08 | 95.13 | 28.68 | 95.28 |
| Medium | 42.43 | 99.17 | 27.27 | 98.57 | 29.23 | 99.26 | 11.76 | 99.37 |
| High | 16.91 | 99.91 | 18.18 | 99.70 | 8.46 | 99.84 | 3.68 | 99.94 |
| KinasePhos 1.0 | ||||||||
| 90% | 85.16 | 90.64 | 89.09 | 83.86 | 72.31 | 86.37 | 47.06 | 89.93 |
| 95% | 80.12 | 94.50 | 87.27 | 89.76 | 63.08 | 92.69 | 38.24 | 93.91 |
| 100% | 58.46 | 98.42 | 81.82 | 96.04 | 48.46 | 97.99 | 25.00 | 97.84 |
| KinasePhos 2.0 | 55.19 | 89.20 | 89.09 | 38.12 | 13.08 | 99.72 | 86.86 | 55.97 |
| NetPhosK | 77.74 | 91.18 | 85.45 | 97.60 | 16.92 | 87.79 | 33.09 | 95.39 |
| pkaPS | 89.61 | 90.81 | ||||||
| GPS 2.0 | 83.09 | 95.04 | 100.00 | 94.03 | 77.96 | 95.16 | 54.02 | 95.34 |
| 49.26 | 99.17 | 72.73 | 98.62 | 23.12 | 99.26 | 17.24 | 99.43 | |
| 8.61 | 99.91 | 32.73 | 99.70 | 7.53 | 99.84 | 3.83 | 99.93 | |
| 89.91 | 90.75 | —a | — | 93.01 | 86.41 | 66.28 | 89.96 | |
| 84.57 | 94.49 | — | — | 89.78 | 92.71 | 57.09 | 94.05 | |
| 64.39 | 98.43 | 98.18 | 96.04 | 46.77 | 97.99 | 37.93 | 97.85 | |
| 91.69 | 89.25 | — | — | 9.14 | 99.72 | 91.19 | 56.03 | |
| 89.61 | 91.26 | 87.27 | 97.61 | 91.94 | 87.84 | 52.87 | 95.44 | |
| 89.91 | 90.91 | |||||||
Not compared because both Sn and Sp of GPS 2.0 were better.
A Large Scale Prediction of Kinase-specific Phosphorylation Sites in Mammals—
Estimation and control of false positive prediction is the key point in large scale predictions of kinase-specific phosphorylation sites. The FPR is the proportion of negative sites that are erroneously predicted as positive hits. From our analysis, the real phosphorylation sites were only a very small part of all Ser/Thr residues in proteins (see supplemental Tables S2 and S3). For 144 serine/threonine PK groups, the ratios of positive sites versus the negative sites range from 1:13.2 (other/PEK: 16 positive sites and 211 negative sites) to 1:141.2 (CaMK/CaMKI/CaMKIV: nine positive sites with 1,271 negative sites) with the average being 1:49. And for 69 tyrosine PK groups, the ratios of positive sites versus the negative sites range from 1:1.6 (TK/Trk/TRKA: five positive sites with eight negative sites) to 1:28.2 (TK/Csk: five positive sites and 141 negative sites) with the average being 1:9.7. Thus, even a very small FPR could generate too many false positive hits.
Given a data set containing all non-phosphorylation sites, the real FPR could be easily computed. However, precise calculation of FPR is unavailable because of the lack of a “gold standard” negative data set. Here we randomly generated 10,000 PSP(7, 7) peptides to construct a near-negative data set based on the real frequencies of the 20 amino acids in eukaryotic proteomes. Although a few sites were predicted to be real hits, the proportion would be very small. The process was repeated 20 times, and the average FPR was calculated by GPS 2.0 as the theoretically maximal FPR. Then for large scale predictions, we defined the precision (Pr) as follows.
 |
(Eq. 6) |
Here N is the number of sites (Ser/Thr or Tyr) for prediction; M is the number of predicted sites by GPS 2.0. Because the FPR is the theoretically maximal false positive rate, the Pr is the minimal proportion of correct predictions.
For any given kinase, the total Ser/Thr or Tyr residues in a proteome could be divided into three groups, including sites phosphorylated by the kinase, sites phosphorylated by other kinases, and non-phosphorylation sites. For the kinase, sites of the latter two groups would be regarded as “negative hits” for prediction. Because most sites in a proteome are non-phosphorylation sites, the number of negative sites for the kinase is too large. Thus, it would not make sense to carry out a large scale prediction for a proteome directly. Currently there are many small scale and large scale experiments to identify phosphorylation sites. And most of these sites are integrated in the Phospho.ELM database (21). From Phospho.ELM 6.0, there were 13,254 mammalian sites, including 9,717 Ser(P), 1,818 Thr(P), and 1,719 Tyr(P) sites (Table III). These sites were experimentally identified, but the kinase information of more than 10,000 sites still remains to be annotated. Most importantly, in the data set, the non-phosphorylation sites were excluded. And the number of potentially negative hits for a given kinase was greatly reduced. In this regard, a properly defined FPR will be useful to evaluate the prediction accuracy.
Table III.
Data analyses of a large scale prediction for kinase-specific sites in mammalian proteomes
Among 13,254 sites identified by Phospho.ELM 6.0 in mammals, GPS 2.0 can predict 12,219 sites with at least one cognate kinase. Pro., proteins.
| Phospho.ELM 6.0 | Mammalian | Predicted | Coverage |
|---|---|---|---|
| % | |||
| Total | |||
| Sites | 13,254 | 12,219 | 92.19 |
| Pro. | 4,291 | 4,071 | 94.87 |
| Ser(P) | |||
| Sites | 9,717 | 9,195 | 94.63 |
| Pro. | 3,444 | 3,325 | 96.54 |
| Thr(P) | |||
| Sites | 1,818 | 1,551 | 85.31 |
| Pro. | 1,200 | 1,048 | 87.33 |
| Tyr(P) | |||
| Sites | 1,719 | 1,473 | 85.69 |
| Pro. | 885 | 768 | 86.78 |
In this work, we performed a large scale prediction of kinase-specific phosphorylation sites in mammals to compare with the phosphorylation sites in Phospho.ELM 6.0. The high threshold of GPS 2.0 was chosen with an FPR of 2% for serine/threonine kinases and 4% for tyrosine kinases. The predictor for budding yeast IPL1 was not used. We divided the data set into three groups, the known substrates of a PK for prediction (Known sub.), the known substrates of other kinases (Other's sub.), and the sites without PK information (Unknown sub.) (supplemental Table S4). For example, there were 306 sites experimentally identified as PKA sites in mammals. And 1,993 sites were verified as substrates of other PKs with 9,236 unannotated sites. For the first group (Known sub.), the Sn was calculated to depict the proportion of which we can correctly predict for the existing sites. And for the latter two groups, the Pr was calculated to estimate the minimal accuracy for large scale predictions, respectively.
For 143 serine/threonine and 69 tyrosine PK groups, the Sn values for known substrates and Pr values for unknown data were calculated, respectively. Most of the prediction results were obtained with satisfying performances (see supplemental Fig. S2). For example, GPS 2.0 could predict 200 of 306 known PKA sites as positive hits with an Sn of 65.36%. And for 1,993 sites phosphorylated by other PKs, GPS 2.0 could predict 220 of them as positive hits with a Pr of 81.88%, meaning that at least 81.88% of the 220 predicted sites might be positive sites. Again for 9,236 unannotated sites, GPS 2.0 could predict 959 of them as positive sites with a Pr of 80.74%. However, if there were very few real positive sites in the entire data set, the occurrence of real positive sites should be even lower than randomly generated data, and the Pr value could be very small and even lower than 0, which indicates the under-representation of substrates of the subject kinase in a given data set. In our analysis, there were 53 PK groups (25% of 212 PK groups) with low performances. In total, there were 12,219 sites predicted with at least one PK with a total coverage of 92.19% (Table III).
Prediction of Potential Aurora-B Substrates from Its Interacting Proteins—
As described previously, protein kinase Aurora-B is a component of the Aurora/Ipl1 family and plays important roles in chromosome segregation (24–26) and progression of cytokinesis (27). During mitosis, Aurora-B localizes on the kinetochore and forms a protein complex with Survivin, INCENP (inner centromere protein), and Borealin in metaphase (26). Then it moves to the midbody in cytokinesis (27). Proteins phosphorylated by Aurora-B regulate their functions and dynamics during cell division. In this regard, identification of Aurora-B substrates with their sites will be important for understanding the molecular mechanisms of cell division.
In this study, we performed a comprehensive prediction for Aurora-B substrates with respective phosphorylation sites in human. As discussed previously, a short peptide flanking a site is not sufficient for providing full specificity for a PK modification in vivo (28, 29). Numerous mechanisms have also been proposed to account for the specificity for PK recognition, such as subcellular co-localization of PKs with their substrates, co-complex, or interacting directly (28–30). Thus, in vivo a PK should at least “kiss” its substrates and then say farewell by direct or indirect interactions. Here we adopted this “kiss-then-farewell” model and predicted Aurora-B substrates with their sites from its interacting proteins.
Both the experimental and predicted protein-protein interaction databases were used. The human experimental protein-protein interaction (PPI) data were derived from the Database of Interacting Proteins (DIP) (31), BioGrid (32), the Molecular Interaction Database (MINT) (33), the Biomolecular Interaction Network Database (BIND) (34), and the Human Protein Reference Database (HPRD) (35) with 1,397, 38,217, 8,127, 43,412, and 33,710 entries. These data sets were integrated into a non-redundant set with a total number of 51,529 records. For predicted PPI data, we simply used the Search Tool for the Retrieval of Interacting Genes/Proteins (STRING database) with 690,143 precalculated PPI entries (36). Both experimentally verified and predicted PPI data were mapped to the UniProt database by BLAST for normalization of protein accession numbers. In total in Phospho.ELM 6.0, there were 140 human proteins containing 605 Ser(P)/Thr(P) sites identified as Aurora-B-interacting proteins. The high threshold of GPS 2.0 was used with an FPR of 2%. Then 48 sites from 32 proteins were predicted as positive hits (Table IV). The total Pr of the prediction was calculated as (48 − (605 × 2%))/48 = 74.79%.
Table IV.
A proteome-wide prediction of Aurora-B-specific substrate sites
The predicted phosphorylation sites are bold. ROCK, Rho kinase; PKC, protein kinase C; LOK, lymphocyte-oriented kinase; PAK, p21-activated kinase; GFAP, glial fibrillary acidic protein; DES, desmin; NES, nestin; VIM, vimentin; AURKA, Aurora kinase A; CENPA, centromere protein A; BPTF, bromodomain PHD finger transcription factor; MCAK, mitotic centromere-associated kinesin; INCENP, inner centromere protein.
| Substrate | Phospho.ELM | Site | Peptide | GPS score | Known kinases |
|---|---|---|---|---|---|
| HEC1 | O14777 | 5 | ---MKRSSVSSGGAG | 6.1515 | Aurora-B |
| O14777 | 15 | SGGAGRLSMQELRSQ | 4.8788 | Aurora-B | |
| O14777 | 49 | KLSINKPTSERKVSL | 3.8182 | Aurora-B | |
| O14777 | 55 | PTSERKVSLFGKRTS | 5.3636 | Aurora-B | |
| O14777 | 62 | SLFGKRTSGHGSRNS | 3.2424 | ||
| O14777 | 69 | SGHGSRNSQLGIFSS | 4.303 | Aurora-B | |
| AURKA | O14965 | 288 | APSSRRTTLCGTLDY | 5.8485 | PKA, Aurora-A |
| PPP1R12A | O14974 | 696 | ARQSRRSTQGVTLTD | 5.0606 | ROCK1 |
| Survivin | O15392 | 117 | KNKIAKETNNKKKEF | 4.2424 | Aurora-B |
| VIM | P08670 | 65 | GVYATRSSAVRLRSS | 4.303 | PAK |
| P08670 | 72 | SAVRLRSSVPGVRLL | 4.5758 | PAK, ROCK, Aurora-B | |
| GFAP | P14136 | 7 | -MERRRITSAARRSY | 8.303 | ROCK, Aurora-B |
| P14136 | 13 | ITSAARRSYVSSGEM | 7.5152 | ROCK, PKC, CaMKII, Aurora-B | |
| P14136 | 38 | LGPGTRLSLARMPPP | 4.5455 | ROCK, PKC, CaMKII, Aurora-B | |
| STMN1 | P16949 | 62 | AAEERRKSHEAEVLK | 5.8182 | PKA |
| DES | P17661 | 11 | YSSSQRVSSYRRTFG | 4.7576 | Aurora-B |
| P17661 | 16 | RVSSYRRTFGGAPGF | 5.2727 | ROCK, Aurora-B | |
| P17661 | 59 | VYQVSRTSGGAGGLG | 4.8788 | Aurora-B | |
| LMNB1 | P20700 | 27 | PLSPTRLSRLQEKEE | 3.303 | |
| PSMA3 | P25788 | 242 | AEKYAKESLKEEDES | 3.1818 | CK2 |
| CDC25B | P30305 | 353 | VQNKRRRSVTPPEEQ | 6 | Aurora-A |
| BDKRB2 | P30411 | 373 | SMGTLRTSISVERQI | 3.6364 | GRK-4, PKC |
| NES | P48681 | 767 | ETQQRRRSLGEQDQM | 6.8788 | |
| CENPA | P49450 | 7 | -MGPRRRSRKPEAPR | 6.3636 | Aurora-A, Aurora-B |
| PLK1 | P53350 | 137 | LELCRRRSLLELHKR | 3.2424 | |
| P53350 | 210 | YDGERKKTLCGTPNY | 3.2121 | LOK | |
| H3.1 | P68431 | 10 | TKQTARKSTGGKAPR | 10.1212 | Aurora-A, Aurora-B |
| P68431 | 28 | ATKAARKSAPATGGV | 8.9091 | MAPK, Aurora-B | |
| MDM2 | Q00987 | 157 | SHLVSRPSTSSRRRA | 4.0909 | |
| KIF23 | Q02241 | 911 | NGSRKRRSSTVAPAQ | 6.303 | |
| Q02241 | 912 | GSRKRRSSTVAPAQP | 6.3939 | ||
| RELA | Q04206 | 276 | SMQLRRPSDRELSEP | 3.2121 | RSK-5 |
| BPTF | Q12830 | 77 | PRVHRPRSPILEEKD | 3.0303 | |
| TP53BP1 | Q12888 | 1460 | GAGALRRSDSPEIPF | 3.2424 | |
| CBX3 | Q13185 | 93 | KDGTKRKSLSDSESD | 5.1212 | |
| PIN1 | Q13526 | 16 | PGWEKRMSRSSGRVY | 3.1818 | PKA |
| IFI16 | Q16666 | 132 | GAQKRKKSTKEKAGP | 4.8485 | CK2 |
| RCC1 | Q6NT97 | 11 | KRIAKRRSPPADAIP | 4.4545 | |
| FLJ37981 | Q8N1Q3 | 73 | ETSSLRNSQSENSSL | 5 | |
| MCAK | Q99661 | 95 | IQKQKRRSVNSKIPA | 7.5455 | Aurora-B |
| RACGAP1 | Q9H0H5 | 387 | ETGLYRISGCDRTVK | 3.7879 | Aurora-B |
| INCENP | Q9NQS7 | 897 | KPRYHKRTSSAVWNS | 4.1515 | Aurora-B |
| Q9NQS7 | 898 | PRYHKRTSSAVWNSP | 5.7273 | Aurora-B | |
| Q9NQS7 | 899 | RYHKRTSSAVWNSPP | 3.1818 | Aurora-B | |
| TD-60 | Q9P258 | 43 | RERPERCSSSSGGGS | 4.1515 | |
| BAZ1B | Q9UIG0 | 189 | EDEGRRESINDRARR | 5.7576 | |
| Q9UIG0 | 1342 | KRSSRRQSLELQKCE | 4.6061 | ||
| CDC23 | Q9UJX2 | 582 | NTPTRRVSPLNLSSV | 3.7879 |
Our analysis had precisely predicted 21 of 26 (Sn of ∼81%) experimentally verified Aurora-B sites in human (Table IV). In addition, several novel substrates with potential sites were identified in silico. For example, although human TD-60 is co-localized with Survivin on the kinetochore (37), its phosphorylation by Aurora-B was never reported. We predicted that human TD-60 could be phosphorylated by Aurora-B at Ser-43. In addition, although HP1γ/CBX3 is localized on the centromeric region nearby the kinetochore (38), its phosphorylation by Aurora-B was unclear. Here we predicted that HP1γ/CBX3 could be phosphorylated by Aurora-B at Ser-93. Moreover we also predicted another kinetochore-associated kinase, PLK1 (39), as a novel substrate of Aurora-B that is phosphorylated at both Ser-137 and Thr-210.
Taken together, using GPS 2.0 and protein-protein interaction information, we successfully predicted that 32 proteins containing 48 Ser(P)/Thr(P) sites are novel Aurora-B substrates. Although the accuracy and physiology of the aforementioned phosphorylation sites remain to be validated by experimentation, our analyses performed with GPS 2.0 provide an outline of how mitotic Aurora-B phosphorylation regulates protein-protein interaction plasticity and dynamics.
DISCUSSION
In this work, we refined our previous established protein phosphorylation predication program GPS 1.10 (Group-based Phosphorylation Scoring) into a higher version, 2.0. In addition, the software was renamed as Group-based Prediction System because numerous PKs were clustered into a hierarchical structure with four levels, including group, family, subfamily, and single PK (20). Then the on-line server and local packages of GPS 2.0 were implemented in Java with a modified version of the Group-based Phosphorylation Scoring algorithm (10, 11). The GPS 2.0 Web server was tested on several Internet browsers, including Internet Explorer 6.0, Netscape Browser 8.1.3, and Firefox 2 under the Windows XP operating system (OS), Mozilla Firefox 1.5 of Fedora Core 6 OS (Linux), and Safari 3.0 of Apple Mac OS X 10.4 (Tiger) and 10.5 (Leopard). For Windows and Linux systems, the latest version of the Java Runtime Environment (JRE) package (Java 1.4.2 or later versions) of Sun Microsystems should be preinstalled for using GPS 2.0 program. However, for Mac OS, GPS 2.0 could be directly used without any additional packages. Furthermore users could directly install the local packages of GPS 2.0 on their own computers. Again the local packages of GPS 2.0 support three major OSs, including Windows, Unix/Linux, and Mac.
The performance and robustness of the prediction system were extensively evaluated by self-consistency, leave-one-out validation, and 4-, 6-, 8-, and 10-fold cross-validations. Then we compared the prediction performances of GPS 2.0 with several other existing tools, including ScanSite (14), KinasePhos (1.0 and 2.0) (15, 16), NetPhosK (13), and pkaPS (6). ScanSite constructs a position-specific scoring matrix for each kinase based on its known phosphorylation sites (14). And KinasePhos 1.0 uses a maximal dependence decomposition strategy and constructs a profile hidden Markov model for each kinase (15), whereas KinasePhos 2.0 retrieves the coupling patterns (XdZ where amino acid types X and Z are separated by d amino acids) from the known phosphorylation sites and uses the Support Vector Machines algorithm to train the model (16). Also NetPhosK uses an artificial neural network method for training (13). These tools first retrieve the information from each position flanking the modified residue (Ser/Thr or Tyr). A hidden hypothesis in their model is that the information/function/evolution of each position is independent from its nearby residues. However, the information/function/evolution of each position is not entirely independent. GPS 1.0 and 1.10 (10, 11), GPS 2.0, and pkaPS (6) hypothesize that if two PSPs share high sequence homology they may also bear similar three-dimensional structures and biological functions. Thus, the information of the PSPs was considered rather than single positions. In this regard, the methods used in GPS 1.0 and 1.10 (10, 11), GPS 2.0, and pkaPS (6) will be superior to other strategies. Also the prediction performances will be enhanced with a larger training data set. And the training data set of GPS 2.0 was much larger than that for the other tools. Furthermore we noticed that the prediction performances based on different amino acids matrices were not identical. The BLOSUM62 and other matrices are optimized to evaluate the similarity between homologous proteins but may not be optimized for the similarity of two PSPs. To find an optimal or near-optimal matrix for each PK group to improve the system stability without influencing the prediction performance significantly, we developed a simple method to automatically mutate BLOSUM62 into a near-optimal matrix for each PK group. The prediction performances of GPS 2.0 were further improved by this approach. By comparison, the method of GPS 2.0 was better or at least comparable with previous approaches on several well studied PKs. However, GPS 2.0 could predict kinase-specific phosphorylation sites for 408 human PKs, demonstrating a great comprehensive capacity and computational power.
Previously control and calculation of FPR were never addressed. Here we developed a simple approach to estimate the theoretically maximal FPR for each PK cluster. We also defined the Pr factor to estimate the proportion of real phosphorylation sites in predicted results. Previously the precision was defined as TP/(TP + FP) (15). However, the TP is usually unknown when an unknown data set is used for prediction. Thus, a hidden hypothesis for such a precision is that the ratio of calculated TP:FP is not changed in any given data set. The precision will be precalculated based on the training data set. However, when the composition of a given data set is changed and different from the training data set, such a precision will not be useful and valid any more. In this regard, the Pr value should be flexible and reflect the enrichment of substrates of the subject kinase in any given data sets. Given a data set for prediction (N sites), if all of the sites were true negative sites, we can easily calculate the theoretically maximal false positive hits as N × FPR. Then Pr value could be calculated by (M − (N × FPR))/M where M is the total predicted hits. Because there might be real phosphorylation sites contained in the data set, our approach will underestimated the real precision.
As an application to depict the computational power, we performed a large scale prediction of more than 13,000 phosphorylation sites in mammals with high precisions. The high threshold was chosen with an FPR of 2% for serine/threonine kinases and 4% for tyrosine kinases. In addition, we provided a proteome-wide prediction for Aurora-B-specific substrates including protein-protein interaction information. As the first stand alone software for computational phosphorylation, GPS 2.0 will accelerate experimentation for delineating a kinase-coupled phosphoregulatory network and pathways underlying cellular plasticity and dynamics.
Supplementary Material
Acknowledgments
We thank the anonymous reviewer, whose suggestion has greatly improved the presentation of this manuscript.
Footnotes
Published, MCP Papers in Press, May 6, 2008, DOI 10.1074/mcp.M700574-MCP200
The abbreviations used are: PTM, post-translational modification; PK, protein kinase; FPR, false positive rate; GPS, Group-based Prediction System; Sn, sensitivity; Sp, specificity; Pr, precision; LOO, leave-one-out validation; PSP, phosphorylation site peptide; PKA, protein kinase A; PKB, protein kinase B; BLAST, Basic Local Alignment Search Tool; CDK, cycle-dependent kinase; MAPK, mitogen-activated protein kinase; AUR, Aurora; GRK, G-protein-coupled receptor kinase; CaMK, Ca2+/calmodulin-dependent protein kinase; TK, tyrosine kinase; PIKK, phosphoinositide 3-kinase-related kinase; ATM, ataxia telangiectasia mutated; PEK, pancreatic eukaryotic initiation factor-2a kinase; sub., substrate; PPI, protein-protein interaction; OS, operating system; TP, true positive; TN, true negative; FP, false positive; FN, false negative; PPSP, prediction of PK-specific phosphorylation; AGC, protein kinase A, G and C family; CGMC, CDKs, G-SKs, MAPKs and CLKs kinase family.
This work was supported, in whole or in part, by National Institutes of Health Grant DK56292. This work was also supported by Chinese 973 Project Grants 2002CB713700, 2006CB943603, 2007CB914503, and 2006CB933300; Chinese Academy of Sciences Grants KSCX1-YW-R65, KSCX2-YW-21, and KJCX2-YW-M02; Chinese Natural Science Foundation Grants 39925018, 30270293, 90508002, and 30700138. The costs of publication of this article were defrayed in part by the payment of page charges. This article must therefore be hereby marked “advertisement” in accordance with 18 U.S.C. Section 1734 solely to indicate this fact.
The on-line version of this article (available at http://www.mcponline.org) contains supplemental material.
REFERENCES
- 1.Zhou, F. F., Xue, Y., Yao, X., and Xu, Y. ( 2006) A general user interface for prediction servers of proteins’ post-translational modification sites. Nat. Protocol. 1, 1318–1321 [DOI] [PubMed] [Google Scholar]
- 2.Iakoucheva, L. M., Radivojac, P., Brown, C. J., O'Connor, T. R., Sikes, J. G., Obradovic, Z., and Dunker, A. K. ( 2004) The importance of intrinsic disorder for protein phosphorylation. Nucleic Acids Res. 32, 1037–1049 [DOI] [PMC free article] [PubMed] [Google Scholar]
- 3.Blom, N., Gammeltoft, S., and Brunak, S. ( 1999) Sequence and structure-based prediction of eukaryotic protein phosphorylation sites. J. Mol. Biol. 294, 1351–1362 [DOI] [PubMed] [Google Scholar]
- 4.Ingrell, C. R., Miller, M. L., Jensen, O. N., and Blom, N. ( 2007) NetPhosYeast: prediction of protein phosphorylation sites in yeast. Bioinformatics 23, 895–897 [DOI] [PubMed] [Google Scholar]
- 5.Tang, Y. R., Chen, Y. Z., Canchaya, C. A., and Zhang, Z. ( 2007) GANNPhos: a new phosphorylation site predictor based on a genetic algorithm integrated neural network. Protein Eng. Des. Sel. 20, 405–412 [DOI] [PubMed] [Google Scholar]
- 6.Neuberger, G., Schneider, G., and Eisenhaber, F. ( 2007) pkaPS: prediction of protein kinase A phosphorylation sites with the simplified kinase-substrate binding model. Biol. Direct 2, 1. [DOI] [PMC free article] [PubMed] [Google Scholar]
- 7.Brinkworth, R. I., Munn, A. L., and Kobe, B. ( 2006) Protein kinases associated with the yeast phosphoproteome. BMC Bioinformatics 7, 47. [DOI] [PMC free article] [PubMed] [Google Scholar]
- 8.Chang, E. J., Begum, R., Chait, B. T., and Gaasterland, T. ( 2007) Prediction of cyclin-dependent kinase phosphorylation substrates. PLoS ONE 2, e656. [DOI] [PMC free article] [PubMed] [Google Scholar]
- 9.Linding, R., Jensen, L. J., Ostheimer, G. J., van Vugt, M. A., Jorgensen, C., Miron, I. M., Diella, F., Colwill, K., Taylor, L., Elder, K., Metalnikov, P., Nguyen, V., Pasculescu, A., Jin, J., Park, J. G., Samson, L. D., Woodgett, J. R., Russell, R. B., Bork, P., Yaffe, M. B., and Pawson, T. ( 2007) Systematic discovery of in vivo phosphorylation networks. Cell 129, 1415–1426 [DOI] [PMC free article] [PubMed] [Google Scholar]
- 10.Xue, Y., Zhou, F., Zhu, M., Ahmed, K., Chen, G., and Yao, X. ( 2005) GPS: a comprehensive www server for phosphorylation sites prediction. Nucleic Acids Res. 33, W184–W187 [DOI] [PMC free article] [PubMed] [Google Scholar]
- 11.Zhou, F. F., Xue, Y., Chen, G. L., and Yao, X. ( 2004) GPS: a novel group-based phosphorylation predicting and scoring method. Biochem. Biophys. Res. Commun. 325, 1443–1448 [DOI] [PubMed] [Google Scholar]
- 12.Xue, Y., Li, A., Wang, L., Feng, H., and Yao, X. ( 2006) PPSP: prediction of PK-specific phosphorylation site with Bayesian decision theory. BMC Bioinformatics 7, 163. [DOI] [PMC free article] [PubMed] [Google Scholar]
- 13.Blom, N., Sicheritz-Ponten, T., Gupta, R., Gammeltoft, S., and Brunak, S. ( 2004) Prediction of post-translational glycosylation and phosphorylation of proteins from the amino acid sequence. Proteomics 4, 1633–1649 [DOI] [PubMed] [Google Scholar]
- 14.Obenauer, J. C., Cantley, L. C., and Yaffe, M. B. ( 2003) Scansite 2.0: proteome-wide prediction of cell signaling interactions using short sequence motifs. Nucleic Acids Res. 31, 3635–3641 [DOI] [PMC free article] [PubMed] [Google Scholar]
- 15.Huang, H. D., Lee, T. Y., Tzeng, S. W., and Horng, J. T. ( 2005) KinasePhos: a web tool for identifying protein kinase-specific phosphorylation sites. Nucleic Acids Res. 33, W226–W229 [DOI] [PMC free article] [PubMed] [Google Scholar]
- 16.Wong, Y. H., Lee, T. Y., Liang, H. K., Huang, C. M., Wang, T. Y., Yang, Y. H., Chu, C. H., Huang, H. D., Ko, M. T., and Hwang, J. K. ( 2007) KinasePhos 2.0: a web server for identifying protein kinase-specific phosphorylation sites based on sequences and coupling patterns. Nucleic Acids Res. 35, W588–W594 [DOI] [PMC free article] [PubMed] [Google Scholar]
- 17.Kim, J. H., Lee, J., Oh, B., Kimm, K., and Koh, I. ( 2004) Prediction of phosphorylation sites using SVMs. Bioinformatics 20, 3179–3184 [DOI] [PubMed] [Google Scholar]
- 18.Brinkworth, R. I., Breinl, R. A., and Kobe, B. ( 2003) Structural basis and prediction of substrate specificity in protein serine/threonine kinases. Proc. Natl. Acad. Sci. U. S. A. 100, 74–79 [DOI] [PMC free article] [PubMed] [Google Scholar]
- 19.Li, T., Li, F., and Zhang, X. ( 2008) Prediction of kinase-specific phosphorylation sites with sequence features by a log-odds ratio approach. Proteins 70, 404–414 [DOI] [PubMed] [Google Scholar]
- 20.Manning, G., Whyte, D. B., Martinez, R., Hunter, T., and Sudarsanam, S. ( 2002) The protein kinase complement of the human genome. Science 298, 1912–1934 [DOI] [PubMed] [Google Scholar]
- 21.Diella, F., Cameron, S., Gemund, C., Linding, R., Via, A., Kuster, B., Sicheritz-Ponten, T., Blom, N., and Gibson, T. J. ( 2004) Phospho.ELM: a database of experimentally verified phosphorylation sites in eukaryotic proteins. BMC Bioinformatics 5, 79. [DOI] [PMC free article] [PubMed] [Google Scholar]
- 22.Caenepeel, S., Charydczak, G., Sudarsanam, S., Hunter, T., and Manning, G. ( 2004) The mouse kinome: discovery and comparative genomics of all mouse protein kinases. Proc. Natl. Acad. Sci. U. S. A. 101, 11707–11712 [DOI] [PMC free article] [PubMed] [Google Scholar]
- 23.Puntervoll, P., Linding, R., Gemund, C., Chabanis-Davidson, S., Mattingsdal, M., Cameron, S., Martin, D. M., Ausiello, G., Brannetti, B., Costantini, A., Ferrè, F., Maselli, V., Via, A., Cesareni, G., Diella, F., Superti-Furga, G., Wyrwicz, L., Ramu, C., McGuigan, C., Gudavalli, R., Letunic, I., Bork, P., Rychlewski, L., Küster, B., Helmer-Citterich, M., Hunter, W. N., Aasland, R., and Gibson, T. J. ( 2003) ELM server: a new resource for investigating short functional sites in modular eukaryotic proteins. Nucleic Acids Res. 31, 3625–3630 [DOI] [PMC free article] [PubMed] [Google Scholar]
- 24.Gorbsky, G. J. ( 2004) Mitosis: MCAK under the aura of Aurora B. Curr. Biol. 14, R346–348 [DOI] [PubMed] [Google Scholar]
- 25.Lan, W., Zhang, X., Kline-Smith, S. L., Rosasco, S. E., Barrett-Wilt, G. A., Shabanowitz, J., Hunt, D. F., Walczak, C. E., and Stukenberg, P. T. ( 2004) Aurora B phosphorylates centromeric MCAK and regulates its localization and microtubule depolymerization activity. Curr. Biol. 14, 273–286 [DOI] [PubMed] [Google Scholar]
- 26.Honda, R., Korner, R., and Nigg, E. A. ( 2003) Exploring the functional interactions between Aurora B, INCENP, and survivin in mitosis. Mol. Biol. Cell 14, 3325–3341 [DOI] [PMC free article] [PubMed] [Google Scholar]
- 27.Kawajiri, A., Yasui, Y., Goto, H., Tatsuka, M., Takahashi, M., Nagata, K., and Inagaki, M. ( 2003) Functional significance of the specific sites phosphorylated in desmin at cleavage furrow: Aurora-B may phosphorylate and regulate type III intermediate filaments during cytokinesis coordinatedly with Rho-kinase. Mol. Biol. Cell 14, 1489–1500 [DOI] [PMC free article] [PubMed] [Google Scholar]
- 28.Biondi, R. M., and Nebreda, A. R. ( 2003) Signalling specificity of Ser/Thr protein kinases through docking-site-mediated interactions. Biochem. J. 372, 1–13 [DOI] [PMC free article] [PubMed] [Google Scholar]
- 29.Holland, P. M., and Cooper, J. A. ( 1999) Protein modification: docking sites for kinases. Curr. Biol. 9, R329–331 [DOI] [PubMed] [Google Scholar]
- 30.Yaffe, M. B., Leparc, G. G., Lai, J., Obata, T., Volinia, S., and Cantley, L. C. ( 2001) A motif-based profile scanning approach for genome-wide prediction of signaling pathways. Nat. Biotechnol. 19, 348–353 [DOI] [PubMed] [Google Scholar]
- 31.Salwinski, L., Miller, C. S., Smith, A. J., Pettit, F. K., Bowie, J. U., and Eisenberg, D. ( 2004) The Database of Interacting Proteins: 2004 update. Nucleic Acids Res. 32, D449–D451 [DOI] [PMC free article] [PubMed] [Google Scholar]
- 32.Stark, C., Breitkreutz, B. J., Reguly, T., Boucher, L., Breitkreutz, A., and Tyers, M. ( 2006) BioGRID: a general repository for interaction datasets. Nucleic Acids Res. 34, D535–D539 [DOI] [PMC free article] [PubMed] [Google Scholar]
- 33.Zanzoni, A., Montecchi-Palazzi, L., Quondam, M., Ausiello, G., Helmer-Citterich, M., and Cesareni, G. ( 2002) MINT: a Molecular INTeraction database. FEBS Lett. 513, 135–140 [DOI] [PubMed] [Google Scholar]
- 34.Alfarano, C., Andrade, C. E., Anthony, K., Bahroos, N., Bajec, M., Bantoft, K., Betel, D., Bobechko, B., Boutilier, K., Burgess, E., Buzadzija, K., Cavero, R., D'Abreo, C., Donaldson, I., Dorairajoo, D., Dumontier, M. J., Dumontier, M. R., Earles, V., Farrall, R., Feldman, H., Garderman, E., Gong, Y., Gonzaga, R., Grytsan, V., Gryz, E., Gu, V., Haldorsen, E., Halupa, A., Haw, R., Hrvojic, A., Hurrell, L., Isserlin, R., Jack, F., Juma, F., Khan, A., Kon, T., Konopinsky, S., Le, V., Lee, E., Ling, S., Magidin, M., Moniakis, J., Montojo, J., Moore, S., Muskat, B., Ng, I., Paraiso, J. P., Parker, B., Pintilie, G., Pirone, R., Salama, J. J., Sgro, S., Shan, T., Shu, Y., Siew, J., Skinner, D., Snyder, K., Stasiuk, R., Strumpf, D., Tuekam, B., Tao, S., Wang, Z., White, M., Willis, R., Wolting, C., Wong, S., Wrong, A., Xin, C., Yao, R., Yates, B., Zhang, S., Zheng, K., Pawson, T., Ouellette, B. F., and Hogue, C. W. ( 2005) The Biomolecular Interaction Network Database and related tools 2005 update. Nucleic Acids Res. 33, D418–D424 [DOI] [PMC free article] [PubMed] [Google Scholar]
- 35.Mishra, G. R., Suresh, M., Kumaran, K., Kannabiran, N., Suresh, S., Bala, P., Shivakumar, K., Anuradha, N., Reddy, R., Raghavan, T. M., Menon, S., Hanumanthu, G., Gupta, M., Upendran, S., Gupta, S., Mahesh, M., Jacob, B., Mathew, P., Chatterjee, P., Arun, K. S., Sharma, S., Chandrika, K. N., Deshpande, N., Palvankar, K., Raghavnath, R., Krishnakanth, R., Karathia, H., Rekha, B., Nayak, R., Vishnupriya, G., Kumar, H. G., Nagini, M., Kumar, G. S., Jose, R., Deepthi, P., Mohan, S. S., Gandhi, T. K., Harsha, H. C., Deshpande, K. S., Sarker, M., Prasad, T. S., and Pandey, A. ( 2006) Human protein reference database—2006 update. Nucleic Acids Res. 34, D411–D414 [DOI] [PMC free article] [PubMed] [Google Scholar]
- 36.von Mering, C., Jensen, L. J., Snel, B., Hooper, S. D., Krupp, M., Foglierini, M., Jouffre, N., Huynen, M. A., and Bork, P. ( 2005) STRING: known and predicted protein-protein associations, integrated and transferred across organisms. Nucleic Acids Res. 33, D433–D437 [DOI] [PMC free article] [PubMed] [Google Scholar]
- 37.Mollinari, C., Reynaud, C., Martineau-Thuillier, S., Monier, S., Kieffer, S., Garin, J., Andreassen, P. R., Boulet, A., Goud, B., Kleman, J. P., and Margolis, R. L. ( 2003) The mammalian passenger protein TD-60 is an RCC1 family member with an essential role in prometaphase to metaphase progression. Dev. Cell 5, 295–307 [DOI] [PubMed] [Google Scholar]
- 38.Obuse, C., Iwasaki, O., Kiyomitsu, T., Goshima, G., Toyoda, Y., and Yanagida, M. ( 2004) A conserved Mis12 centromere complex is linked to heterochromatic HP1 and outer kinetochore protein Zwint-1. Nat. Cell Biol. 6, 1135–1141 [DOI] [PubMed] [Google Scholar]
- 39.Arnaud, L., Pines, J., and Nigg, E. A. ( 1998) GFP tagging reveals human Polo-like kinase 1 at the kinetochore/centromere region of mitotic chromosomes. Chromosoma 107, 424–429 [DOI] [PubMed] [Google Scholar]
Associated Data
This section collects any data citations, data availability statements, or supplementary materials included in this article.