

Abstract
Promoter escape efficiency of E. coli RNA polymerase is guided by both the core promoter and the initial transcribed sequence (ITS). Here, we quantitatively examined the escape properties of 43 random initial sequence variants of phage T5 N25 promoter. The position for promoter escape on all N25-ITS variants occurred at the +15/+16 juncture, unlike the +11/+12 juncture for the wild type N25. These variants further exhibited a 25-fold difference in escape efficiency. ITS changes favoring promoter escape showed a compositional bias that is unrelated to nucleotide substrate binding affinity for the initial positions. Comparing all variants, the natural N25 promoter emerges as having evolved an ITS optimal for promoter escape – giving a high level of productive synthesis after undergoing the shortest abortive program. We supplemented GreB to the transcription reactions to better understand abortive initiation and promoter escape in vivo. GreB supplementation elevated productive RNA synthesis 2-5 fold by altering the abortive RNA pattern, decreasing the abundance of medium (6-10 nt) to long (11-15 nt) abortive RNAs without changing the levels of short (2-5 nt) and very long abortive RNAs (16-20 nt). The GreB-refractive nature of short abortive RNA production may reflect a minimum length requirement of 4-5 bp of RNA-DNA hybrid for maintaining the stability of initial or backtracked complexes. That the very long abortive RNAs are unaffected by GreB suggests they are unlikely to be products of polymerase backtracking. How the ITS might influence the course of early transcription is discussed within the structural context of an initial transcribing complex.
Transcription initiation entails two sequential stages. First, RNA polymerase (RNAP) holoenzyme binds to a promoter and forms the open complex. In the second stage, the active enzyme complex initiates RNA synthesis and, with growth of the nascent transcript, eventually relinquishes its hold on the promoter to advance into the elongation phase. Once free of the promoter contacts, RNAP acquires processivity in performing elongation synthesis. The switch from initiation to elongation requires large conformational changes, as deduced from the open versus elongation complex structures (1-6). For T7 RNAP, the N-terminal third of the protein undergoes a large movement accompanied by structural refolding, during which an RNA channel is formed to conduct the nascent transcript to the exterior of the protein (3, 4). For bacterial RNAP, the RNA exit channel is already present in the open complex, although occluded by the σ3.2 linker polypeptide (5, 6). The major conformational change accompanying the initiation-elongation transition involves the release of sigma factor contacts with promoter DNA and a large change in the protection footprint by the enzyme (7, 8). Recent studies showed that the loss of sigma-promoter DNA contacts may not result in the immediate physical release of sigma factor from the transcription complex at the initiation-elongation transition (9, 10). Sigma release likely occurs stochastically at different positions on different promoters (11-14).
The large structural changes described above occur sometime during the first 10-15 steps of transcription. While each step of incorporation brings incremental conformational changes to the initial transcribing complexes, the actual escape transition – simultaneous with displacement of sigma-DNA contacts, rewinding of the original open complex bubble, and forward movement of RNAP – occurs only when transcription has reached +8/+9 for T7 RNAP (15) and +9/+10 for E. coli RNAP on the T7 A1 promoter (8).
To understand the biochemistry of promoter escape, previously we examined factors that govern this process (16, 17). We found that both the core promoter region -60 to -1 and the initial transcribed region +1 to +20 play roles in the process. The latter was most dramatically demonstrated in the abortive-productive transcription patterns of T5 N25 promoter and its “anti” counterpart containing A ↔ C and G ↔ T changes in the +3 to +20 stretch of ITS (17). Phage T5 N25 promoter is transcribed by E. coli σ70 holoenzyme and has one of the highest known enzyme-DNA association constants, Ka (18). Changing the ITS to form N25anti did not affect Ka, but the promoter was rendered 10-fold weaker in productive RNA synthesis (19) due to greatly elevated abortive initiation. ITS changes, therefore, altered the promoter escape process (17).
How does the anti-ITS impair the promoter escape process? Is its effect unique (i.e. sequence specific)? To answer these questions, it is necessary to know the initiation properties of other ITS sequences. With this objective in mind, we undertook the random mutagenesis of the ITS of N25 promoter and comprehensively analyzed the abortive initiation-promoter escape properties of 40-plus N25 promoter random-ITS variants.
Materials and Methods
Enzymes and proteins
RNAP holoenzyme was isolated from E. coli strain RL721 (gift of Dr. R. Landick) as described (20). At the time of use, the enzyme preparation contained ∼60% active molecules (21). NusA was isolated according to Schmidt and Chamberlin (22). E. coli RNAP, NusA, and A-B- RNAP (isolated from E. coli strain AD8571 disrupted in the greA and greB loci; 23) were provided generously by Drs. J. Burt and M. J. Chamberlin. E. coli GreA or GreB protein was isolated from IPTG-induced JM109 cells harboring either pDNL278 or pGF296 plasmid, repectively (24).
Random mutagenesis
Degenerate mutations in the ITS from +3 to +20 were encoded in a template-strand chemically synthesized primer ITS1-d (KPH) spanning +61 to -26 with a 5′ Hind III site. When annealed to equimolar amount of the nontemplate primer N25-u (SSX) spanning −75 to +2 with a 5′ Xho I site, the overlap from −26 to +2 could be extended by Klenow Pol I to synthesize the complementary strand of the randomized region, yielding potentially a degenerate population of ∼1.7 × 10¹⁰ molecules going into the cloning process. The primers were obtained from IDT, Inc. The sequence of N25-u (SSX) primer is: 5′-AAGGC CACCTAGGCC TCGAGGGAAA TCATAAAAAA TTTATTTGCT TTCAGGAAAA TTTTTCTGTA TAATAGATTC AT+2-3′. The sequence of ITS1-d (KPH) primer is: 5′-GGGTACCTGCA GAAGCTTTCT GCGAGAACCA GCCATATTTA NNNNNNNNNN NNNNNNNNAT GAATCTATTA TACAGAAAAA TTTTCC-26-3′.
To obtain single ITS mutations, the Klenow-extended promoter fragments were digested with Xho I and Hind III, ligated into the Sal I and Hind III sites upstream of the promoter-less chloramphenicol acetyl transferase (CAT) reporter gene on pKK232-8 vector DNA (25), and transformed into XL1 Blue cells (Stratagene). Colonies resistant to 10 μg/mL chloramphenicol (camR) on LB agar were selected. Imposing a low level of selective pressure allowed the recovery of ITS sequences that permitted even low levels of CAT expression. Single camR colonies were picked and streaked, and their plasmid DNA sequenced to determine the ITS mutations. Colonies containing mixed ITS sequences were further treated by re-transformation at low plasmid DNA to competent cell ratio (of <1) to give rise to clones containing a pure ITS region. Using this procedure, we obtained and sequenced 43 ITS promoter variants for analysis.
Preparation of promoter fragments
Promoter fragments spanning −85 to +67 were amplified directly from plasmid DNA templates using the upstream N25-u (XE) and the downstream N25-d (MKPH) primers. The sequence of N25-u (XE) is 5′-CCCTCGAGGA ATTCCCGGGG ATCC-3′; of N25-d (MKPH), 5′-CCGCCCGGGT ACCTGCAGAA GCTTTCTGCG AGAACCAGCC-3′. The promoter DNAs were purified as described (26), resuspended in TE (10 mM Tris-HCl, pH 8, 1 mM Na-EDTA) to 300 nM for use in transcription reactions.
Steady state transcription
Quantitative transcription was performed to compare the abortive versus productive efficiency of the N25-based promoters (26). Each reaction (10-20 μL) contained 30 nM template DNA in buffer (50 mM Tris-HCl, pH 8.0, 10 mM MgCl2, 10 mM β-mercaptoethanol, 10 μg/mL acetylated BSA), supplemented to 200 mM KCl and 100 μM NTP (with [γ-32P]-ATP added to ∼10 cpm/fmol), and transcribed with 50 nM RNAP for 10 min at 37 °C. Transcripts were recovered by ethanol precipitation in the presence of glycogen carrier and fractionated by denaturing PAGE.
PAGE analysis
32P-labeled RNAs were fractionated in high percentage denaturing polyacrylamide gels (25% acrylamide:bisacrylamide [10:1] containing 7 M urea in 1X TBE [89 mM Tris Base, 89 mM Boric Acid, 2.5 mM Na-EDTA, pH 8.3]). Electrophoresis was performed with a salt-buffer gradient (top reservoir: 1X TBE; bottom reservoir: 0.3 M NaAc in 1X TBE) at 35 watts until the amaranth dye, which co-migrates with 2-nt RNAs, reached ∼1 cm from the bottom edge of the gel. This gel system reliably separates small RNAs that differ by 1 nt in length and further distinguishes RNAs of the same length that differ in composition only at the 3′-most nucleotide. Thus, a G-terminating RNA migrates slower than an A-, which migrates more slowly than either U- or C-terminating RNAs, marking a bigger gap between successive bands. This feature allows one to identify especially the G-terminating bands within an abortive RNA ladder, which we utilized below for evaluating various abortive ladders.
ImageQuant analysis
N25 promoter and all ITS variants contain AU as the +1/+2 nucleotides. Labeling the transcripts with [γ-32P]-ATP yields a direct correspondence between the measured band intensity (obtained as ImageQuant Volume [IQV] counts) and molar abundance of RNA transcripts. To obtain reliable total counts for each band, subtraction of unincorporated nucleotide background was necessary, especially for the 2- and 3-nt spots (see Figure 2 and legend). The background-subtracted IQV values for all transcripts (2 nt on up to the full length) from a promoter are summed as Total Transcripts, from which one can calculate Productive Yield (full-length RNA as a percentage of the total), Abortive Yield (the sum of abortive RNAs as a percentage of the total), and APR (the ratio of Abortive Yield to Productive Yield). Single labeling of each transcript also leads to the equivalence of Total Transcripts with Initiation Frequency (over the 10-min reaction period). In this study aimed at examining the effect of ITS mutations, all parameters were further normalized to those of the wild-type N25 promoter, which was included as a reference control in every transcription and gel analysis.
Fig. 2.
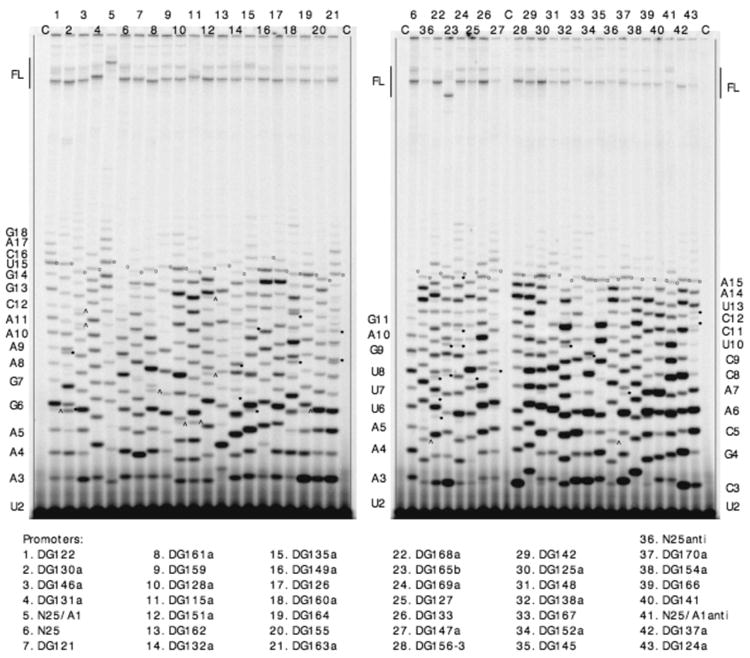
Gel profile of in vitro transcribed RNAs from the N25 random-ITS variants. In vitro transcribed RNAs, 32P-labeled at the 5′-triphosphate, were prepared from 43 random-ITS promoters and fractionated on 25% (10:1)/7 M urea polyacrylamide gels. Abortive RNAs are designated by a letter-number combination indicating the identity of its 3′-most nucleotide and length. The abortive RNA ladder on the left border corresponds to lane 1; the middle ladder, to lane 6 (in both gels); and the right ladder, to lane 43. The full-length runoff RNA (FL) is 67 nt for all promoters except DG165b (lane 23), which is 54 nt (due to a 13-nt deletion far downstream of the ITS region). For N25/A1 (lane 5), the 67-nt runoff RNA migrates slower because of sequence composition differences. “C” denotes minus-enzyme control reactions to reveal the background of [γ-32P]-ATP later subtracted from the relevant abortive RNA bands during ImageQuant analysis. For ease of monitoring, the 15-nt band in each lane is marked with an open dot. Extraneous bands attributed to slippage are indicated by carets; to misincorporation, by asterisks.
RNA sequencing
The identity of abortive RNAs was determined by steady state transcription (see above) in the presence of 100 μM of one of four 3′-dNTP nucleotides (Trilink BioTechnologies, Inc.).
Results
Random-ITS promoters
The random-ITS promoters are listed in Table 1 with their nontemplate (NT)-strand ITS (+1 to +20). Designated as the DG100-series, these promoters were obtained through clonal purification of camR transformants containing randomly mutagenized ITS cloned upstream of the CAT reporter gene. Clonal purification was necessary to ensure that each transformant harbored recombinant plasmid DNA containing a single random-ITS sequence. Rounds of clonal purification were monitored by two criteria -- sequencing the ITS region of plasmid DNA and transcription of the N25 random-ITS promoter amplified from it. The latter allowed examination of the abortive RNA ladder and served as a more stringent gauge of ITS purity than DNA sequencing. This is because the repetitive nature of abortive transcription amplifies the presence of even a small amount of contaminating template sequence, and produces a “contaminant” abortive RNA ladder that is superimposed on the major abortive RNA ladder fractionated in polyacrylamide gels. Clonal purification was deemed complete when a single collection of abortive RNA bands was obtained from a promoter.
Table 1. Transcription Hierarchy of Random-ITS Promoters.
| 1 | 2 | 3 | 4 | 5 | 6 | ||
|---|---|---|---|---|---|---|---|
| Promoter | ITS (+1 – +20) | PY (%) | RPY (%) | RIF (%) | APR | MSAT | R |
| DG146a |
|
8.0 ± 2.4 | 154 ± 14 | 70 ± 33 | 13 ± 4 | 20 | 12 |
| N25/A1 |
|
7.1 ± 0.9 | 150 ± 52 | 56 ± 16 | 13 ± 2 | 19 | 15 |
| DG122 |
|
7.0 ± 1.1 | 144 ± 31 | 76 ± 18 | 14 ± 1 | 18 | 15 |
| DG130a |
|
6.9 ± 0.5 | 140 ± 42 | 73 ± 14 | 14 ± 1 | 18 | 14 |
| DG131a |
|
5.1 ± 2.2 | 105 ± 41 | 125 ± 22 | 21 ± 9 | 16 | 13 |
| N25 |
|
6.0 ± 1.9 | 100 ± 0 | 100 ± 0 | 18 ± 5 | 11 | 14 |
| DG151a |
|
6.0 ± 2.7 | 96 ± 23 | 99 ± 34 | 19 ± 9 | 16 | 13 |
| DG161a |
|
5.1 ± 2.1 | 81 ± 10 | 136 ± 32 | 22 ± 10 | 15 | 12 |
| DG159 |
|
4.6 ± 2.2 | 74 ± 14 | 116 ± 14 | 26 ± 16 | 18 | 14 |
| DG121 |
|
3.4 ± 1.5 | 73 ± 31 | 104 ± 34 | 33 ± 17 | 17 | 13 |
| DG132a |
|
3.8 ± 1.5 | 72 ± 16 | 96 ± 27 | 30 ± 12 | 16 | 9 |
| DG115a |
|
3.5 ± 0.2 | 71 ± 17 | 105 ± 47 | 28 ± 2 | 18 | 10 |
| DG162 |
|
3.9 ± 1.1 | 70 ± 7 | 104 ± 19 | 27 ± 8 | 16 | 14 |
| DG128a |
|
3.7 ± 1.4 | 69 ± 4 | 114 ± 27 | 30 ± 11 | 18 | 12 |
| DG126 |
|
2.5 ± 0.7 | 57 ± 13 | 150 ± 41 | 40 ± 14 | 16 | 10 |
| DG163a |
|
3.4 ± 1.4 | 54 ± 14 | 116 ± 48 | 34 ± 14 | 18 | 9 |
| DG164 |
|
3.1 ± 0.6 | 51 ± 12 | 134 ± 50 | 34 ± 6 | 17 | 10 |
| DG149a |
|
2.9 ± 1.2 | 49 ± 9 | 130 ± 16 | 38 ± 11 | 14 | 14 |
| DG165b |
|
3.1 ± 0.9 | 48 ± 15 | 156 ± 47 | 33 ± 14 | 16 | 10 |
| DG169a |
|
3.1 ± 0.3 | 47 ± 4 | 140 ± 56 | 31 ± 3 | 20 | 13 |
| DG155 |
|
2.8 ± 0.4 | 45 ± 21 | 110 ± 38 | 38 ± 2 | 15 | 6 |
| DG168a |
|
2.7 ± 0.7 | 40 ± 8 | 165 ± 57 | 38 ± 10 | 16 | 10 |
| DG127 |
|
2.7 ± 1.2 | 40 ± 14 | 104 ± 20 | 40 ± 16 | 14 | 10 |
| DG135a |
|
2.2 ± 0.6 | 39 ± 2 | 163 ± 10 | 53 ± 16 | 20 | 12 |
| DG160a |
|
2.4 ± 1.0 | 35 ± 3 | 137 ± 19 | 50 ± 17 | 15 | 10 |
| DG133 |
|
1.8 ± 0.3 | 33 ± 6 | 269 ± 63 | 58 ± 14 | 16 | 10 |
| DG147a |
|
1.8 ± 1.0 | 31 ± 14 | 72 ± 17 | 70 ± 43 | 19 | 11 |
| DG125a |
|
1.3 ± 0.1 | 25 ± 3 | 295 ± 86 | 76 ± 6 | 16 | 6 |
| N25 anti |
|
1.4 ± 1.0 | 22 ± 14 | 115 ± 64 | 68 ± 31 | 15 | 7 |
| DG156 – 3 |
|
1.4 ± 0.6 | 21 ± 7 | 243 ± 68 | 76 ± 25 | 15 | 11 |
| DG138a |
|
0.9 ± 0.3 | 15 ± 5 | 366 ± 62 | 121 ± 40 | 16 | 8 |
| DG142 |
|
0.9 ± 0.1 | 14 ± 5 | 340 ± 74 | 121 ± 5 | 16 | 7 |
| DG170a |
|
0.8 ± 0.1 | 13 ± 2 | 288 ± 84 | 118 ± 25 | 16 | 10 |
| DG167 |
|
0.9 ± 0.5 | 13 ± 8 | 210 ± 72 | 151 ± 95 | 20 | 5 |
| DG166 |
|
0.8 ± 0.3 | 11 ± 3 | 273 ± 64 | 142 ± 60 | 17 | 8 |
| DG152a |
|
0.8 ± 0.3 | 11 ± 5 | 234 ± 27 | 144 ± 52 | 15 | 6 |
| DG148 |
|
1.0 ± 0.5 | 11 ± 7 | 228 ± 29 | 135 ± 82 | 17 | 10 |
| DG145 |
|
0.5 ± 0.2 | 10 ± 4 | 300 ± 72 | 202 ± 62 | 15 | 9 |
| DG141 |
|
0.6 ± 0.2 | 10 ± 6 | 267 ± 77 | 169 ± 65 | 14 | 9 |
| DG124a |
|
0.4 ± 0.2 | 9 ± 3 | 188 ± 52 | 205 ± 51 | 15 | 9 |
| N25/A1 anti |
|
0.4 ± 0.1 | 7 ± 3 | 458 ± 113 | 255 ± 52 | 16 | 5 |
| DG154a |
|
0.5 ± 0.3 | 7 ± 5 | 287 ± 51 | 217 ± 101 | 17 | 6 |
| DG137a |
|
0.3 ± 0.1 | 6 ± 4 | 444 ± 99 | 386 ± 27 | 15 | 7 |
Table I also includes the N25 wild-type and N25anti promoters as reference controls (17), and N25/A1 and N25/A1anti that were constructed specifically -- N25/A1, by adapting the T7 A1 ITS to the N25 promoter, and N25/A1anti, by replacing the +3 to +20 region of the A1 ITS with anti substitutions (A ↔ C and T ↔ G; for sequences, see Fig. 1).
Fig. 1.

Nucleotide sequence of T5 N25 and related promoters. The four promoters – N25, N25anti, N25/A1, and N25/A1anti -- span −85 to +67 and share the identical upstream sequence from −85 to −1, but differ in the downstream sequence (+1 to +67). The ITS of each promoter is underlined (+1 to +20). The promoter recognition sequences highlighted in bold include the UP (centered at −43), −35 and −10 elements.
Abortive RNA ladder is templated by the ITS
Fig. 2 shows a typical profile of transcripts obtained from the N25 random-ITS promoters. Our analysis indicates that each promoter gives rise to a single abortive RNA ladder. This assessment is most apparent in lanes 4, 6, 17, 28, 40 where one can count up a ladder of discrete bands in proper spacing. In other lanes, the abortive ladder is complicated by the occurrence of minor bands (indicated by carets and asterisks). These extraneous bands occur reproducibly at discrete positions and are unlikely to be part of contaminating abortive ladders. Further analysis suggests they result from transcript slippage or misincorporation (see below).
Each ITS variant was found to direct the synthesis of a distinct abortive ladder showing a unique pattern and different molar abundance of individual bands. Two methods were used to correlate the abortive RNA ladder and the ITS template sequences. First, the electrophoretic mobility of the G-terminating bands indicated that they occurred at positions predicted by the template sequence (see explanation under PAGE Analysis in Methods). Second, the abortive RNA ladder was sequenced in the presence of 3′-dNTP chain terminators; a representative gel profile is shown in Fig. 3. Superimposed onto the normal abortive RNA bands are the corresponding 3′-dNMP-terminated transcripts that migrate slightly ahead and appear over the four chain-terminating reaction lanes in a sequence-specific manner. For the five promoters shown, the sequence of the chain-terminated RNA ladder agrees with the DNA sequence of the ITS. Combining both approaches, we were able to assign an identity to most of the RNA bands and conclude that the abortive RNAs synthesized by each random-ITS promoter variant were templated by the respective ITS.
Fig. 3.
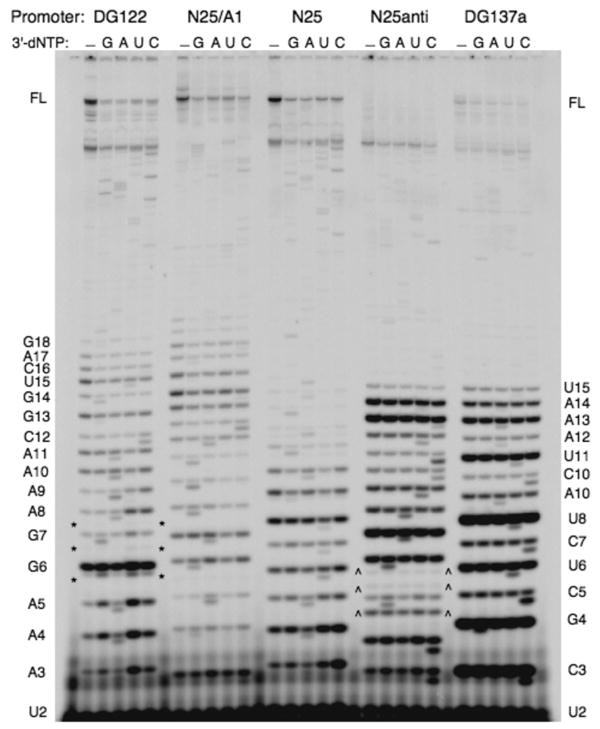
Sequencing the abortive RNAs by chain termination. A high percentage denaturing PAGE (as used for Fig. 2) displays the abortive RNA ladders from five promoters. Each promoter is reacted during steady state transcription (in 100 μM NTP) for 10 min at 37 °C under five conditions -- in the absence or presence of 100 μM of the specified 3′-dNTP (indicated by G, A, U, or C). In the lanes containing a 3′-dNTP, the 3′-dNMP-terminated abortive RNAs migrate just ahead of their regular abortive RNA counterparts, forming doublet bands. The abortive RNA sequence obtained from these five promoters agree with the DNA sequence of their ITS. Under the nucleotide concentrations used, slippage transcripts – for example, C5 (and C6 and C7) in N25anti (bounded by carets) and A6 (and A7 and A8) of DG122 (bounded by asterisks) -- do not undergo chain termination by incorporating the corresponding 3′dNMP. Abortive RNA ladder on the left border is that of DG122; on the right, that of DG137a.
The above methods did not resolve the identities of extraneous bands that appear reproducibly at low molar abundance (Fig. 2). We suspect that some bands (those marked by carets) are slippage transcripts resulting from nucleotide (triplet) repeats in their respective ITS (27). A slippage transcript C5 generated by N25anti was characterized previously by nearest neighbor analysis (17) but, in the present analysis, is unaffected by the chain-terminating nucleotides (see legend, Fig. 3). The remaining bands (indicated by asterisks) are of unknown origin; we attribute their synthesis to misincorporation by RNAP (28). It is possible that, by randomizing the ITS, RNAP now makes many more sequence-specific errors during polymerization, albeit at low levels. In the quantitative analysis below, the contribution of these minor bands to the abortive yield was ignored.
Quantitative initiation analysis
Having established that abortive RNAs are templated by the random-ITS promoters, we next quantitated the abortive pattern according to the following parameters: productive yield (PY), relative productive yield (RPY; normalized to that of N25), relative initiation frequency (RIF; normalized to that of N25), abortive to productive ratio (APR), and maximum size of abortive transcripts (MSAT). Each promoter was transcribed at least three times to obtain these quantitative parameters as their mean value ± SD. In Table I, the promoters have been arranged in descending order of their relative productive yield (column 2) and divided into three groups -- referred to as the top, middle, or bottom group – for our analysis below.
Relative productive yield
Column 2 shows that, by changing the ITS, the productive synthesis from N25 promoter can vary by ∼25 fold (i.e. 6-154% of N25). Of the 43 random-ITS promoters, only four belong in the top group with productive yields higher than N25, two in the middle group exhibit similar productive yield as N25, and the rest -- the bottom group -- suffers in relative productive synthesis to varying degrees. In a fixed-time steady state reaction, changes in any of the initiation steps can affect the productive yield. This parameter alone does not permit the conclusion that ITS mutations affected promoter escape exclusively.
Relative initiation frequency
Initiation Frequency is the total number of RNA molecules – abortive and full-length -- initiated from each promoter in the 10-min reaction period. This parameter indicates whether ITS mutations affected the early steps of initiation in open complex formation and stability to change the frequency of initiation. As an example, N25 and N25anti were found previously to exhibit similar Ka (19); they gave rise to similar initiation frequencies in the current analysis (Table 1, column 3). Overall, the ITS variants exhibited relative initiation frequency ranging from 70 to ∼450% of N25, indicating that open complex stability was not much compromised; rather, the increased initiation was the result of increased abortive cycling.
Relative to N25, the top group of promoters all gained in productive yield while invariably showing reduced initiation frequency. This outcome is consistent with the view that these ITS changes facilitated the post-initiation step of transcription (i.e. promoter escape) thus committing a larger fraction of RNAP towards elongation synthesis rather than repetitive abortive initiation. The bottom group of promoters all showed increased initiation frequency but diminished productive yield; elevated initiation is clearly due to increased abortive release (see Fig. 2). The middle group of promoters showed equivalent relative initiation frequency and relative productive yield to the wild-type promoter. Thus, while the ITS sequences of DG131a and DG151a are substantially different from that of N25, these promoters display similar escape efficiencies.
For the N25-ITS promoters in general, relative productive yield decreased with increasing relative initiation frequency (Fig. 4A). This inverse relationship reinforces the notion that ITS changes to the N25 promoter specifically alter the abortive initiation-promoter escape process.
Fig. 4.

Promoter escape efficiency varies with the ITS sequence. A: For each N25-random ITS promoter, escape efficiency as indicated by the relative productive yield (mean ± SD) shows an inverse correlation with relative initiation frequency (mean ± SD). B: A positive correlation was found between the relative productive yield and purine content in the NT strand of the ITS. Here, the equivalent negative correlation of APR (± SD) with purine content is plotted.
APR
APR – the ratio of abortive to productive yield -- most clearly conveys the ease or difficulty at promoter escape; the higher the ratio, the more difficult the escape. For wild-type N25, one in ∼20 initiation events results in the synthesis of full-length RNA. The abortive-productive ratio decreases to 14 for the top group, and increases sharply for the bottom group to a high value of ∼400. Interestingly, when we plotted APR as a function of purine content in the NT strand of ITS (column 6), a negative correlation was obtained (Fig. 4B). Promoters containing 12-15 purines in the first 20 positions of the ITS tended to have APR values of 50 or lower, while those with 5-8 purines yielded APR values of 100 or higher. The large scatter in APR values for promoters with intermediate purine content suggests that additional effects (e.g. sequence context of the purines) are also important for escape. Here, we note the apparent lack of correlation of quantitative parameters to the AT vs. GC bias in the ITS (data not shown).
MSAT
On a given promoter, the size of the longest abortive transcript is indicative of where the promoter escape transition occurs (17). For wild-type N25 promoter, the transition occurred mostly at the +11/+12 juncture (Fig. 2, lane 6). Changing the ITS to the anti sequence altered the promoter escape process dramatically such that abortive initiation continued to +15 (Fig. 2, lane 36). Unexpectedly, every ITS variant also aborted to +14/+15 or longer (column 5 and Fig. 2). At this length, the nascent transcript should have filled the entire RNA exit channel (29). For the bottom group of ITS variants, RNAP had difficulty negotiating the escape transition even after synthesizing a long nascent RNA. The top and middle group of promoters, although more facile at escape, achieved escape only after a longer abortive process -- unlike the natural N25 promoter. Thus, there appears to be no apparent correlation between productive yield and the length of the abortive ladder.
In a number of promoters, transcripts of 16-20 nt were reproducibly synthesized (Fig. 2, lanes 1, 5, 10, 15, 21, 24). At lengths >15 nt, the nascent transcripts should have emerged from the polymerase protein (29). None of the RNA sequences encodes a substantial hairpin as signal for termination. It is, therefore, not clear how the added length of these transcripts influences the escape transition. Later, we probe the formation of these RNAs in the presence of GreB.
Examining the purine-content correlation
That the escape-facile promoters tend to have an abundance of purine residues in the NT strand of their ITS (Fig. 4B) could be explained if the i+1 (incoming nucleotide substrate) site displayed high substrate binding affinities (i.e. low KS) for purine nucleotides and/or low binding affinities for pyrimidine nucleotides. If differential binding affinity is the cause of success or failure in escape, the limitation could be overcome by raising the concentration of pyrimidine nucleotides in the reaction.
We examined this issue with ten selected promoters – three from the high purine group that are escape-facile (DG122, N25/A1, and N25), four from the high pyrimidine group that are escape-impaired (N25anti, DG137a, DG124a, and N25/A1anti), and three that contain equal numbers of purine and pyrimidine residues in the ITS (DG115a, DG127, and DG133). We tested four NTP conditions on each promoter as detailed in Fig. 5. Quantitative analysis of productive yield (Fig. 5A) and total initiation frequency (Fig. 5B) showed only minor differences for all ten promoters under various NTP conditions. While the total initiation frequency for each promoter was largely unchanged by NTP variation (Fig. 5B), higher NTP concentration actually stimulated the productive synthesis from escape-facile promoters more than from escape-impaired promoters (Fig. 5A). Thus, in transcription reactions with 100 μM NTP or higher, the nucleotide substrate binding affinity for the initial positions is not a limiting factor for escape.
Fig. 5.

Promoter escape efficiency as a function of NTP concentration. NTP titration was performed with ten selected promoters; three with high purine content in the NT strand of their ITS: DG122, N25/A1 and N25; three with intermediate purine content: DG115a, DG127, and DG133; and four with high pyrimidine content: N25anti, DG137a, DG154a, and N25/A1anti. Each promoter was transcribed for 10 min at 37 °C in four different NTP conditions: a, 100 μM NTP; b, 100 μM ATP/GTP, 500 μM CTP/UTP; c, 500 μM ATP/GTP, 100 μM CTP/UTP; and d, 500 μM NTP. All reactions used [γ-32P]-ATP label at the same specific activity. A. Histogram of productive transcription as a function of NTP conditions: a, open bars; b, dotted bars; c, cross-hatched bars; d, stippled bars. B. Histogram of total initiation frequency as a function of NTP concentration. Initiation frequency is measured in IQ volume units.
Effect of transcription factors on promoter escape
The ITS can severely compromise promoter escape by RNAP in vitro. To explore its role in promoter escape under conditions more closely resembling those found in vivo, we examined the effects of GreB and/or NusA on abortive-productive transcription. GreB was shown previously to stimulate escape from N25anti promoter (31) and we wished to know if it exerts similar effects on many of the random-ITS promoters. There were two reasons to test the role of NusA on promoter escape. First, NusA is known to bind to the RNAP ternary complex at a site overlapping the σ domain 4 (σ4)-β flap contact region, presumably only after σ is released (32, 33). Therefore, it is possible that NusA may facilitate escape by actively displacing the σ factor and/or by stabilizing the post-release conformation of RNAP. Second, when added to λ PR′-RNAP complexes containing a 15-nt transcript, NusA contacts the 5′-internal residues to effect conformational changes at the 3′-catalytic center (34, 35), possibly enhancing an early pause in elongation (36). Given our observation of abortive transcripts longer than 15 nt on many random-ITS promoters, we wondered whether they could be paused transcripts and their formation subject to the influence of NusA.
The transcriptional investigation was carried out with the same ten promoters studied in Fig. 5. Each promoter was transcribed under five different enzyme conditions as detailed in Fig. 6. The transcription gel profile is presented in Fig. 6A, and quantitative parameters summarized in Table 2. As seen in Fig. 6A, the wild-type (wt) RNAP used throughout this study was substantially free of Gre factors (compare lanes a and b transcribed with RNAP isolated from wt or greA- greB- cells, respectively). NusA supplementation alone had no effect on promoter escape from any of the promoters (compare lanes b and d within each set). The lack of effect is not due to inactive NusA protein, which at the time of use, was shown to be active in a T7 A1 promoter-based elongation assay (37). NusA and GreB together gave results identical to the GreB-only treatment (compare lanes c and e in each set). NusA, therefore, has no influence on escape from N25 random-ITS promoters, possibly because σ is held very securely in the initiation complexes. Or even if NusA has displaced σ, being a weak RNA-binding protein (38), it simply has insufficient RNA foothold (34) to affect the transcription complex undergoing the initiation-elongation transition.
Fig. 6.
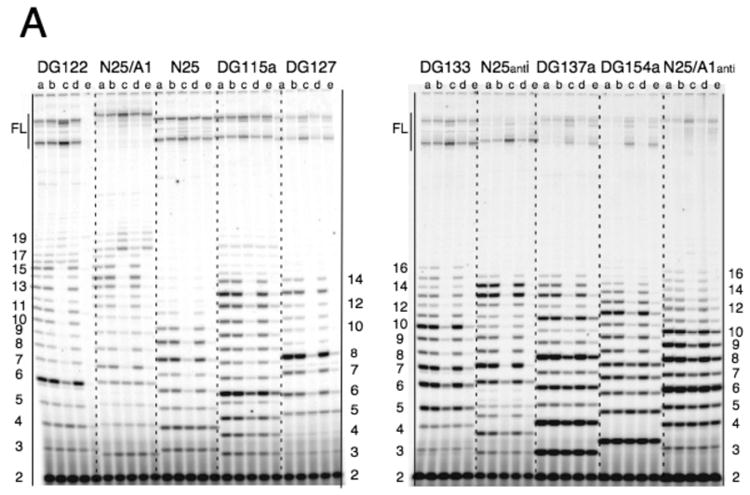

Effect of GreB and NusA on promoter escape from selected promoters. A. Gel profile of transcripts from the ten promoters examined in Figure 5. Each promoter was transcribed with five different enzyme mixtures for 10 min at 37 °C. The transcripts were labeled with [γ-32P]-ATP. Enzymatic conditions were: (a) A-B- RNAP; (b) wt RNAP; (c) wt RNAP:GreB (1:10); (d) wt RNAP:NusA (1:10); and (e) wt RNAP:GreB:NusA (1:10:10). RNAP was preincubated for 10 min at room temperature with the accessory protein(s) prior to its addition to the reaction. Columns of numbers reference the size of abortive RNAs associated with the nearest promoters. FL: full-length RNA. B. Comparative abortive probability profiles for the ten promoters. Abortive probabilities were calculated for the abortive RNAs (26) and plotted. The higher the abortive probability, the more likely is the RNAP to release its nascent transcript at that position. High abortive probability percentages represent high barriers to promoter escape. Dotted bars: -GreB; stippled bars: +GreB.
Table 2. Changes in Quantitative Parameters Induced by GreB.
| APRb | MSATb | |||
|---|---|---|---|---|
| Promoter | RPY (%)a | RIF (%)a | (− GreB) → (+ GreB) | (− GreB) → (+ GreB) |
| DG122 | 248 | 88 | 9 → 3 | 17 → 7 |
| N25/A1 | 229 | 95 | 13 → 5 | 19 → 10 |
| N25 | 206 | 75 | 10 → 4 | 11 → 9 |
| DG115a | 297 | 56 | 19 → 6 | 18 → 13 |
| DG127 | 386 | 57 | 28 → 6 | 14 → 8 |
| DG133 | 350 | 50 | 22 → 6 | 16 → 10 |
| N25 anti | 529 | 44 | 25 → 4 | 15 → 7 |
| DG137a | 372 | 55 | 67 → 17 | 15 → 13 |
| DG154a | 329 | 67 | 54 → 16 | 16 → 12 |
| N25/A1 anti | 292 | 59 | 68 → 22 | 16 → 13 |
The ratio (converted to percentages) of the parameter obtained with GreB versus without GreB.
APR and MSAT are shown as changes (arrows): from the “−GreB” value (first number) to the “+GreB” value (second number).
GreB, on the other hand, brought dramatic changes to the escape properties of every promoter (see Table 2, and compare lanes b and c in each set in Fig. 6A). An increase in productive yield (200-500%) was accompanied by a decrease in total initiation frequency, by as much as 50%. The opposing changes in these two parameters again point to promoter escape as the main target of GreB-stimulated activity during initiation, as do the reduced values of APR. The changes in APR are different for the ten promoters, indicating that the effect of GreB on promoter escape is ITS sequence-dependent.
The most striking change wrought by GreB was in the appearance of the abortive ladder; in every case, not only was its length reduced, but also the intensity of the constituent bands altered. N25anti offers the most dramatic example where the longest abortive transcript was truncated from 15 to 7 nt, and all of the highly abortive positions (at +6, +7, +13 and +14) were eliminated. Based on their susceptibility to GreB treatment, we classified the abortive RNAs into four groups. In every promoter, the short abortive RNAs (2-5 nt) showed unchanged intensity in the presence of GreB. The level of medium abortive RNAs (6-10 nt) was decreased significantly. The long abortive RNAs (11-15 nt) were also greatly diminished in abundance and, in many promoters, completely absent (e.g. DG122, N25/A1, DG127, DG133, N25anti). In some promoters (e.g. DG122, N25/A1), there exist the very long abortive RNAs (16-20 nt); their level was not only undiminished, but may be somewhat elevated, in the presence of GreB.
Because GreB binds in the secondary channel of RNAP to stimulate the enzyme's intrinsic hydrolytic activity to cleave the backtracked RNA and allow its re-extension (39-41), this activity can be utilized to infer how the various groups of abortive RNAs are formed. By this criterion, a straightforward interpretation of the data suggests that short and very long abortive RNAs are formed by a GreB-independent mechanism distinct from backtracking and subsequent release of the transcript through the secondary channel, and that medium and long abortive RNAs are deemed to have arisen from backtracking. This interpretation requires that RNAP undergo two mechanistic changes in the course of abortive transcription – one between the synthesis of short and medium abortive RNAs, and the second, between the synthesis of long and very long abortive RNAs. While the latter mechanistic switch can be rationalized on the basis that RNAP has reached the stage to undergo the initiation-elongation transition, it is more difficult to account for the early mechanistic switch.
An alternative interpretation suggests that RNAs ≤ 15 nt are all derived from backtracking, but the unchanging levels of short abortive RNAs in the presence of GreB reflects the minimum requirement of 4-5 basepairs of RNA-DNA hybrid for maintaining initial or backtracked complex stability. Thus, before reaching this minimum heteroduplex length, the initial RNAs that backtracked would be so poorly held that they are rapidly released, before GreB-mediated cleavage-rescue can take place. (For example, a 5-nt RNA that backtracks 3 nucleotides would be held only by 2 bp of RNA-DNA hybrid.) The medium and long abortive RNAs were readily rescued from abortive release because their backtracked states could be stabilized by RNA-DNA hybrids of sufficient length for GreB to act. (For example, an 8-nt RNA that backtracks 3 positions would be held stably by 5 bp of RNA-DNA heteroduplex.)
The degree of rescue of medium and long abortive RNAs depends on where GreB primarily exerts its effect. In Fig. 6B, the abortive probability profiles show that most promoters, in the absence of GreB, contain a highly abortive block in the mid range (at +6 to +8) and, except for N25, also one in the long range (at +13 to +15) of the abortive ladder (16). GreB-stimulated rescue exerted at the mid-range barrier (e.g. in DG122, N25/A1, N25, DG127, N25anti) resulted in diminished levels of medium and long abortive RNAs. GreB-mediated rescue exerted at the long-range barrier (e.g. in DG115a, DG133, DG137a, DG154a, N25/A1anti) allowed continual abortive release until +12/+13.
The data in Table 2 further show an approximate correlation of the gain in productive synthesis (column 1) with the decrease in APR (column 3), suggesting the medium and long abortive RNAs that were rescued by GreB were in fact elongated to the full length. This result can arise from two modes of GreB rescue. One mode involves GreB binding in the secondary channel to prevent backtracking of the medium and long nascent RNAs, thereby allowing them to be continuously elongated to the full length. This can account for the disappearance of medium and long abortive RNAs in the presence of GreB. Alternatively, medium and long abortive RNA-containing complexes can undergo multiple rounds of backtracking, GreB-mediated cleavage and re-extension. With each round of cleavage-rescue, more medium and long abortive RNAs would be extended through to the full length, giving rise to barely detectible production of the abortive RNAs. To illustrate the effectiveness of this mode of GreB-mediated rescue, consider the +7 position of N25anti which shows an abortive probability of ∼30% (see Fig. 6B), just four rounds of cleavage and re-extension would suffice to reduce the abortive tendency at this position to less than 1%.
To distinguish these two possibilities, we performed parallel transcription reactions, with [γ-32P]-ATP vs. [α-32P]-ATP label, to examine the formation of 3′ cleavage RNA that is predicted by the second mechanism and only detected in reactions using [α-32P]-NTP label. A representative gel result obtained with the DG122 promoter is shown in Fig. 7. Here we found that 3′ cleavage RNAs were produced in the presence of GreA (lane b, right panel) or GreB (lane d, right panel). The 3′-cleavage RNAs are 5′-monophosphorylated; in high % PAGE, they migrate to positions in-between the 5′-triphosphorylated abortive RNA bands of the nearest sizes (see legend). Judging by their electrophoretic mobility, the 3′ cleavage products derived from GreA stimulation are 2-3 nt in length, while those from GreB stimulation ranged in size from 2-3 nt up to 9-10 nt, in agreement with previous observations (summarized in 41). The long cleavage products can only arise from nascent transcripts of at least 14-15 nt that have backtracked 9-10 nt and remained held by 4-5 bp RNA-DNA hybrid. This result, while confirming the continual synthesis-backtracking-cleavage-rescue of the medium and long abortive RNAs, does not exclude the possibility that GreB binding in the secondary channel might have stabilized these initial transcribing complexes sufficiently to reduce backtracking.
Fig. 7.
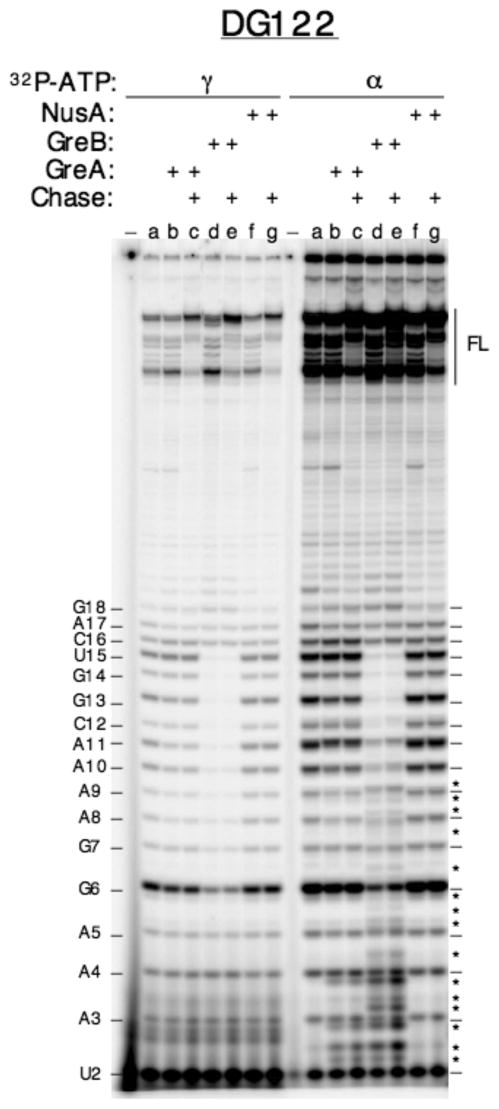
GreB-mediated rescue of medium and long abortive RNAs results from cleavage and re-extension. Cleavage of backtracked complexes leads to the formation of 3′ cleaved RNAs whose presence is only detected in reactions containing [α-32P]-NTP. Two sets of transcription reactions were performed in parallel, one with [γ-32P]-ATP label (left half) and the other with [α-32P]-ATP label (right half). Each set of seven reactions corresponds to transcription of DG122 for 10 min at 37 °C by RNAP alone (lane a), or RNAP supplemented with 10-fold molar excess of GreA (lanes b and c), GreB (lanes d and e), or NusA (lanes f and g), followed by a 10 min chase with 1 mM NTP (lanes c, e, and g); “−“ represents minus-enzyme control. The high [NTP] chase was included to distinguish released vs. paused RNAs. [α-32P]-AMP labeling reveals the presence of 3′-cleavage products in reactions containing GreA or GreB (lanes b-e, right half). Asterisks mark the 3′-cleavage products that are 5′-monophosphorylated; they migrate slower than their 5′-triphosphorylated abortive RNA counterparts during PAGE and reach positions between the abortive RNA bands – marked with dashes on both edges of the gel -- of the nearest sizes (i.e. a 5′-p-3 mer will form a band between the 5′-ppp-3 mer and 5′-ppp-4 mer; Hsu, L. M., unpublished analysis). Multiple 5′-p-3 mer bands result from cleavage of different backtracked RNAs, giving rise to 3-mer cleavage products of different compositions (Hsu, unpublished results).
Discussion
The role of ITS in abortive initiation and promoter escape
Transcription from promoters that form stable and active open complexes is usually limited at the promoter escape step (18, 42-45). The abortive initiation process on these promoters becomes directed by the ITS. In this paper, we have expanded this observation first made with the N25 and N25anti promoters (17, 19) to include ∼40 N25 random-ITS variants. Our analysis has given rise to a set of generalizations of how the ITS might influence the course of escape.
On N25 promoters, the ITS specifically affects the abortive initiation-promoter escape process and changes the productive efficiency by ∼25 fold. The ITS mutations gave rise to an inverse relationship between productive yield and the abortive-productive ratio (Table 1, columns 1 and 4) indicating that, failing escape, a polymerase would be relegated to repeat abortive cycling. Any wholesale ITS changes, in this case from template positions +3 to +20, lengthened the abortive ladder to the 15th position, thus delaying the promoter escape transition to the +15/+16 juncture. While changes in the ITS invariably postponed the escape transition, they did not obligatorily decrease the escape efficiency as shown by the top and middle groups of promoters in Table I. Of the 43 random-ITS variants, >80% fall within the bottom group. Most resembled N25anti in that they not only showed delayed escape, but were also substantially impaired at achieving the transition. The evidence presented here indicates that the anti-ITS is not unique at impeding escape.
Surprisingly, only one initial sequence supports early escape, at the +11/+12 juncture with robust efficiency -- the native ITS of N25. This observation leads us to speculate that the native ITS is the product of evolutionary selection to specifically facilitate escape from this promoter. In this regard, the native ITS sequence of N25 promoter (A+1TAAATTTGAG+11) is most unusual. It is AT-rich and encodes a weak 8-9 bp initial RNA-DNA hybrid, unlike the GC-rich hybrid shown to stabilize elongation complexes (46, 47). Previously, we noted the lack of correlation between predicted RNA-DNA hybrid stability based on sequence composition and the abortive tendency of initial transcribing complexes (17). This conclusion has been greatly extended here; not only is there no such correlation, but among promoters that encode 8-bp AT-rich initial hybrids (e.g. N25, DG146a, and DG155), different abortive patterns were obtained (compare these promoters in Fig. 2, lanes 3, 6, and 20, and in Table 1). Our current data do not, however, clarify how the native ITS of N25 allows optimal escape.
Although the sequence-related role of an initial RNA-DNA hybrid remains unclear, we were able to delineate a compositional preference that enhances escape. The top ten promoters in Table 1 show an enrichment for purines in the NT-strand of the ITS. In contrast, the bottom fifteen promoters are severely impaired at escape; their ITSs are pyrimidine-rich. This bias was shown to be unrelated to nucleotide substrate binding affinity differences during initial transcription (Fig. 5). The correlation of high purine content in the ITS with enhanced productive yield -- and high pyrimidine content with elevated abortive yield -- appears also to account for the escape properties of a set of λPRM consensus promoter-ITS variants (48). Our observation raises the issue, but does not clarify, whether it is the purine richness in the NT strand or nascent RNA, or pyrimidine richness in the T strand, or both, that may be the important signal for escape. In a later paragraph, we offer a speculative explanation for why purine richness in the NT strand might facilitate escape.
Does ITS affect abortive-productive transcription on all promoters?
The modulatory effect of ITS presented above was demonstrated with the T5 N25 promoter, which has been shown to exhibit very high KB × k2 values, forming exceedingly long-lived and active open complexes. Its rate-limiting step of transcription initiation becomes associated with the escape process (18). Whether the above set of ITS sequences would have similar effects on another core promoter is not known. However, the analysis of many core promoter-ITS hybrids indicates that the effect of the ITS on escape is secondary to the control exerted by the core promoter sequence which, in encoding the formation, stability, and activity of the open complex structure, sets the rate-limiting step of initiation (reviewed in 45). Other examples confirm the secondary role of ITS on escape. A dramatic example is seen with the T7 A1 ITS, which prescribes a weak abortive ladder of only 8 nt, making T7 A1 a highly escape-facile promoter (17). However, when adapted to the N25 promoter (i.e. N25/A1 characterized in this study), the A1 ITS now augments the abortive process to produce one of the longest abortive ladders observed (see Fig. 2, lane 4). Another example involves the anti ITS whose ability to induce high level of abortive synthesis and impede escape is dependent on how close to consensus the core promoter is (16).
GreB treatment reveals extensive backtracking brought about by the ITS
In this study we have uncovered the largest collection of GreB substrates – initial transcribing complexes undergoing backtracking extensively. Surprisingly, we found that GreB has a dramatic effect on the abortive pattern of every ITS variant we examined (Fig. 6). In each case, GreB stimulated the synthesis of full-length RNA by reducing the release of medium and/or long abortive RNAs. The near quantitative equation of reduced abortive synthesis with increased productive synthesis (Table 2) suggests GreB rescued the medium and long nascent transcripts from abortive release, primarily by stimulating the cleavage of these backtracked RNAs and allowing them to be elongated to the full length (Fig. 7).
The abortive pattern change caused by GreB further revealed the basic criterion of cleavage rescue: that when first backtracked, the nascent RNA must be held stably by a 4-5 bp RNA-DNA hybrid for the cleavage/rescue activity of RNAP/GreB to take effect. Backtracked or nascent RNAs held by a hybrid shorter than 4-5 bp presumably are rapidly released. Two major peaks of backtracking stress were detected: one at +6 to +8, and the other at +11 to +13 (Fig. 6B). These peaks correspond to the two high barriers identified previously as resulting from the tight σ2/-10 and σ4/-35 polymerase-promoter interactions, respectively, that stabilized the open complex against escape (16, 49).
Our results suggest that promoter escape in vivo and in vitro are likely to be different. In vivo, GreB – among other factors -- plays an important accessory role in facilitating escape (31, 40, 50, 51).
An integrated view of promoter escape
On N25 promoters the abortive profile is governed by the template sequence, e.g. Fig. 6B. Our results show that the most common position of escape on the N25-random ITS promoters is at the +15/+16 juncture. This observation is interesting for several reasons. Transcription to this position produces a nascent transcript of 15 nt that has successfully displaced the σ3.2 linker (52), filled the entire length of the RNA channel, and is just emerging from the polymerase (29). Having maximized the binding energy between nascent transcript and the product site of RNAP, an initial transcribing complex reaching +15 should be poised for promoter escape, unless it is hindered by the escape-impairing ITS.
How does an ITS modulate promoter escape? The ITS region is mostly double-stranded in the open complex, occupying the template stretch downstream of the catalytic center. Upon initial transcription, this region becomes progressively unwound and is drawn upstream past the catalytic center (2). If the upstream boundary of the bubble does not rewind, the scrunched ITS sequence leads to expansion of the transcription bubble. Later, when the upstream boundary rewinds (as σ2 relinquishes its hold on single-stranded -10 element sequence), escape occurs, and the ITS region now becomes the strands of the first elongation bubble. As described here, the initiation-elongation transition involves downstream movement of the transcription bubble that is mediated by the gradual expansion of the open complex bubble in concert with early transcription followed by upstream rewinding. This model is illustrated in Fig. 8.
Fig. 8.

Bubble translocation during the initiation-elongation transition is mediated by bubble expansion during initial transcription followed by upstream bubble collapse. An integrated view of promoter escape is described in the text. This diagram illustrates the translocation of the open complex bubble to an elongation complex bubble, via expanded bubble intermediates formed during initial transcription. The expanded bubble intermediate depicted is one that has transcribed 13-14 nucleotides and on the verge of undergoing the escape transition. Subunits of RNAP are rendered in color as follows: gray, α; pink, β′; blue, β (made transparent to reveal features in the active site channel); and red, σ. Purple dots denote the twin Mg+2 catalytic center. Color scheme for nucleic acids: NT strand, green; T strand, blue; RNA, purple. The open complex bubble, which becomes the upstream portion of the expanded bubble, is highlighted with thick lines. The ITS region maps to the downstream portion of the expanded bubble and, upon escape, becomes the elongation bubble; it is indicated with the thickest lines.
On an escape-limited promoter, the expansion of the transcription bubble can account for abortive transcription. On any of the N25-random ITS promoters, bubble expansion -- which can proceed to almost twice its original size of 14-15 bp -- generates a strained intermediate (53) that contains rewinding tension. If the downstream portion of the expanded bubble rewinds, the enzyme complex backtracks and abortive transcription results. However, if the upstream portion of the expanded bubble rewinds, escape ensues. It is reasonable to assume that the rewinding tension (i.e. strain) in an expanded bubble would reside first in the downstream portion of the bubble near the active site where nucleotide incorporation and template scrunching has just occurred (47). This tension would be (somewhat) accommodated when the bubble propagates upstream in conjunction with the enzyme undergoing stepwise forward translocation to unmask the next i+1 site. Viewed this way, the ease with which the enzyme reverse- or forward-translocates after each nucleotide incorporation may determine the abortive tendency (i.e. probability) at an initial position.
By the same rationale, it is possible to account for how the ITS sequence might control the abortive probability profile. As initiation converts a stable open complex to a metastable initial transcribing complex (ITC), both the transcription bubble expands and the nascent RNA grows. These two structural parameters confer opposing influences on the stability of the ITC: the expanding bubble is destabilizing, while the nascent RNA, caught up as growing RNA-DNA hybrid, adds stability. The degree of their opposing influences increases proportionately with RNA chain length and, judging from our results, is sequence-context dependent. The balance of these two forces at each initial position determines the extent of abortive release (i.e. backtracking) versus incorporation of the next nucleotide (i.e. forward translocation), and accounts for sequence-dependent variability in the abortive pattern.
The case for purine-rich NT strand in facilitating promoter escape: a speculation
Our bubble-expansion model provides a plausible explanation of how purine-rich NT strand might facilitate escape. Bubble expansion during initial transcription leads to accumulated “slack” in the single-stranded sugar-phosphate backbone. The slack in the template strand can be taken up by the formation of RNA-DNA heteroduplex, at least for 7-8 bp (54, 55). The NT strand, on the other hand, remains single-stranded throughout the abortive initiation-promoter escape process and the slack would not be accommodated. Recent NMR evidence revealed that single-stranded polypurine stretches tend to assume helical conformation via base stacking (56). Thus, it is possible that a purine-rich NT strand can adopt single-stranded helical dimensions and better accommodate the slack in the sugar-phosphate backbone, thereby stabilizing the initial complexes towards forward translocation and incorporation of successive nucleotides to reach the escape transition. The above speculation ignores the role of RNAP protein-NT strand interaction, the structural details of which are available only for static and specialized transcription complexes (5, 52, 57). The paucity of current knowledge regarding the dynamics of RNAP-bubble strand interaction during early (frequently abortive) transcription precludes a thoughtful consideration of the involvement of RNAP.
The above hypothesis, however, is consistent with many reports of the NT strand playing a preferential role in facilitating a transcriptional function. For example, T7 RNAP utilizes the NT strand to mediate the stepwise conformational changes of promoter escape (58, 59). On E. coli transcription complexes, specific regulatory proteins bind to the NT strand to effect various transcription strategies (60-63). Interestingly, for RNA Pol II transcription on AdML promoter, a purine-rich NT strand enhanced transcriptional arrest, while a pyrimidine-rich NT strand enhanced elongation competence and promoter clearance (64). The case for enriching purines in the NT strand to facilitate promoter escape clearly requires further examination.
Acknowledgments
LMH wishes to thank Drs. Caroline Kane and Michael Chamberlin for their gracious hospitality, generous support and encouragement during her sabbatical leave at U. C. Berkeley to complete this study. The P.I. is grateful for the intellectual stimulation provided by members of the Kane-Chamberlin group, and Drs. Kenneth Howe, Nam Vo, Monica Chander. We thank Dr. Greg Verdine for pointing the P.I. to look into the polypurine stacking issue. The P.I. also acknowledges the critical but helpful comments from the reviewers.
This work was supported by an NIH grant (R15 GM55907) and an NSF grant (RUI-0077941) to LMH.
Abbreviations
- ITS
initial transcribed sequence
- RNAP
RNA polymerase
- ChIP
chromatin immunoprecipitation
- PRR
promoter recognition region
- NT
nontemplate strand
- T
template strand
- CAT
chloramphenicol acetyl transferase
- camR
chloramphenicol resistance
- PY
productive yield
- RPY
relative productive yield
- RIF
relative initiation frequency
- APR
abortive:productive ratio
- MSAT
maximum size of abortive transcript
- wt
wild-type
- σ2, σ4
sigma domain 2 or 4
- AdML
adenovirus major late promoter
References
- 1.Cheetham GM, Jeruzalmi D, Steitz TA. Structural basis for initiation of transcription from an RNA polymerase-promoter complex. Nature. 1999;399:80–83. doi: 10.1038/19999. [DOI] [PubMed] [Google Scholar]
- 2.Cheetham GM, Steitz TA. Structure of a transcribing T7 RNA polymerase initiation complex. Science. 1999;286:2305–2309. doi: 10.1126/science.286.5448.2305. [DOI] [PubMed] [Google Scholar]
- 3.Yin YW, Steitz TA. Structural basis for the transition from initiation to elongation transcription in T7 RNA polymerase. Science. 2002;298:1387–1395. doi: 10.1126/science.1077464. [DOI] [PubMed] [Google Scholar]
- 4.Tahirov TH, Temiakov D, Patlan AM, McAllister WT, Vassylyev DG, Yokoyama S. Structure of a T7 RNA polymerase elongation complex at 2.9 Å resolution. Nature. 2002;420:43–50. doi: 10.1038/nature01129. [DOI] [PubMed] [Google Scholar]
- 5.Murakami KS, Masuda S, Campbell EA, Mussin O, Darst SA. Structural basis of transcription initiation: an RNA polymerase holoenzyme-DNA complex. Science. 2002;296:1285–1290. doi: 10.1126/science.1069595. [DOI] [PubMed] [Google Scholar]
- 6.Korzheva N, Mustaev A, Kozlov M, Malhotra A, Nikiforov V, Goldfarb A, Darst SA. A structural model of transcription elongation. Science. 2000;289:619–625. doi: 10.1126/science.289.5479.619. [DOI] [PubMed] [Google Scholar]
- 7.Carpousis AJ, Gralla JD. Interaction of RNA polymerase with lacUV5 promoter DNA during mRNA initiation and elongation. Footprinting, methylation, and rifampicin-sensitivity changes accompanying transcription initiation. J Mol Biol. 1985;183:165–177. doi: 10.1016/0022-2836(85)90210-4. [DOI] [PubMed] [Google Scholar]
- 8.Zaychikov E, Denissova L, Heumann H. Translocation of the Escherichia coli transcription complex observed in the register 11 to 20: “jumping” of RNA polymerase and asymmetric expansion and contraction of the “transcription bubble”. Proc Natl Acad Sci U S A. 1995;92:1739–1743. doi: 10.1073/pnas.92.5.1739. [DOI] [PMC free article] [PubMed] [Google Scholar]
- 9.Bar-Nahum G, Nudler E. Isolation and characterization of sigma(70)-retaining transcription elongation complexes from Escherichia coli. Cell. 2001;106:443–451. doi: 10.1016/s0092-8674(01)00461-5. [DOI] [PubMed] [Google Scholar]
- 10.Mukhopadhyay J, Kapanidis AN, Mekler V, Kortkhonjia E, Ebright YW, Ebright RH. Translocation of sigma(70) with RNA polymerase during transcription: fluorescence resonance energy transfer assay for movement relative to DNA. Cell. 2001;106:453–463. doi: 10.1016/s0092-8674(01)00464-0. [DOI] [PubMed] [Google Scholar]
- 11.Ring BZ, Yarnell WS, Roberts JW. Function of E. coli RNA polymerase sigma factor sigma 70 in promoter-proximal pausing. Cell. 1996;86:485–493. doi: 10.1016/s0092-8674(00)80121-x. [DOI] [PubMed] [Google Scholar]
- 12.Mooney RA, Landick R. Tethering sigma70 to RNA polymerase reveals high in vivo activity of sigma factors and sigma70-dependent pausing at promoter-distal locations. Genes Dev. 2003;17:2839–2851. doi: 10.1101/gad.1142203. [DOI] [PMC free article] [PubMed] [Google Scholar]
- 13.Nickels BE, Mukhopadhyay J, Garrity SJ, Ebright RH, Hochschild A. The sigma 70 subunit of RNA polymerase mediates a promoter-proximal pause at the lac promoter. Nat Struct Mol Biol. 2004;11:544–550. doi: 10.1038/nsmb757. [DOI] [PubMed] [Google Scholar]
- 14.Mooney RA, Darst SA, Landick R. Sigma and RNA polymerase: an on-again, off-again relationship? Mol Cell. 2005;20:335–345. doi: 10.1016/j.molcel.2005.10.015. [DOI] [PubMed] [Google Scholar]
- 15.Liu C, Martin CT. Promoter clearance by T7 RNA polymerase. Initial bubble collapse and transcript dissociation monitored by base analog fluorescence. J Biol Chem. 2002;277:2725–2731. doi: 10.1074/jbc.M108856200. [DOI] [PubMed] [Google Scholar]
- 16.Vo NV, Hsu LM, Kane CM, Chamberlin MJ. In vitro studies of transcript initiation by E. coli RNA polymerase. 3. Influences of individual DNA elements within the promoter recognition region on abortive initiation and promoter escape. Biochemistry. 2003;42:3798–3811. doi: 10.1021/bi026962v. [DOI] [PubMed] [Google Scholar]
- 17.Hsu LM, Vo NV, Kane CM, Chamberlin MJ. In vitro studies of transcript initiation by E. coli RNA polymerase. 1. RNA chain initiation, abortive initiation, and promoter escape at three bacteriophage promoters. Biochemistry. 2003;42:3777–3786. doi: 10.1021/bi026954e. [DOI] [PubMed] [Google Scholar]
- 18.Knaus R, Bujard H. Principles governing the activity of E. coli promoters. In: Eckstein F, Lilley DM, editors. Nucleic Acids and Molecular Biology. Vol. 4. Springer-Verlag; Heidelberg: 1990. pp. 110–122. [Google Scholar]
- 19.Kammerer W, Deuschle U, Gentz R, Bujard H. Functional dissection of Escherichia coli promoters: information in the transcribed region is involved in late steps of the overall process. EMBO J. 1986;5:2995–3000. doi: 10.1002/j.1460-2075.1986.tb04597.x. [DOI] [PMC free article] [PubMed] [Google Scholar]
- 20.Uptain S. Ph D thesis. University of California; Berkeley, CA: 1997. Structural and functional characterization of Escherichia coli RNA polymerase ternary complexes during transcript elongation and termination. [Google Scholar]
- 21.Chamberlin M, Kingston R, Gilman M, Wiggs J, deVera A. Isolation of bacterial and bacteriophage RNA polymerase and their use in synthesis of RNA in vitro. Methods Enzymol. 1983;101:540–568. doi: 10.1016/0076-6879(83)01037-x. [DOI] [PubMed] [Google Scholar]
- 22.Schmidt MC, Chamberlin MJ. Amplification and isolation of Escherichia coli nusA protein and studies of its effects on in vitro RNA chain elongation. Biochemistry. 1984;23:197–203. doi: 10.1021/bi00297a004. [DOI] [PubMed] [Google Scholar]
- 23.Orlova M, Newlands J, Das A, Goldfarb A, Borukhov S. Intrinsic transcript cleavage activity of RNA polymerase. Proc Natl Acad Sci U S A. 1995;92:4596–4600. doi: 10.1073/pnas.92.10.4596. [DOI] [PMC free article] [PubMed] [Google Scholar]
- 24.Feng G, Lee DN, Wang D, Chan CL, Landick R. GreA-induced transcript cleavage in transcription complexes containing Escherichia coli RNA polymerase is controlled by multiple factors, including nascent transcript location and structure. J Biol Chem. 1994;269:22282–22294. [PubMed] [Google Scholar]
- 25.Brosius J. Plasmid vectors for the selection of promoters. Gene. 1984;27:151–160. doi: 10.1016/0378-1119(84)90136-7. [DOI] [PubMed] [Google Scholar]
- 26.Hsu LM. Quantitative parameters for promoter clearance. Method Enzymol. 1996;273:59–71. doi: 10.1016/s0076-6879(96)73006-9. [DOI] [PubMed] [Google Scholar]
- 27.Jacques JP, Kolakofsky D. Pseudo-templated transcription in prokaryotic and eukaryotic organisms. Genes Dev. 1991;5:707–713. doi: 10.1101/gad.5.5.707. [DOI] [PubMed] [Google Scholar]
- 28.Erie DA, Hajiseyedjavadi O, Young MC, von Hippel PH. Multiple RNA polymerase conformations and GreA: control of the fidelity of transcription. Science. 1993;262:867–873. doi: 10.1126/science.8235608. [DOI] [PubMed] [Google Scholar]
- 29.Komissarova N, Kashlev M. Functional topography of nascent RNA in elongation intermediates of RNA polymerase. Proc Natl Acad Sci U S A. 1998;95:14699–14704. doi: 10.1073/pnas.95.25.14699. [DOI] [PMC free article] [PubMed] [Google Scholar]
- 30.Borukhov S, Sagitov V, Goldfarb A. Transcript cleavage factors from E. coli. Cell. 1993;72:459–466. doi: 10.1016/0092-8674(93)90121-6. [DOI] [PubMed] [Google Scholar]
- 31.Hsu LM, Vo NV, Chamberlin MJ. Escherichia coli transcript cleavage factors GreA and GreB stimulate promoter escape and gene expression in vivo and in vitro. Proc Natl Acad Sci U S A. 1995;92:11588–11592. doi: 10.1073/pnas.92.25.11588. [DOI] [PMC free article] [PubMed] [Google Scholar]
- 32.Traviglia SL, Datwyler SA, Yan D, Ishihama A, Meares CF. Targeted protein footprinting: where different transcription factors bind to RNA polymerase. Biochemistry. 1999;38:15774–15778. doi: 10.1021/bi9917232. [DOI] [PubMed] [Google Scholar]
- 33.Borukhov S, Lee J, Laptenko O. Bacterial transcription elongation factors: new insights into molecular mechanism of action. Mol Microbiol. 2005;55:1315–1324. doi: 10.1111/j.1365-2958.2004.04481.x. [DOI] [PubMed] [Google Scholar]
- 34.Zhang Y, Hanna MM. NusA changes the conformation of Escherichia coli RNA polymerase at the binding site for the 3′ end of the nascent RNA. J Bacteriol. 1994;176:1787–1789. doi: 10.1128/jb.176.6.1787-1789.1994. [DOI] [PMC free article] [PubMed] [Google Scholar]
- 35.Liu K, Hanna M. NusA interferes with interactions between the nascent RNA and the C-terminal domain of the α subunit of RNA polymerase in Escherichia coli transcription complexes. Proc Natl Acad Sci USA. 1995;92:5012–5016. doi: 10.1073/pnas.92.11.5012. [DOI] [PMC free article] [PubMed] [Google Scholar]
- 36.Grayhack EJ, Yang X, Lau LF, Roberts JW. Phage lambda gene Q antiterminator recognizes RNA polymerase near the promoter and accelerates it through a pause site. Cell. 1985;42:259–269. doi: 10.1016/s0092-8674(85)80121-5. [DOI] [PubMed] [Google Scholar]
- 37.Burt J. Ph D thesis. University of California; Berkeley, CA: 2003. In vitro characterization of the transcript cleavage reaction of E. coli RNA polymerase. [Google Scholar]
- 38.Mah TF, Kuznedelov K, Mushegian A, Severinov K, Greenblatt J. The α subunit of E. coli RNA polymerase activates RNA binding by NusA. Genes Dev. 2000;14:2664–2675. doi: 10.1101/gad.822900. [DOI] [PMC free article] [PubMed] [Google Scholar]
- 39.Komissarova N, Kashlev M. Transcriptional arrest: Escherichia coli RNA polymerase translocates backward, leaving the 3′ end of the RNA intact and extruded. Proc Natl Acad Sci U S A. 1997;94:1755–1760. doi: 10.1073/pnas.94.5.1755. [DOI] [PMC free article] [PubMed] [Google Scholar]
- 40.Laptenko O, Lee J, Lomakin I, Borukhov S. Transcript cleavage factors GreA and GreB act as transient catalytic components of RNA polymerase. EMBO J. 2003;22:6322–6334. doi: 10.1093/emboj/cdg610. [DOI] [PMC free article] [PubMed] [Google Scholar]
- 41.Opalka N, Chlenov M, Chacon P, Rice WJ, Wriggers W, Darst SA. Structure and function of the transcript elongation factor GreB bound to bacterial RNA polymerase. Cell. 2003;114:335–345. doi: 10.1016/s0092-8674(03)00600-7. [DOI] [PubMed] [Google Scholar]
- 42.Record MT, Jr, Reznikoff WS, Craig ML, McQuade KL, Schlax PJ. Escherichia coli RNA polymerase (Eσ70), promoters, and the kinetics of the steps of transcription initiation. In: Neidhardt FC, Curtis R III, Ingraham JL, Lin ECC, Umbarger HE, editors. Escherichia coli and Salmonella typhimurium: Cellular and Molecular Biology. 2nd. ASM Press; Washington DC: 1996. pp. 792–821. [Google Scholar]
- 43.DeHaseth PL, Zupancic ML, Record MT., Jr RNA polymerase-promoter interactions: the comings and goings of RNA polymerase. J Bacteriol. 1998;180:3019–3025. doi: 10.1128/jb.180.12.3019-3025.1998. [DOI] [PMC free article] [PubMed] [Google Scholar]
- 44.Rojo F. Repression of transcription initiation in bacteria. J Bacteriol. 1999;181:2987–2991. doi: 10.1128/jb.181.10.2987-2991.1999. [DOI] [PMC free article] [PubMed] [Google Scholar]
- 45.Hsu LM. Promoter clearance and escape in prokaryotes. Biochim Biophys Acta. 2002;1577:191–207. doi: 10.1016/s0167-4781(02)00452-9. [DOI] [PubMed] [Google Scholar]
- 46.Nudler E, Mustaev A, Lukhtanov E, Goldfarb A. The RNA-DNA hybrid maintains the register of transcription by preventing backtracking of RNA polymerase. Cell. 1997;89:33–41. doi: 10.1016/s0092-8674(00)80180-4. [DOI] [PubMed] [Google Scholar]
- 47.Sidorenkov I, Komissarova N, Kashlev M. Crucial role of the RNA:DNA hybrid in the processivity of transcription. Mol Cell. 1998;2:55–64. doi: 10.1016/s1097-2765(00)80113-6. [DOI] [PubMed] [Google Scholar]
- 48.Vo NV. Ph D thesis. University of California; Berkeley, CA: 1998. In vitro studies of the transcript initiation process by E. coli RNA polymerase. [Google Scholar]
- 49.Chan CL, Gross CA. The anti-initial transcribed sequence, a portable sequence that impedes promoter escape, requires sigma70 for function. J Biol Chem. 2001;276:38201–38209. doi: 10.1074/jbc.M104764200. [DOI] [PubMed] [Google Scholar]
- 50.Toulme F, Mosrin-Huaman C, Sparkowski J, Das A, Leng M, Rahmouni AR. GreA and GreB proteins revive backtracked RNA polymerase in vivo by promoting transcript trimming. EMBO J. 2000;19:6853–6859. doi: 10.1093/emboj/19.24.6853. [DOI] [PMC free article] [PubMed] [Google Scholar]
- 51.Sosunova E, Sosunov V, Kozlov M, Nikiforov V, Goldfarb A, Mustaev A. Donation of catalytic residues to RNA polymerase active center by transcription factor Gre. Proc Natl Acad Sci U S A. 2003;100:15469–15474. doi: 10.1073/pnas.2536698100. [DOI] [PMC free article] [PubMed] [Google Scholar]
- 52.Marr MT, Datwyler SA, Meares CF, Roberts JW. Restructuring of an RNA polymerase holoenzyme elongation complex by lambdoid phage Q proteins. Proc Natl Acad Sci U S A. 2001;98:8972–8978. doi: 10.1073/pnas.161253298. [DOI] [PMC free article] [PubMed] [Google Scholar]
- 53.Straney DC, Crothers DM. A stressed intermediate in the formation of stably initiated RNA chains at the Escherichia coli lacUV5 promoter. J Mol Biol. 1987;193:267–278. doi: 10.1016/0022-2836(87)90218-x. [DOI] [PubMed] [Google Scholar]
- 54.Carpousis AJ, Gralla JD. Cycling of ribonucleic acid polymerase to produce oligonucleotides during initiation in vitro at the lacUV5 promoter. Biochemistry. 1980;19:3245–3253. doi: 10.1021/bi00555a023. [DOI] [PubMed] [Google Scholar]
- 55.Gnatt AL, Cramer P, Fu J, Bushnell DA, Kornberg RD. Structural basis of transcription: an RNA polymerase II elongation complex at 3.3 Å resolution. Science. 2001;292:1876–1882. doi: 10.1126/science.1059495. [DOI] [PubMed] [Google Scholar]
- 56.Isaksson J, Acharya S, Barman J, Cheruku P, Chattopadhyaya J. Single-stranded adenine-rich DNA and RNA retain structural characteristics of their respective double-stranded conformations and show directional differences in stacking pattern. Biochemistry. 2004;43:15996–16010. doi: 10.1021/bi048221v. [DOI] [PubMed] [Google Scholar]
- 57.Naryshkin N, Revyakin A, Kim Y, Mekler V, Ebright RH. Structural organization of the RNA polymerase-promoter open complex. Cell. 2000;101:601–611. doi: 10.1016/s0092-8674(00)80872-7. [DOI] [PubMed] [Google Scholar]
- 58.Gong P, Esposito EA, Martin CT. Initial bubble collapse plays a key role in the transition to elongation in T7 RNA polymerase. J Biol Chem. 2004;279:44277–44285. doi: 10.1074/jbc.M409118200. [DOI] [PubMed] [Google Scholar]
- 59.Guo Q, Sousa R. Multiple roles for the T7 promoter nontemplate strand during transcription initiation and polymerase release. J Biol Chem. 2005;280:3474–3482. doi: 10.1074/jbc.M412287200. [DOI] [PubMed] [Google Scholar]
- 60.Ring BZ, Roberts JW. Function of a nontranscribed DNA strand site in transcription elongation. Cell. 1994;78:317–324. doi: 10.1016/0092-8674(94)90300-x. [DOI] [PubMed] [Google Scholar]
- 61.Marr MT, Roberts JW. Promoter recognition as measured by binding of polymerase to nontemplate strand oligonucleotide. Science. 1997;276:1258–1260. doi: 10.1126/science.276.5316.1258. [DOI] [PubMed] [Google Scholar]
- 62.Artsimovitch I, Landick R. The transcriptional regulator RfaH stimulates RNA chain synthesis after recruitment to elongation complexes by the exposed nontemplate DNA strand. Cell. 2002;109:193–203. doi: 10.1016/s0092-8674(02)00724-9. [DOI] [PubMed] [Google Scholar]
- 63.Ryder AM, Roberts JW. Role of the non-template strand of the elongation bubble in intrinsic transcription termination. J Mol Biol. 2003;334:205–213. doi: 10.1016/j.jmb.2003.09.039. [DOI] [PubMed] [Google Scholar]
- 64.Pal M, McKean D, Luse DS. Promoter clearance by RNA polymerase II is an extended multistep process strongly affected by sequence. Mol Cell Biol. 2001;21:5815–5825. doi: 10.1128/MCB.21.17.5815-5825.2001. [DOI] [PMC free article] [PubMed] [Google Scholar]