Abstract
Lopinavir (LVR) is extensively metabolized by CYP3A4 and is prevented from entering the cells by membrane efflux pumps such as P-gp and MRP2. In an approach to evade the first-pass metabolism and efflux of LVR, peptide prodrugs of LVR [valine-valine-lopinavir (VVL) and glycine-valine-lopinavir (GVL)] were synthesized. Prodrugs were identified with 1H and 13C NMR spectra and LC/MS/MS was employed to evaluate their mass and purity. Solubility studies indicated that the prodrugs have much greater solubility as compared with LVR in water. In vitro evaluations were performed to determine affinities for efflux proteins (P-gp and MRP2) and CYP3A4 and permeabilities across intestinal barrier. Accumulation and transport data of VVL and GVL across MDCKII-MDR1 and MDCKII-MRP2 cells indicated evasion of prodrugs’ efflux by P-gp and MRP2 significantly. Permeability studies across Caco-2 cells indicated that the prodrugs are transported by peptide transporters and have increased permeability as compared with LVR. VVL and GVL exhibited significantly better degradation rate constants as compared with LVR in rat liver microsomes. Enzymatic stability studies in Caco-2 cell homogenate indicated that the peptide prodrugs are first converted to the ester intermediate and then finally to the parent drug. Overall, the advantages of utilizing peptide prodrugs include chemical modification of the compound to achieve targeted delivery via peptide transporters present across the intestinal epithelium, significant evasion of efflux and CYP3A4 mediated metabolism and significantly better solubility profiles. Therefore, in vitro studies demonstrated that peptide prodrug derivatization of LVR may be an effective strategy for bypassing its efflux and enhancing its systemic bioavailability.
Keywords: lopinavir, LVR, VL, VVL, GVL, peptide, prodrug, uptake, transport, permeability, efflux, metabolism
1. Introduction
Lopinavir (LVR), an analog of ritonavir (RVR) is a protease inhibitor (PI) indicated for the treatment of HIV infection. The combination of LVR and RVR is marketed under the trade name Kaletra®. LVR exhibits low oral bioavailability in rats and humans when given alone. One of the primary reasons for such low bioavailability may be extensive metabolism by CYP3A4 (Kumar et al., 2004). RVR significantly inhibits CYP3A4 metabolism of LVR and in combination with LVR enhances its systemic exposure. It is also known that LVR is a substrate for efflux transporters such as P-glycoprotein (P-gp) and Multidrug Resistance Protein (MRP2) (Agarwal et al., 2007a). Intestinal P-gp and MRP2 are localized extensively on the villus tip of enterocytes, the main site of absorption for orally administered compounds. These transporters are therefore, ideally distributed to limit oral absorption of LVR by secreting it back into the intestinal lumen. The process diminishes intracellular accumulation of LVR thereby reducing its anti-HIV efficacy. A coordinated function of CYP3A4 and P-gp/MRPs can dramatically lower oral bioavailability of compounds such as LVR which is a substrate for both.
Various strategies have been employed to inhibit both efflux and metabolism to improve oral absorption. Some common approaches include controlling expression of efflux transporters/metabolizing enzymes, co-administration of efflux/metabolism modulators and chemical modification of compounds such that efflux/metabolism is avoided (non-substrate strategy). The first two strategies are somewhat non-enabling due to the fact that normal physiological function may be compromised leading to side effects. Additionally, efflux modulators could cause increased toxic effects by inhibiting the efflux of cytotoxic molecules that are normally extruded by the efflux proteins in normal tissues. The non-substrate strategy has an advantage of not disturbing the physiological functioning of the efflux proteins in normal tissues and it does not require the use of any additional augmenting agent. One of the implementations of non-substrate strategy is transporter targeted prodrug derivatization. This approach involves utilization of influx proteins that facilitate transport of polar nutrients such as amino acids and peptides. Prodrugs can be designed by coupling amino acids/peptides to compounds such that they resemble the intestinal nutrients structurally and are absorbed by specific carrier proteins. Such amino acid and peptide prodrugs may offer an additional advantage of producing non-toxic nutrient molecules when prodrugs are converted to parent drug and pro-moieties. When a compound binds to a nutrient transporter, it triggers a configurational change in the transport protein allowing its translocation across the membrane and it is subsequently released into the cytoplasm. During this process the substrate is not freely available to efflux transporters located on the inner leaflet of the cell membrane. Circumventing P-gp/MRP2 mediated efflux not only increases absorption across intestinal mucosa but also decreases repetitive exposure to metabolizing enzymes in intestinal lumen. In addition to the possibility of enhanced intestinal permeation, prodrug derivatization of compounds may offer additional pharmaceutical, pharmacokinetic and toxicokinetic advantages such as better chemical stability, solubility and toxicity profiles. Therefore, transporter targeted prodrug derivatization strategy offers several possibilities that may prove to be advantageous for systemic delivery of LVR.
Peptide transporters are attractive targets in prodrug design to improve oral drug absorption. These carrier proteins tolerate diverse chemical modification in substrate structure; possess high capacity and broad substrate specificity. Peptide transporter targeted prodrug strategy has been successfully utilized in our laboratory as an attempt to increase absorption of poorly absorbed drugs such as acyclovir and ganciclovir for ocular delivery and quinidine and saquinavir for oral delivery (Dias et al., 2002; Anand et al., 2003; Anand et al., 2004; Jain et al., 2004; Majumdar et al., 2005; Patel et al., 2005; Gunda et al., 2006; Katragadda et al., 2006; Majumdar et al., 2006). Out of the various combinations of peptide prodrugs described in these research articles, valine-valine (VV) and glycine-valine (GV) prodrugs exhibited better pharmaceutical profiles. Based on prior results, VV and GV prodrugs of LVR [VVL and GVL] were designed to examine evasion of efflux pumps.
Solubilities of the prodrugs in distilled, deionized water were determined followed by cytotoxicity determinations at 4h in MDCKII-WT cells. Uptake and transport studies were conducted in MDCKII-MDR1 and MDCKII-MRP2 cells to test the affinity of the peptide prodrugs for efflux proteins. Transport studies were conducted in Caco-2 cells to compare prodrug permeabilities with LVR since peptide transporters are well expressed and characterized in Caco-2 cells (Thwaites et al., 1993; Guo et al., 1999). Rat liver microsomes were utilized to measure the extent of prodrug metabolism. In addition, chemical and enzymatic stability studies were also carried out.
2. Materials and Methods
2.1. Materials
Unlabeled (ulb) lopinavir and P-gp inhibitor, GF120918, were generous gifts from Abbott Laboratories Inc. and GlaxoSmithKline Ltd. respectively. 3H LVR (1Ci/mmol) and 3H Gly-Sar (4Ci/mmol) were purchased from Moravek Biochemicals (Brea, CA, USA). MK-571 was purchased from Biomol (Plymouth meeting, PA, USA). HPLC grade DMSO and methanol were obtained from Fisher Scientific Co. (Pittsburgh, PA, USA). These solvents were used neat for preparing stock solutions of all drugs and inhibitors. Trypsin-EDTA solution, Dulbecco’s modified Eagle’s medium (DMEM), Ham’s F-10 medium and Minimum Essential Medium (MEM) were obtained from Invitrogen (Carlsbad, CA, USA) and fetal bovine serum (FBS) was obtained from Atlanta biologicals (Lawrenceville, GA, USA). Transwell and uptake plates were procured from Corning Costar Corp (Cambridge, MA, USA). All other chemicals were of analytical reagent grade and were obtained from Fisher Scientific or Sigma Chemicals.
2.2. Methods
2.2.1. Cell Culture
Studies were performed with (a) stable Madin-Darby canine kidney cells type II transfectants overexpressing hMRP2 (MDCKII-MRP2 cells; passages 5 to 25) ; hP-gp/ MDR1 (MDCKII-MDR1 cells; passages 5 to 25) and wild type MDCKII cells generously provided by Drs. A. Schinkel and P. Borst, The Netherlands Cancer Institute, Amsterdam and (b) colon carcinoma cell line, Caco-2 (passages 20–30) obtained from ATCC (Manassas, VA, USA) as a model for intestinal barrier. These cell lines were cultured in T-75 flasks with DMEM (with high glucose and glutamine concentrations) supplemented with 10% FBS, 1% nonessential amino acids and penicillin and streptomycin at 100µg/ml. The medium was changed every alternate day; cells were harvested and passaged via trypsinization at 80 to 90% confluence (about 4–5 days of growth). Cells were also grown on collagen coated Transwell® inserts (0.4µm pore size, 12mm insert) with transparent polyester membranes. Transwell® inserts were coated with type 1 rat tail collagen (100µg/cm2), equilibrated with medium, and seeded at a density of 250,000 cells per well. Following seeding, medium was changed every alternate day, and transport or uptake studies were performed after incubation of 5–7 days for MDCKII and 17–21 days and Caco-2 cells respectively.
2.2.2. Solubility studies
Solubilities of the prodrugs were determined in distilled, deionized water (DDW). Saturated drug solutions were prepared in silicone coated microcentrifuge tubes and kept at room temperature (RT) for 24h in a shaker bath. At the end of 24h, the undissolved drug was removed by ultracentrifugation. The supernatant was appropriately diluted and drug concentration was measured with LC/MS/MS.
2.2.3. Cytotoxicity studies
Cytotoxicity of the prodrugs was determined in MDCKII-WT cells using an aqueous non-radioactive cytotoxicity kit based on the MTS assay. The assay determines cell viability based on the mitochondrial conversion of a water-soluble tetrazolium salt [3-(4,5-dimethylthiazol-2-yl)-2,5-diphenyltetrazolum bromide; MTT] to the water-insoluble blue formazan product. The cytotoxicity kit is supplied as a salt solution of MTT (known as MTS) with an electron coupling reagent PMS (phenazine methosulfate). PMS has enhanced chemical stability, which allows it to be combined with MTS to form a stable solution eliminating the need to solubilize formazan crystals using an external source. Briefly, cells were grown in 96 well tissue culture plates at 10,000 cells per well 24h prior to drug treatment. Culture medium was then replaced with 100µl of medium containing serial dilutions of the prodrugs (5–250µM). Cells were then incubated for 4h at 37°C under 5% CO2. At the end of treatment period, 20µl of MTS stock solution was added to each well. After addition of the MTS dye, the cells were incubated for 2h at 37°C. Cell viability was then assessed by measuring absorbance at 485nm on an automated plate reader (Biorad, Hercules, CA). The quantity of formazan product as measured by the amount of 485nm absorbance is directly proportional to the number of living cells in culture.
2.2.4. Uptake studies
Uptake studies were conducted with confluent cell monolayers. Medium was aspirated and cells were washed three times with DPBS. All drug solutions were prepared immediately prior to an experiment. LVR and prodrugs (VVL and GVL) were dissolved in methanol (not exceeding 2% v/v as the final concentration) and inhibitors were separately dissolved in DMSO (not exceeding 2% v/v as the final concentration) to prepare a stock solution and then diluted with DPBS to the specified final concentrations. Control solutions contained the same amount of methanol/DMSO as the drug solutions. Test solutions that showed some precipitation with higher concentrations of drugs were sonicated for 1min until clear. The study was initiated by adding 1ml of drug solution (in the presence or absence of competing substrates) to the wells. Incubation was carried out over a period of 15min at 37°C. At the end of an incubation period, drug solution was removed and the cell monolayer was washed three times with ice-cold stop solution. Cells were lysed overnight with 1ml 0.1% (w/v) Triton X-100 in 0.3N sodium hydroxide at RT. Aliquots (500µl) were withdrawn from each well and transferred to vials containing 5ml scintillation cocktail. Samples were then analyzed with a Beckman scintillation counter (Model LS-6500, Beckman Instruments, Inc.). Uptake was normalized to the protein content of each well. Amount of protein in the cell lysate was quantified by the method of Bradford utilizing BioRad protein estimation kit (BioRad, Hercules, CA).
2.2.5. Transport studies
The pHs used for transport studies are pH 4 for peptide transport studies in MDCK cells, pH 7.4 for all other transport studies in MDCK cells and pH 5 for transport studies in Caco-2 cells. Volumes of test solutions added were 0.5 and 1.5 ml, for apical (A) and basolateral (B) chambers respectively. Prior to initiating an experiment, cultured monolayers were rinsed and equilibrated for 30min with DPBS. Drug solution was added either in the donor or receiving chamber for A-B and B-A transport studies. Samples (100µl) were withdrawn from the receiving chamber at predetermined time points (15, 30, 60, 90, 120, 150, 180, 210 and 240min) and were replaced with equal volume of DPBS to maintain sink conditions. Dilutions were taken into account for the calculations. Samples were stored at −80°C until further analysis. All the experiments were performed at 37°C in triplicate.
2.2.6. Metabolism studies
Rat liver microsomes were employed to study the prodrugs’ affinity for CYP3A4 relative to LVR. Individual incubations (final volume 1ml) consisted of 1mg/ml microsomal protein in 100mM phosphate buffer (pH 7.4) with final concentrations of 5mM magnesium chloride, 5mM glucose 6-phosphate, 1mM b-NADP1, and 1U/ml glucose 6- phosphate dehydrogenase. The drug and prodrug at a concentration of 10µg/ml, buffer, and microsomes were mixed and kept at 37°C for 5min. The reaction was initiated by adding the NADPH generating system. Incubations were conducted at 37°C. Samples (50µl) were collected at predetermined time points (0, 5, 10, 15, 30, 45, 60, 90, 120min). The metabolic reaction was stopped by adding equal volumes of ice-cold acetonitrile: methanol (5:4) mixture to the sample. Samples were stored at −80°C until further analysis. All the experiments were performed at 37°C in triplicate.
2.2.7. Stability studies
Confluent Caco-2 cells were washed three times with DPBS. Cells were then isolated with the aid of a mechanical scraper and suspended in two volumes of DPBS and homogenized (Multipro variable speed homogenizer, DREMEL; Racine, WI). Protein content was determined according to the method of Bradford (Bradford, 1976) with BioRad protein estimation kit. Suitable dilutions were made to achieve a final protein concentration of 1mg/ml. An aliquot (1ml) of the cell homogenate was incubated with prodrug solution at a final concentration of 10µg/ml at 37°C in a shaking water bath (60 r.p.m). Samples (100µl) were withdrawn at predetermined time points and an equal volume of ice-cold acetonitrile: methanol (5:4) mixture was added to stop the enzymatic hydrolysis. Samples were stored at −80°C until further analysis. Stability was determined similarly at pH 3.4, 5.4 and 7.4 by incubating prodrug solution in DPBS (5ml).
2.2.8. Sample preparation
Study samples were analyzed with LC/MS/MS. Sample preparation was carried out using liquid-liquid extraction technique. Amprenavir (AMP), a PI, similar in structure to LVR was employed as an internal standard (IS) for analysis. The organic solvent, methyl- tert-butyl ether was utilized to extract the drug from the aqueous phase. Briefly, 50µl of IS was added to the transport sample (100µl). Each sample was mixed with 500µl of organic solvent. All samples were vortexed again for 1–2min to allow enough time for the drug to partition into the organic phase. For efficient separation of the aqueous and organic layers, samples were centrifuged at 25000g for 5min and then were stored at −20°C for sufficient time to allow freezing of the aqueous layer. The organic layer was decanted and samples were dried in vacuum. The residue was reconstituted in 100µl of DDW containing 0.5% Cremophor EL to allow efficient solubilization of the dried drug in water. This reconstituted extract was injected onto the LC/MS/MS for analysis. Standard solutions in buffer were also extracted and quantified exactly following the same procedure. Relative extraction efficiency (ratio of area for analyte v/s area for IS) for LVR, VVL and GVL was ~90%.
2.2.9. LC/MS/MS analysis
QTrap® LC/MS/MS mass spectrometer (Applied Biosystems, Foster City, CA, USA) equipped with Agilent 1100 Series quaternary pump (Agilent G1311A), vacuum degasser (Agilent G1379A) and autosampler (Agilent G1367A, Agilent Technology Inc., Palo Alto, CA, USA) was employed to analyze samples from transport and metabolism studies. HPLC separation was performed on a Luna C 18(2) column 100×2.0mm, 3µm (Phenomenex, Torrance, CA). The mobile phase (20% methanol; 65% acetonitrile and 15% 0.1% TFA in water) was used at a flow rate of 0.2ml/min. The sample (50µl) was injected and chromatographs were collected for 6min. Electrospray ionization in the positive mode was employed in the sample introduction. The detection was operated in multiple-reaction monitoring (MRM) mode. Precursor ion of analytes and internal standard were determined from spectra obtained during the infusion of standard solutions using an infusion pump connected directly to the electrospray source. As a result of very soft ionization provided by the electrospray ion source, only singly charged molecular ions were observed. Each of these precursor ions was subjected to collision-induced dissociation to determine the product ions. The precursor and the product ions generated were; LVR + 629.3/155.2; VVL + 828.4/155.2; GVL + 786.3/155.2; VL + 728.3/155.2 and AMP (IS) + 506.3/156.1. The turbo ion spray setting and collision gas pressure were optimized (IS Voltage: 5500V, temperature: 300°C, nebulizer gas: 40psi, curtain gas: 40psi). MS/MS was performed using nitrogen as collision gas. Other ion source parameters employed were: declustering potential (DP): 50V; collision energy (CE): 70V; entrance potential (EP) 5V; and collision cell exit potential (CXP) 3V. Peak areas for all components were automatically integrated by using Analyst™ software, and peak-area ratios (area for analyte v/s area for IS) were plotted vs concentration by weighted linear regression (1/concentration). The analytical data resulting from prodrugs with MRM method show a significant linearity that extends to ng range. The lower limits of quantification were found to be 5 ng/ml for LVR and 15 ng/ml for VL, VVL and GVL respectively. This method gave rapid and reproducible results.
2.3. Data analysis
Cumulative amounts of prodrugs (VVL or GVL), the intermediate VL and the parent drug LVR, generated during transport across the cell monolayers were plotted as a function of time to determine permeability coefficients. Linear regression of the amounts transported as a function of time yielded the rate of transport across the cell monolayer (dM/dt). Rate divided by the cross-sectional area available for transport (A) generated the steady state flux as shown in Eq. 1.
| Eq. 1 |
In all the transport studies, slopes obtained from the linear portion of the curve were used to calculate permeability values. Permeability was calculated by normalizing the steady state flux to the donor concentration (Cd) of the drug or prodrug as shown in Eq. 2.
| Eq. 2 |
2.4. Statistical analysis
All experiments were conducted at least in triplicate and results are expressed as mean ± S.E.M/S.D. Statistical comparisons of mean values were performed with Student t test (Graph Pad INSTAT, version 3.1). A value of *P < 0.05 was considered to be statistically significant.
3. Synthesis and identification of prodrugs
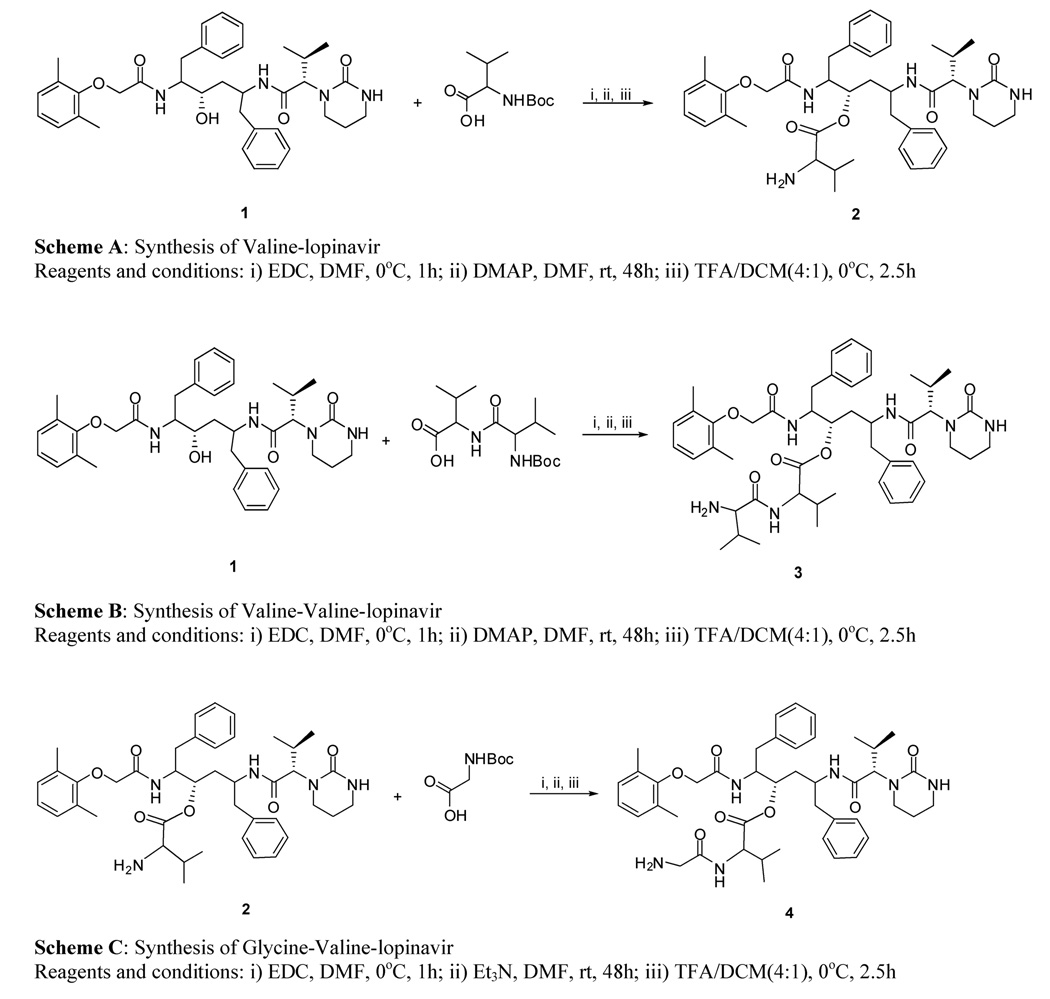
Peptide prodrugs of LVR were synthesized and identified in our laboratory. The synthetic schemes for VL (2), VVL (3) and GVL (4) are outlined in Fig.1.
Fig. 1.
Synthetic schemes for valine-lopinavir (Scheme A), valine-valine lopinavir (Scheme B) and glycine-valine-lopinavir (Scheme C)
1= lopinavir, 2= valine-lopinavir, 3=valine-valine-lopinavir, 4= glycine-valine-lopinavir
3.1. Synthesis of prodrugs
All chemicals were obtained from commercial suppliers and were of reagent grade. The reactions were run under argon atmosphere. Commercially available N-Boc-Val-OH (346mg, 1.59mmol) was dissolved in dry dimethyl formamide (DMF) (10ml) and the mixture was allowed to cool down to 0°C using an ice bath. 1-Ethyl-3-(3-dimethyllaminopropyl)carbodiimide (EDC) (304mg, 1.59mmol) was added to this mixture (mixture 1) and stirred for 1h at 0°C. In a separate reaction flask, LVR (500mg, 0.79mmol) was dissolved in DMF and dimethyl amino pyridine (DMAP) (120mg, 0.98mmol) was added to activate the secondary hydroxyl group of LVR. This mixture (mixture 2) was continuously stirred for 10min at RT under inert atmosphere. Mixture 2 was added to mixture 1 through a syringe and the temperature was allowed to come to RT while continually stirring for 48h. Small portions of this reaction mixture were taken out and injected into the LC/MS/MS to ensure complete conversion of the starting material to product. The reaction mixture was filtered and solvent was evaporated at RT under reduced pressure to get crude product. The product N-Boc-VL was purified by silica column chromatography using 6% methanol/dichloromethane (MeOH/DCM) as eluent with ~84% yield. VVL was synthesized using the same procedure except that the starting material was N-Boc-Val-Val-OH (503mg, 1.59mmol). The product N-Boc-VVL was purified by silica column chromatography using 6% MeOH/DCM as eluent with 77% yield. For GVL synthesis, the starting material was N-Boc-Gly-OH (240mg, 1.37mmol) and mixture 2 was prepared by dissolving VL (2) (500mg, 0.68mmol) instead of LVR in DMF and triethylamine (TEA) (2ml) was added to activate the primary amino group of VL. The product N-Boc-GVL was purified by silica column chromatography using 6% MeOH/DCM as eluent with 87% yield.
3.2. Procedure for the deprotection of the N-Boc Group
N-Boc-VL, N-Boc-VVL and N-Boc-GVL were treated with 80% trifluroacetic acid/dicholoromethane (TFA/CH2Cl2) at 0°C for 2.5h. The filtrate was dried under reduced pressure to constant weight. Crude products were purified by recrystallization from cold diethyl ether to get the final product with a yield of ~98%. The prodrugs were dried under vacuum for 10h and stored at −20°C until further use.
3.3. Identification of the prodrugs
1H and 13C NMR spectra were recorded on Varian Mercury 400 Plus spectrometer using tetra methyl silane as an IS. Chemical shifts (δ) are reported in parts per million relative to the NMR solvent signal (CD3OD, 3.31 ppm for proton and 49.15 ppm for carbon NMR spectra). Mass analysis was carried out using the same LC/MS/MS spectrometer as mentioned earlier under Enhanced Mass (EMS) mode. Electron-spray Ionization (ESI) was used as an ion source and was operated in positive and negative ion modes.
VL (2)
Low melting solid; LC/MS(M/z): 728.3; 1HNMR(CD3OD): δ 0.83–0.91 (dd, J = 7 Hz, 20Hz, 6H), 1.121–1.21 (dd, J = 7 Hz, 20 Hz, 6H), 1.25–1.40 (m, 2H), 1.53 –1.98, m, 6H), 2.1 (s, 6H), 2.46 – 2.57 (m, 2H), 2.68 – 3.12 (m, 6H), 4.01 – 4.26 (m, 3H), 4.33 – 4.38 (m, 1H), 5.19 – 5.23 (m, 1H), 6.86 – 6.96 (m, 3H), 7.11 – 7.28 (m, 10H); 13C NMR(CD3OD): 16.55, 17.90, 19.04, 20.31, 22.58, 26.87, 27.02, 30.84, 34.89, 38.93, 39.18, 40.87, 41.68, 41.81, 52.70, 59.82, 64.07, 71.12, 77.84, 125.97, 127.41, 127.92, 129.44, 129.53, 129.66, 130.24, 130.39, 130.47, 130.65, 131.79, 138.90, 139.77, 155.92, 158.60, 170.06, 171.59, 172.09
VVL (3)
Low melting solid, LC/MS(M/z): 827.6, 1HNMR(CD3OD): δ 0.81–0.91 (m, 6H), 1.04 – 1.11(m, 12H), 1.63 – 1.96 (m, 4H), 2.11 – 2.15 (m, 1H), 2.17 (s, 3H), 2.18 (s, 3H), 2.20 – 2.42 (m, 2H), 2.54 – 2.75 (m, 2H), 2.75 – 2.93 (m, 4H), 2.98 – 3.14 (m, 3H), 3.79 – 3.86 (m, 1H), 4.08 – 4.30 (m, 3H), 4.39 – 4.52 (m, 2H), 5.14 – 5.25 (m, 1H), 6.92 – 7.02 (m, 3H), 7.15 – 7.35 (m, 10H); 13CNMR(CD3OD): 16.58, 16.63, 17.83, 18.06, 19.00, 20.07, 22.33, 22.58, 26.21, 26.87, 27.03, 31.41, 34.89, 38.56, 39.03, 40.87, 41.61, 41.97, 52.66, 59.56, 60.03, 64.03, 71.14, 76.07, 125.96, 127.32, 127.86, 129.53, 129.63, 130.44, 130.59, 130.67, 131.82, 131.81, 139.05, 139.88, 155.99, 158.52, 170.30, 171.97, 172.67
GVL (4)
Low melting solid, LC/MS(M/z): 784.5, 1HNMR(CD3OD): δ 0.81–0.89 (dd, J = 7Hz, 20Hz, 6H), 1.02 – 1.08 (m, 6H), 1.30 – 1.48 (m, 2H), 1.66–1.73 (m, 3H), 1.79– 1.86 (m, 3H), 2.18 (s, 6H), 2.33 – 2.38 (m, 1H), 2.55 – 2.61 (m, 1H), 2.71 – 3.03 (m, 4H),3.11 – 3.15 (m, 2H), 3.42 – 3.47 (m, 1H), 4.05 – 4.19 (m, 2H), 4.26 – 4.35 (m, 2H), 4.74 – 4.79 (m, 1H), 5.18 – 5.22 (m, 1H), 6.91 – 6.94 (m, 3H), 7.14 – 7.32 (m, 10H); 13C NMR(CD3OD): 16.58, 18.48, 19.05, 20.09, 20.30, 22.58, 26.20, 26.87, 27.03, 31.67, 34.87, 38.75, 38.89, 40.86, 41.51, 41.67, 53.42, 59.87, 64.08, 71.02, 75.66, 125.93, 127.38, 127.82, 129.51, 129.59, 130.21, 130.52, 130.66, 131.81, 131.89, 139.00, 139.86, 155.90, 158.61, 167.87, 171.54, 171.87, 172.32
4. Results and Discussion
4.1. Solubility study in distilled, deionized water
Solubility studies were carried out in DDW. Saturation solubility values of VVL and GVL were found to be 0.40 ± 0.06 and 0.57 ± 0.12 mg/ml respectively relative to 0.04 ± 0.008 mg/ml for LVR. These values are much higher relative to LVR which is practically insoluble in water. Such increase in solubility offers an added benefit for a drug like LVR which is almost completely insoluble in water and has to be given as 40% v/v alcohol solution (in the liquid form) to HIV patients. Such high alcoholic content can be disadvantageous or even toxic for pediatric patients. Therefore, increased solubility of the prodrugs may offer some formulation-related advantages in these patient populations.
4.2. Cytotoxicity studies
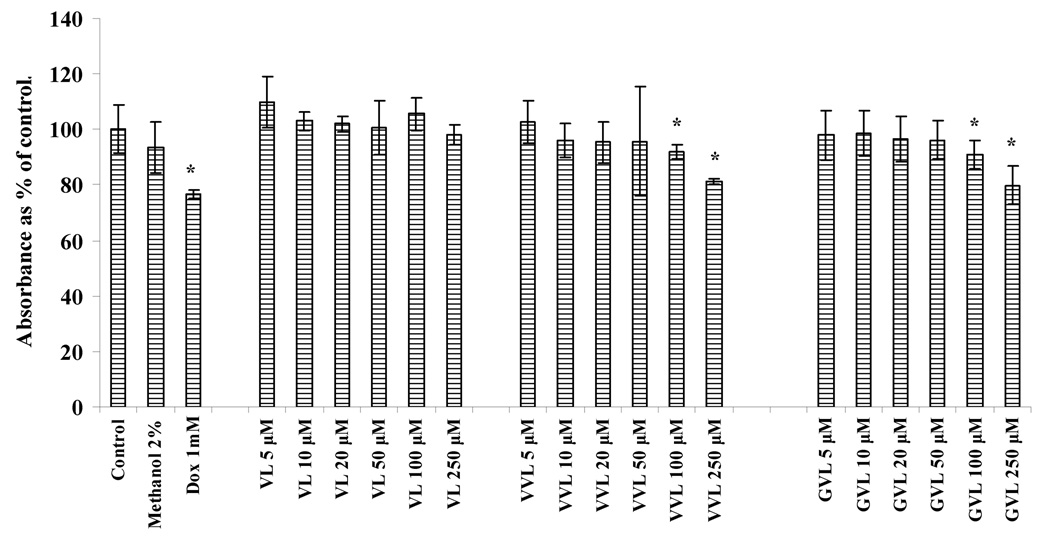
Results obtained from cytotoxicity studies at 4h are depicted in Fig 2. Blank medium (without any drug) was used as control. Medium containing methanol at 2% was also tested to confirm that methanol is not cytotoxic at that concentration. Doxorubicin at 1mg/ml was used as positive control. At the end of 4h, 5–50µM of prodrug concentrations (VL, VVL and GVL) were not significantly cytotoxic but when used at concentrations of 100 and 250µM, VVL and GVL exhibited some cytotoxicity to the cells. For transport experiments that were carried out for 4h, the concentrations of VVL and GVL used were 25µM which are not cytotoxic to the cells.
Fig. 2.
Cytotoxicity result obtained in MDCKII-WT cells after 4h of treatment with prodrugs
Asterisk (*) represents significant difference from control (p <0.05)
4.3. Concentration dependent uptake studies in MDCKII-MDR1 and MDCKII-MRP2 cells
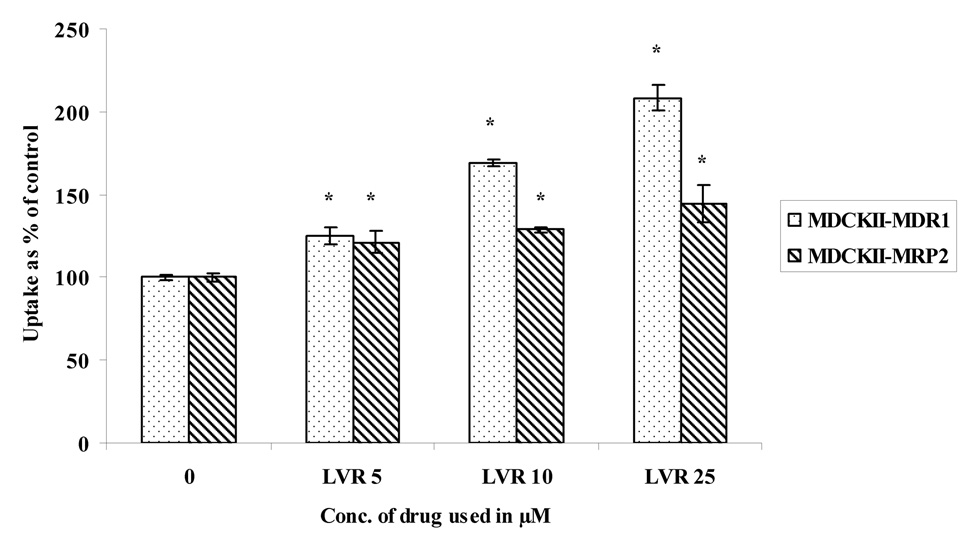
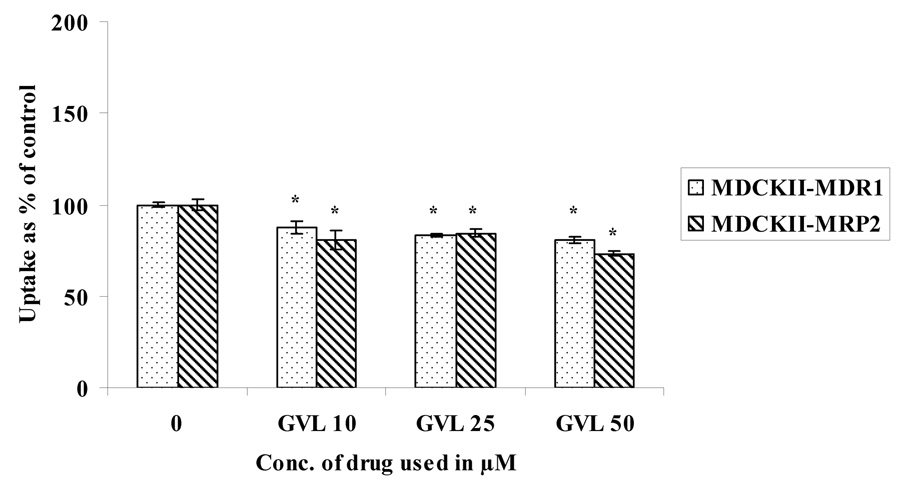
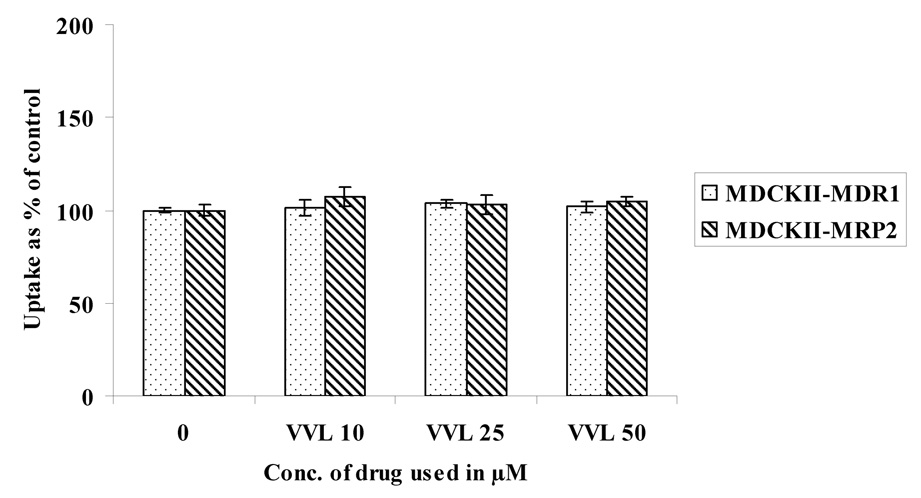
Concentration dependent uptake studies were carried out in MDCKII-MDR1 and MDCKII-MRP2 cells to determine the extent of interaction of these prodrugs with the efflux proteins. Uptake of 3H LVR (0.5 µCi/mL) was studied in the presence of increasing concentrations of LVR, VVL and GVL (Fig. 3– Fig. 5). LVR uptake was significantly enhanced in the presence of increasing concentrations of unlabeled (ulb) LVR (Fig.3) in both the cell lines. However, there was no enhancement in LVR uptake with rising concentrations of VVL (Fig.4.) or GVL (Fig.5.) in either cell line suggesting that VVL and GVL may not be substrates for P-gp and MRP2. Uptake of LVR diminished significantly with an elevation of GVL levels in both cell lines. This result may be explained if both LVR and GVL compete for a common influx process. We are now trying to investigate the possibility of this phenomenon.
Fig. 3.
Uptake of 3H LVR in the presence of increasing concentrations of unlabeled LVR in MDCKII-MDR1 and MDCKII-MRP2 cells
Asterisk (*) represents significant difference from control (p <0.05)
Fig. 5.
Uptake of 3H LVR in the presence of increasing concentrations of GVL in MDCKII-MDR1 and MDCKII-MRP2 cells
Asterisk (*) represents significant difference from control (p <0.05)
Fig. 4.
Uptake of 3H LVR in the presence of increasing concentrations of VVL in MDCKII-MDR1 and MDCKII-MRP2 cells
Asterisk (*) represents significant difference from control (p <0.05)
4.4. Interaction with peptide transporters in MDCKII-MDR1 and MDCKII-MRP2 cells
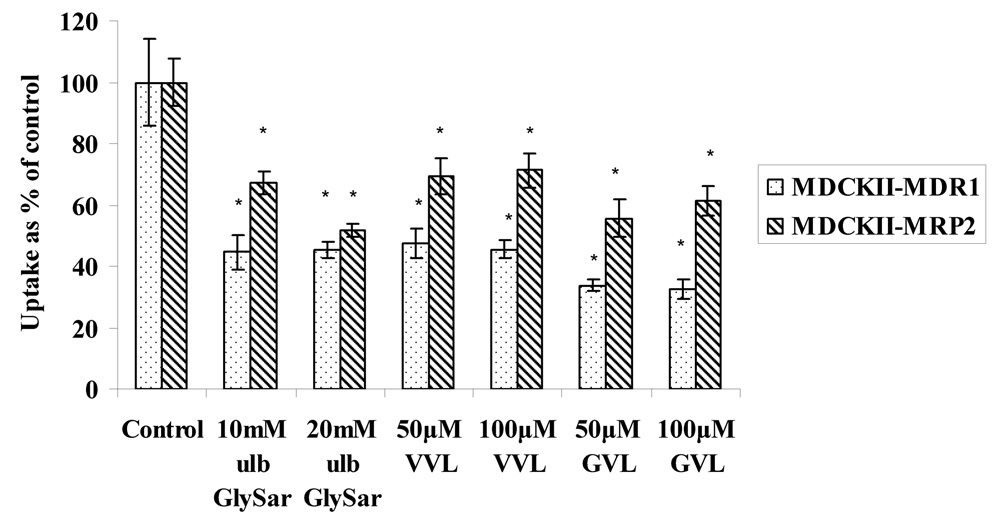
Uptake of 3H Gly-Sar (GS), a model substrate for peptide transporters, in the presence of ulb GS and prodrugs was carried out in both the cell lines to determine if the prodrugs are recognized by the peptide transporters. Uptake of 3H GS (0.5µCi/mL), was inhibited in the presence of ulb GS, at concentrations of 10mM and 20mM in both the cell lines (Fig.6). Uptake of 3H Gly-Sar was also significantly lower in the presence of relatively low amounts of prodrugs (50 and 100µM) in both cell lines. These studies suggest that peptide transporters are expressed and functional in both the cell lines and the prodrugs are recognized by these membrane proteins.
Fig. 6.
Uptake of 3H Gly-Sar in the presence and absence of unlabeled Gly-Sar, VVL and GVL in MDCKII-MDR1 and MDCKII-MRP2 cells
Asterisk (*) represents significant difference from control (p <0.05)
4.5. Transport across MDCKII-MDR1 and MDCKII-MRP2 cells
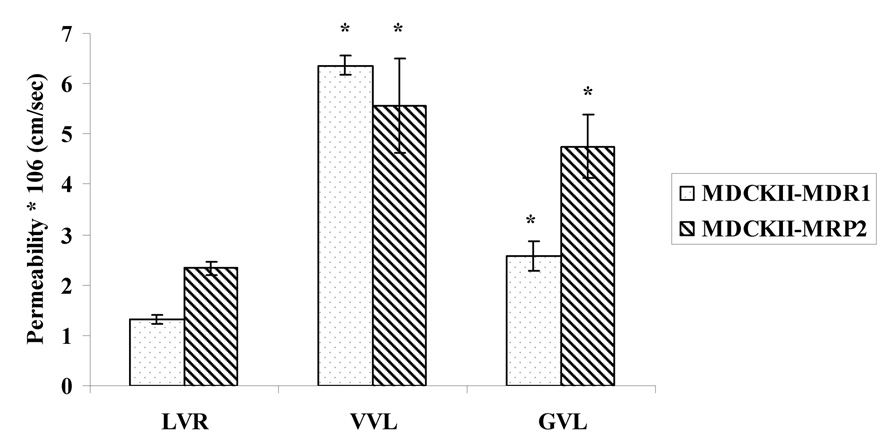
Permeabilities of the prodrugs (25µM) were compared with LVR (25µM) across the apical cell layer of the MDCKII-MDR1 and MDCKII-MRP2 cells (Fig.7.). The apical cell layer expresses functional efflux (P-gp or MRP2) as well as influx (peptide) transporters; which makes it convenient for us to compare the permeability values of both the parent drug and the prodrugs in the same cell line. This study was performed at pH 4 because highest permeabilities of Gly-Sar were found to be at this pH in the MDCKII-MDR1 cell line (Agarwal et al., 2007b). Permeabilities of VVL and GVL were found to be 6.37 and 2.58*10−6 cm/sec respectively relative to 1.32*10−6 cm/sec for LVR in MDCKII-MDR1 cells. Permeabilities of VVL and GVL were found to be 5.56 and 4.75*10−6 cm/sec respectively as compared to 2.33*10−6 cm/sec for LVR in MDCKII-MRP2 cells. This study indicates that the prodrugs may exhibit greater oral absorption than LVR because of less affinity for the efflux transporters and significant uptake into cells by the high capacity peptide transporters. Transport of prodrugs was also conducted in both MDCKII cell lines in the presence and absence of specific efflux pump inhibitors. GF120918 (2µM) and MK-571 (100µM) were added as specific inhibitors of P-gp and MRPs respectively (Agarwal et al., 2007a). Permeabilities of VVL and GVL in the presence of GF120918 in MDCKII-MDR1 cells were 6.86 ± 0.82*10−6 cm/sec and 2.53 ± 0.37*10−6 cm/sec respectively. Similarly permeabilities of VVL and GVL in the presence of MK 571 in MDCKII-MRP2 cells were 5.03 ± 0.53*10−6 cm/sec and 5.23 ± 0.77*10−6 cm/sec respectively. Thus, no significant enhancement in the permeabilities of VVL and GVL in the presence of MDR1 efflux and MRP2 efflux inhibitors was observed when compared to permeabilities of the prodrugs when efflux inhibitors were absent. This study confirms our earlier observation that the prodrugs have significantly lower affinity for efflux proteins relative to the parent drug LVR.
Fig. 7.
Permeability of VVL and GVL as compared with LVR in MDCKII-MDR1 and MDCKII-MRP2 cells
Asterisk (*) represents significant difference from control (p <0.05)
4.6. Permeability of the prodrugs across Caco-2 cells
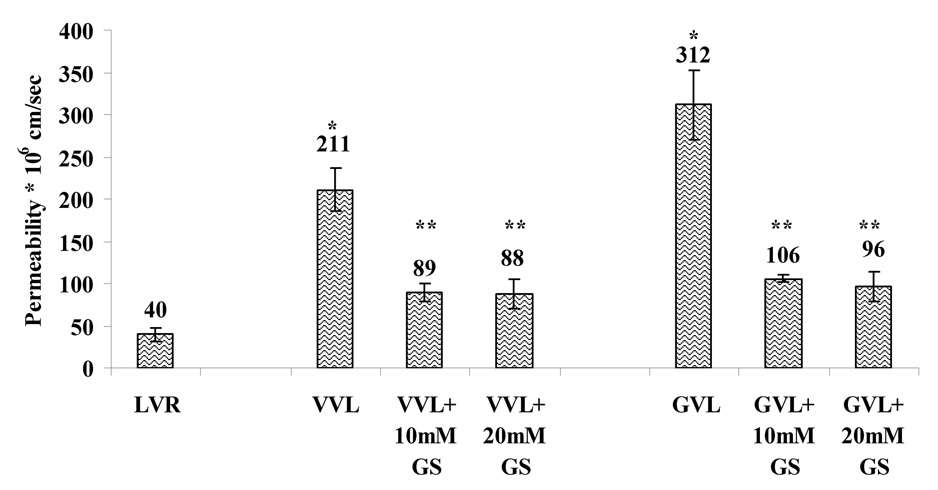
Since Caco-2 cells have been recognized as a good in vitro model for intestinal absorption, the permeabilities of LVR and its prodrugs were also estimated across the apical cell layer of this cell line. Permeabilities of the prodrugs were compared with LVR (all used at 10µM) across the apical side of the Caco-2 cells (Fig.8). Significantly higher permeabilities of VVL and GVL (211 * 10−6 and 312 * 10−6 cm/sec respectively) as compared to 40 * 10−6 cm/sec for LVR were observed. Significant enhancement of the absorptive fluxes for the prodrugs (5.28 folds for VVL and 7.8 folds for GVL) were noted. This study indicates that peptide prodrugs of LVR not only exhibit better solubility profiles as compared with LVR but also possess significantly higher permeabilities. This study also confirms our results obtained from MDCKII cells that the prodrug derivatization of LVR has the potential to improve oral absorption. To observe specific transport by peptide transporters in Caco-2 cells, permeabilities of the prodrugs were also observed in presence of ulb GS used at concentrations of 10 and 20mM (Fig.7.). Permeabilities of VVL and GVL were found to be 89 * 10−6 and 106 * 10−6 cm/sec in the presence of 10mM Gly-Sar and 88 * 10−6 and 96 * 10−6 cm/sec in the presence of 20mM Gly-Sar respectively. Transport of VVL and GVL was significantly inhibited in the presence of 10 and 20mM Gly-Sar respectively. This result confirmed our previous conclusion from uptake studies that absorptive flux of prodrugs is significantly inhibited in the presence of ulb GS. This study also indicated that prodrugs are good substrates for the peptide transporters expressed on the intestinal barrier and may be translocated efficiently resulting in higher oral bioavailability.
Fig. 8.
Permeability of VVL and GVL as compared with LVR in Caco-2 cells
Asterisk (*) represents significant difference from control (LVR) (p <0.05) Two asterisks (**) represent significant difference from control - when Gly-Sar is absent (p <0.05)
4.7. Metabolism study in rat liver microsomes
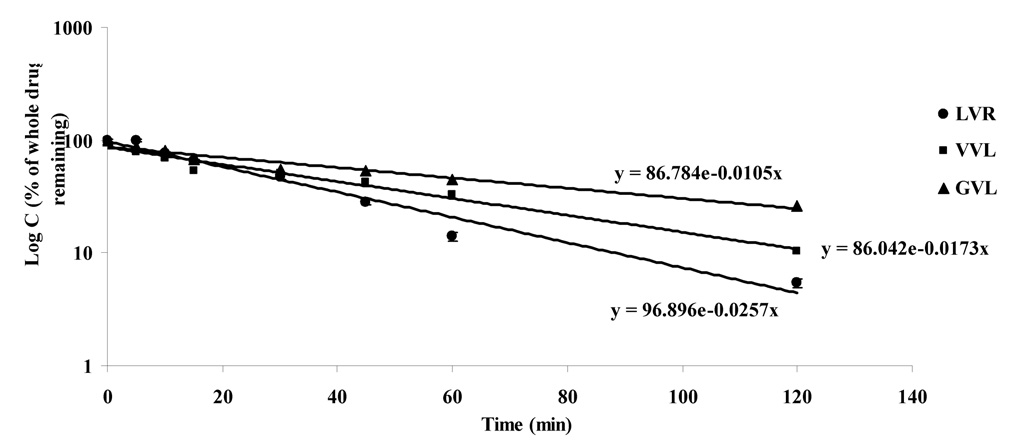
Since LVR undergoes extensive first-pass metabolism and is primarily metabolized by CYP3A4, it is necessary to compare the metabolism of the prodrugs in relation to the parent drug LVR. The first-order degradation profiles for the prodrugs are depicted in Fig.9. As compared with LVR (degradation rate constant, 0.0257 sec−1), its peptide prodrugs were able to sustain their levels for a longer time. Degradation rate constants for VVL and GVL were found to be 0.0173 (increase of 1.48 fold) and 0.0105 sec−1 (increase of 2.44 fold) respectively. At the end of 2h, only 5.4% of the starting amount of LVR was detected in the sample as compared to 10.4 and 26% of VVL and GVL respectively. These results indicated that due to decreased affinity of the prodrugs for CYP3A4, these compounds may bypass first-pass metabolism to a significant extent following oral administration.
Fig. 9.
Degradation profile in rat liver microsomes [Log C (% whole drug remaining) v/s time]
4.8. Stability studies in Caco-2 cell homogenate and DPBS
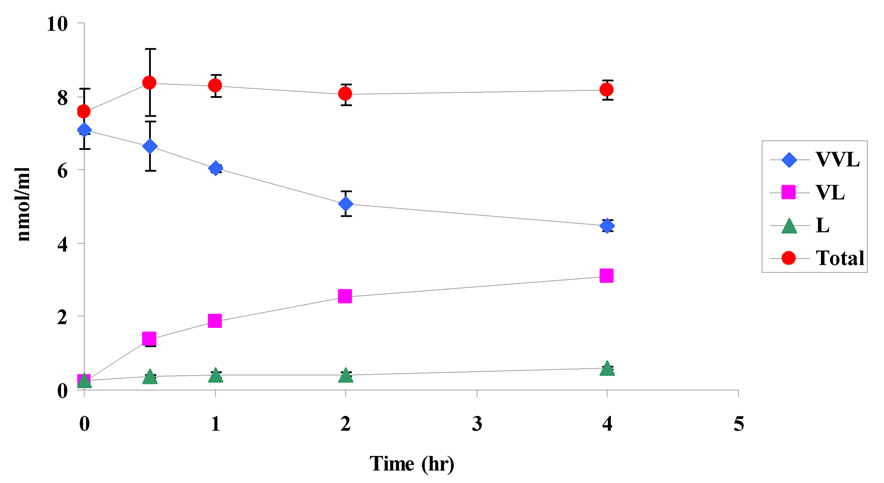
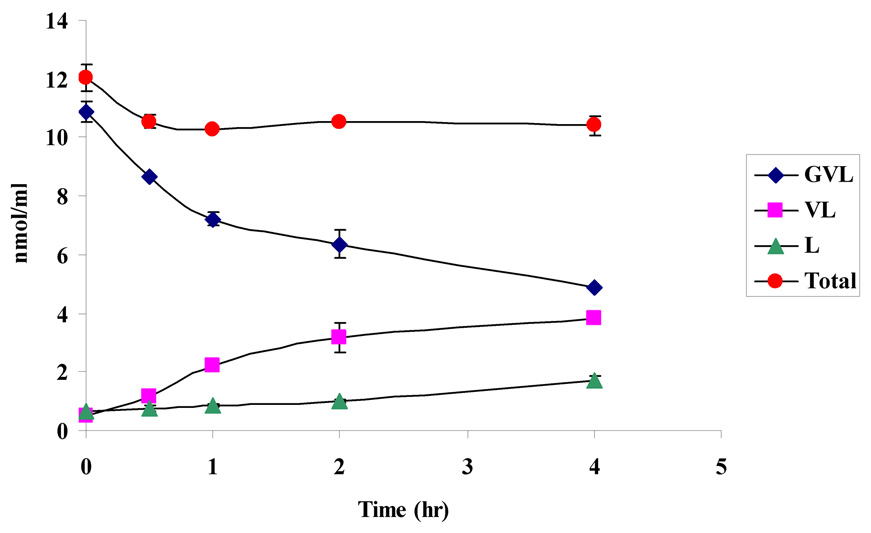
Stability of the prodrugs was determined in Caco-2 cell homogenate at pH 7.4 for a period of 4h to verify the regeneration of the parent drug. Prodrugs in their original forms (VVL and GVL), their amino acid derivative (VL) and the parent drug (LVR) were detected in the cell homogenate samples (Figs. 10a and 10b). At the end of 4h, 63% and 46% of the initial amounts of VVL and GVL were detected in the samples. These results also indicate that the peptide prodrugs of LVR are first degraded by peptidases to generate the ester intermediate (VL) which is further cleaved by esterases to the parent drug LVR. Stability of the prodrugs was also determined in different buffers (pH 3.4, 5.4 and 7.4). The results indicate that the prodrugs are stable under different buffer pHs and did not exhibit significant degradation for a period of 4h (data not shown).
Fig. 10.
10a. Degradation profile (nmol/ml of drug v/s time) for VVL in Caco-2 homogenate
10b. Degradation profile (nmol/ml of drug v/s time) for GVL in Caco-2 homogenate
5. Conclusion
Two peptide prodrugs of LVR were synthesized and evaluated in vitro. Both VVL and GVL displayed better solubility, metabolism and intestinal permeability profiles as compared with the parent drug LVR. Since these prodrugs are substrates for peptide transporters, they can bypass efflux pumps and are capable of delivering more intact drug to improve oral bioavailability. Evasion of efflux may also lower the chance of resistance development on chronic LVR exposure. Thus efficient delivery of LVR can result in enhanced therapeutic efficacy which is of high clinical significance in HAART (highly active anti-retroviral therapy). Results presented in this research article suggest that prodrug approach by employing peptide derivatives of LVR may be proven to be an attractive strategy for optimizing several pharmaceutical and pharmacokinetic properties of LVR. Future studies include correlating these in vitro results with in vivo studies.
Acknowledgments
This work was mainly supported by funds from NIH Grant GM1 RO1 64320-03 and partially supported by UMKC Women’s Council.
Footnotes
Publisher's Disclaimer: This is a PDF file of an unedited manuscript that has been accepted for publication. As a service to our customers we are providing this early version of the manuscript. The manuscript will undergo copyediting, typesetting, and review of the resulting proof before it is published in its final citable form. Please note that during the production process errors may be discovered which could affect the content, and all legal disclaimers that apply to the journal pertain.
References
- Agarwal S, Pal D, Mitra AK. Both P-gp and MRP2 mediate transport of Lopinavir, a protease inhibitor. Int J Pharm. 2007a;339:139–147. doi: 10.1016/j.ijpharm.2007.02.036. [DOI] [PMC free article] [PubMed] [Google Scholar]
- Agarwal S, Jain R, Pal D, Mitra AK. Functional characterization of peptide transporters in MDCKII-MDR1 cell line as a model for oral absorption studies. Int J Pharm. 2007b;332:147–152. doi: 10.1016/j.ijpharm.2006.09.056. [DOI] [PMC free article] [PubMed] [Google Scholar]
- Anand BS, Patel J, Mitra AK. Interactions of the dipeptide ester prodrugs of acyclovir with the intestinal oligopeptide transporter: competitive inhibition of glycylsarcosine transport in human intestinal cell line-Caco-2. J Pharmacol Exp Ther. 2003;304:781–791. doi: 10.1124/jpet.102.044313. [DOI] [PubMed] [Google Scholar]
- Anand BS, Katragadda S, Mitra AK. Pharmacokinetics of novel dipeptide ester prodrugs of acyclovir after oral administration: intestinal absorption and liver metabolism. J Pharmacol Exp Ther. 2004;311:659–667. doi: 10.1124/jpet.104.069997. [DOI] [PubMed] [Google Scholar]
- Bradford MM. A rapid and sensitive method for the quantitation of microgram quantities of protein utilizing the principle of protein-dye binding. Anal Biochem. 1976;72:248–254. doi: 10.1006/abio.1976.9999. [DOI] [PubMed] [Google Scholar]
- Dias C, Nashed Y, Atluri H, Mitra A. Ocular penetration of acyclovir and its peptide prodrugs valacyclovir and val-valacyclovir following systemic administration in rabbits: An evaluation using ocular microdialysis and LC-MS. Curr Eye Res. 2002;25:243–252. doi: 10.1076/ceyr.25.4.243.13488. [DOI] [PubMed] [Google Scholar]
- Gunda S, Hariharan S, Mitra AK. Corneal absorption and anterior chamber pharmacokinetics of dipeptide monoester prodrugs of ganciclovir (GCV): in vivo comparative evaluation of these prodrugs with Val-GCV and GCV in rabbits. J Ocul Pharmacol Ther. 2006;22:465–476. doi: 10.1089/jop.2006.22.465. [DOI] [PubMed] [Google Scholar]
- Guo A, Hu P, Balimane PV, Leibach FH, Sinko PJ. Interactions of a nonpeptidic drug, valacyclovir, with the human intestinal peptide transporter (hPEPT1) expressed in a mammalian cell line. J Pharmacol Exp Ther. 1999;289:448–454. [PubMed] [Google Scholar]
- Jain R, Majumdar S, Nashed Y, Pal D, Mitra AK. Circumventing P-glycoprotein-mediated cellular efflux of quinidine by prodrug derivatization. Mol Pharm. 2004;1:290–299. doi: 10.1021/mp049952s. [DOI] [PubMed] [Google Scholar]
- Katragadda S, Talluri RS, Mitra AK. Modulation of P-glycoprotein-mediated efflux by prodrug derivatization: an approach involving peptide transporter-mediated influx across rabbit cornea. J Ocul Pharmacol Ther. 2006;22:110–120. doi: 10.1089/jop.2006.22.110. [DOI] [PubMed] [Google Scholar]
- Kumar GN, Jayanti VK, Johnson MK, Uchic J, Thomas S, Lee RD, Grabowski BA, Sham HL, Kempf DJ, Denissen JF, Marsh KC, Sun E, Roberts SA. Metabolism and disposition of the HIV-1 protease inhibitor lopinavir (ABT-378) given in combination with ritonavir in rats, dogs, and humans. Pharm Res. 2004;21:1622–1630. doi: 10.1023/b:pham.0000041457.64638.8d. [DOI] [PubMed] [Google Scholar]
- Majumdar S, Kansara V, Mitra AK. Vitreal pharmacokinetics of dipeptide monoester prodrugs of ganciclovir. J Ocul Pharmacol Ther. 2006;22:231–241. doi: 10.1089/jop.2006.22.231. [DOI] [PubMed] [Google Scholar]
- Majumdar S, Nashed YE, Patel K, Jain R, Itahashi M, Neumann DM, Hill JM, Mitra AK. Dipeptide monoester ganciclovir prodrugs for treating HSV-1-induced corneal epithelial and stromal keratitis: in vitro and in vivo evaluations. J Ocul Pharmacol Ther. 2005;21:463–474. doi: 10.1089/jop.2005.21.463. [DOI] [PubMed] [Google Scholar]
- Patel K, Trivedi S, Luo S, Zhu X, Pal D, Kern ER, Mitra AK. Synthesis, physicochemical properties and antiviral activities of ester prodrugs of ganciclovir. Int J Pharm. 2005;305:75–89. doi: 10.1016/j.ijpharm.2005.08.024. [DOI] [PubMed] [Google Scholar]
- Thwaites DT, Brown CD, Hirst BH, Simmons NL. Transepithelial glycylsarcosine transport in intestinal Caco-2 cells mediated by expression of H(+)-coupled carriers at both apical and basal membranes. J Biol Chem. 1993;268:7640–7642. [PubMed] [Google Scholar]


