Abstract
The yeast α-factor pheromone receptor (Ste2) belongs to the family of G protein-coupled receptors (GPCRs) that contain seven transmembrane domains. To define the residues that are accessible to the cytoplasmic G protein, Cys scanning mutagenesis was carried out in which each of the residues that span the intracellular loops and the cytoplasmic end of transmembrane domain 7 were substituted with Cys. The 90 different Cys-substituted residues were then assayed for reactivity with MTSEA-biotin (2-([biotinoyl] amino) ethyl methanethiosulfonate), which reacts with solvent accessible sulfhydryl groups. As part of these studies we show that adding free Cys to stop the MTSEA-biotin reactions has potential pitfalls in that Cys can rapidly undergo disulfide exchange with the biotinylated receptor proteins at pH ≥7. The central regions of the intracellular loops of Ste2 were all highly accessible to MTSEA-biotin. Residues near the ends of the loops typically exhibited a drop in the level of reactivity over a consecutive series of residues that was inferred to be the membrane boundary. Interestingly, these boundary residues were enriched in hydrophobic residues, suggesting that they may form a hydrophobic pocket for interaction with the G protein. Comparison with accessibility data from a previous study of the extracellular side of Ste2 indicates that the transmembrane domains vary in length, consistent with some transmembrane domains being tilted relative to the plane of the membrane as they are in rhodopsin. Altogether, these results define the residues that are accessible to the G protein and provide an important structural framework for the interpretation of the role of Ste2 residues that function in G protein activation.
The S. cerevisiae α-factor pheromone receptor (Ste2) belongs to the large family of Gprotein-coupled receptors (GPCRs) that transduce the signals for light, taste, olfaction, and many biomedically important hormones. Although GPCRs are quite diverse in sequence, they function in a similar manner to activate the α subunit of heterotrimeric G proteins to bind GTP and they also show similar structural architecture in that they are composed of a bundle of seven transmembrane domains (TMDs) connected by extracellular loops and intracellular loops (1, 2). Ste2 shows overall similarity to many mammalian GPCRs in that the core region containing the TMDs is involved in signal transduction and the C terminal tail is a target for post-translational modifications that regulate receptor desensitization and endocytosis (3). Ste2 activates a heterotrimeric G protein in which the α subunit shows about 45% identity with mammalian Gα proteins and is most closely related to the Gi subfamily (4). In addition, comparison of Ste2 with rhodopsin, a member of the large class A subfamily of mammalian GPCRs, indicates that there are similar microdomains in these divergent receptors (5). These results suggest that there are underlying similarities in the mechanisms of signal transduction by the diverse GPCR family.
A major area of interest is to determine how the intracellular regions of GPCRs interact with G proteins to promote GTP exchange on Gα. As part of this interaction, the intracellular loops and ends of the TMDs are thought to form a pocket that interacts with the C terminus of Gα to promote GTP exchange (1, 6). Mutagenesis studies indicate that Ste2 is similar to other GPCRs in that the third intracellular loop plays an important role in G protein activation (7-10). However, Alanine scanning and random mutagenesis of the third loop region found that relatively conservative mutations did not result in strong defects, making it difficult to implicate specific residues as being functionally important (9, 10). The Ste2 3rd loop mutations that most strongly affect signaling typically involve substitutions that result in a gain or loss of polar side chains (7-9). Similar complexity has been observed for mammalian GPCRs. Mutagenesis studies have implicated certain regions, such as the N and C termini of the third loop that border TMDs 5 and 6, but the function of these residues is often not conserved even in closely related GPCRs (1, 11).
To better define the Ste2 residues capable of interacting with G protein, in this study we examined the solvent accessibility of residues on the intracellular side of the receptor. Cys substitution mutations were introduced into the residues that span across the intracellular loops and the cytoplasmic end of TMD7 so that their solvent accessibility could be probed with MTSEA-biotin, a thiol reactive probe that does not react with membrane-buried residues (12). A similar approach used to define that topology of the extracellular regions of Ste2 demonstrated that the extracellular ends of the TMDs play a key role in ligand binding and in promoting the active receptor conformation (13, 14), and also provided a structural framework for comparing Ste2 to mammalian GPCRs (5). Therefore, the accessibility of residues in the cytoplasmic regions of Ste2 was assayed to provide a structural framework for understanding the role of residues that function in G protein activation.
EXPERIMENTAL PROCEDURES
Strains and media
Yeast strains used for the analysis of STE2 mutants were yLG123 (MATa ade2-1o his4-580a lys2o trp1a tyr1o leu2 ura3 SUP4-3ts bar1-1 mfa2::FUS1-lacZ ste2::LEU2), and JKY131(MATa bar1::hisG far1 ste2Δ mfβ1::LEU2 mfβ2::his5+ ade2 his3 leu2 ura3 mfa2::FUS-lacZ). Yeast cells were transformed using the lithium acetate method (15). Cells carrying plasmids were grown in synthetic medium containing adenine and amino acid additives, but lacking uracil to select for plasmid maintenance (16).
Cysteine scanning mutagenesis
A set of Cys substitution mutants was constructed in plasmid pPD225 (Yep-URA3-STE2-3XHA) (17). This plasmid carries a modified STE2 in which the two endogenous Cys residues at positions 59 and 252 were substituted by other amino acids and the C terminus is fused to a triple HA epitope tag (17). This version of the receptor lacking Cys residues exhibited normal signaling activity and will be used as the pseudowild-type control for this study. Cys59 was substituted with Ile, which is the consensus residue at this position in the Ste2 family (5). Cys252 was substituted with Ser. Site-directed mutagenesis was carried out using PCR methods. Mutagenic oligonucleotides were designed to be complementary to the STE2 sequence except for the substitutions required to change the indicated codons to encode for Cys. DNA sequence analysis using the Big Dye cycle sequencing reagents (Applied Biosystems Inc.) was carried out to confirm all mutations.
MTSEA-biotin reactions
To assay the reactivity of the Cys-substituted STE2 proteins with MTSEA-biotin (2-((biotinoyl) amino) ethyl methanethiosulfonate) (Biotium), 108 logarithmic-phase cells were harvested by centrifugation, lysed by agitation with glass beads in 250 μl of cold PBS (10 mM Na2HPO4, 1.5 mM KH2PO4, 3 mM KCl, 150 mM NaCl (pH7.4) containing protease inhibitors (1.5 μM Pepstatin A, 1 mM benzamidine, 0.5 mM phenylmethanesulfonyl fluoride), and then the lysate was cleared by centrifugation at 1,000 x g for 2 min. The membrane fraction was harvested by centrifugation at 15,000 x g for 30 min and then resuspended in 500 μl of PBS. Prior to the initiation of the accessibility assays, GTP-γ-S (guanosine-5′-0-3′-thiotriphosphate; Roche Applied Science) was added to a final concentration of 100 μM to the membrane fractions, and then incubated for 30 min to promote dissociation of the G protein from the STE2 (18).
MTSEA-biotin was freshly dissolved in dimethyl sulfoxide at a final concentration of 20 mM, and the membrane fraction was incubated with MTSEA-biotin at a final concentration of 30 μM at room temperature for 2 min. The reactions were stopped by adding Cysteine Hydrochloride from a freshly prepared stock solution to a final concentration of 10 mM, and then samples were incubated for 5 min. The addition of free Cys was initially intended to rapidly quench the reactions by providing excess thiol groups to react with the MTSEA-biotin. However, the primary reason for stopping the reactions is presumably that the addition of Cys in the form of unbuffered Cysteine Hydrochloride lowered the pH of the reactions to pH 4, which promotes protonation of the Cys thiol side chains (the pKa of the Cys side chain is about pH 8.3). Thus, at pH 4 very little of the Cys side chains are expected to be in the thiolate anion form that is capable of reacting with MTSEA-biotin. Although low pH greatly slows reactivity and serves to stop the reaction, special care must be taken using Cys for this approach because Cys can have the unintended consequence of undergoing rapid disulfide exchange with biotinylated STE2when the pH is above 7 (see Supporting Information). This results in the removal of the biotin group from STE2. Disulfide exchange with added Cys has also been observed at pH 7.4 in studies on the serotonin transporter (19). Control experiments showed that the low pH prevented disulfide exchange between the added Cys and biotinylated STE2 proteins (see Supporting Information). However, future studies could avoid potential problems when stopping reactions by adjusting pH without the addition of free Cys, or by instead adding an alkylating agent to block unreacted Cys residues.
The membrane pellets were then washed with PBS, extracted in RIPA buffer (0.1% SDS, 1% Triton 100, 0.5% Deoxycholic Acid, 1X PBS pH7.4, and 1mM EDTA), the extract was centrifuged at 15,000 × g for 15 min, and STE2 proteins in the supernatant were harvested using Anti-HA Affinity Matrix (Roche Applied Science), which consists of rat anti-HA monoclonal antibody 3F10 linked to agarose beads. The beads were washed four times by resuspension in RIPA buffer, allowing the beads settle by gravity for 20 min, and then removing the supernatant. Bound proteins were eluted using gel sample buffer lacking reducing agent (8M urea, 50mM Tris pH 6.8, 2% SDS). The degree of biotinylation was then determined by quantitative Western blot analysis using anti-HA antibody to detect total STE2, and Streptavidin to detect biotinylated STE2 as described below. This procedure is a modification of the method used previously to analyze the reactivity with MTSEA-biotin of residues in the extracellular regions of STE2 (14). Previously, Streptavidin beads were used to precipitate the biotinylated STE2 proteins, whereas the new approach uses anti-HA beads. The new modifications permit the direct comparison of total STE2 protein versus biotinylated STE2 protein, which was not possible with the previous method since biotinylated STE2 bound so tightly to the Streptavidin beads that reducing agent was required to quantitatively release STE2 from the Streptavidin beads. As a control for the ability of MTSEA-biotin to react with the different membrane fractions, total membrane protein biotinylation was examined by analyzing samples on Western blots probed with Streptavidin.
Western blot analysis of STE2
Quantitative Western blot analysis was carried out essentially as described previously (13, 14). Samples separated by electrophoresis on 10% SDSpolyacrylamide gels were electrophoretically transferred to Hybond-P membrane (Amersham Pharmacia Biotech). The HA-tagged STE2 proteins were detected on blots probed with anti-HA antibody 12CA5 (Roche Applied Science), followed by incubation with alkaline phosphataseconjugated goat anti-mouse IgG (Zymed) secondary antibody and then the immunoreactive bands were visualized using an AttoPhos AP Fluorescent Substrate System (Promega). Biotinylated proteins were detected on the blots by probing them with alkaline phosphataseconjugated Streptavidin (Pierce), and the resulting bands were detected using an AttoPhos AP Fluorescent Substrate System (Promega). Quantitative analysis of the signals was performed using ImageQuant computer software. As the negative and positive controls, the pseudo wildtype STE2 lacking Cys residues and the STE2-A299C cells were analyzed in parallel with each set of mutants. The accessibility of the different mutant receptors was then calculated as the degree of biotinylation relative to STE2-A299C.
α-Factor-induced responses
Halo assays for α-factor-induced cell division arrest were performed by spreading 6 × 10⁵ yLG123 (STE2Δ) cells carrying the pseudo wild-type STE2 lacking Cys codons or the indicated mutant version of STE2 plasmid pPD225 on solid medium agar plates lacking uracil, placing sterile filter disks containing the indicated amount of α-factor (Bachem) on the lawn of cells, and then incubating at 30°C for 48 h. The diameters of the zones of cell division arrest (halos) surrounding the disks containing α-factor were measured. FUS1-lacZ induction assays were carried out by growing yLG123 (STE2Δ) cells carrying the indicated receptor plasmid to log phase in selective medium, adjusting the culture to 2 × 10⁶ cells/ml, and incubating the culture in the presence of the indicated concentration of α-factor for 2 h. The cells were permeabilized with 0.05% SDS and CHCl3, and then β-galactosidase assays were carried out using O-Nitrophenyl-β-D-galactopyranoside (ONPG; Sigma) as a substrate (20).
Fluorescence Microscopy
To visualize the subcellular localization of the STE2 protein, the coding sequences for the Green Fluorescent Protein (GFP) were fused to the C terminal coding sequences of the pseudo wild-type, P290C, and W295C mutant versions of STE2 by transferring a Sal I – Pvu I fragment from STE2-GFP plasmid pMD209 to the mutant plasmids. Cells carrying the STE2-GFP fusion plasmids were then grown for 2 days to log phase, washed with water, and then viewed immediately afterwards on an Olympus BH-2 microscope. Images were captured with a Zeiss AxioCam run by Openlab software from Improvision.
RESULTS
Cys scanning mutagenesis across the cytoplasmic regions of Ste2
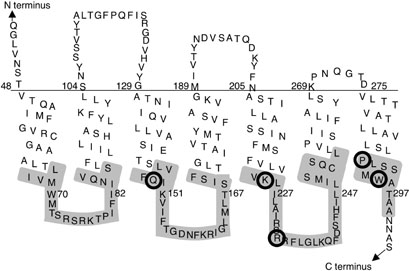
The functions of residues in the cytoplasmic regions of STE2 were analyzd by scanning mutagenesis to create a set of 90 Cys substitution mutants (Fig. 1). This set includes 74 new mutants and 16 other Cys substitution mutants near the ends of TMDs 3, 5 and 6 that were constructed in previous studies (17, 21). The corresponding residues were substituted with Cys, instead of the more commonly used Ala, in order to take advantage of the unique chemical properties of the thiol group in the Cys side chain for subsequent analysis of solvent accessibility. The Cys substitutions were therefore created in a modified α-factor receptor gene (STE2) in which the endogenous Cys residues at positions 59 and 252 were substituted with other amino acids to create a control pseudo wild-type STE2 that lacks Cys residues and contains an HA epitope tag at the C terminus (17). Cys59 was substituted with Ile, which is the consensus residue at this position in the STE2 family (5). Cys252 was substituted with Ser. This version of the receptor lacking Cys residues exhibited normal signaling activity (17), and will therefore be used as the wild-type STE2 control for this study. Plasmids carrying the Cys mutants were introduced into a yeast strain lacking the chromosomal copy of the STE2 gene (Ste2Δ strain yLG123) for analysis. Western immunoblot analysis showed that all of Cys substitution mutant proteins were produced at a level similar to the wild-type, with the exception of the Q149C and I153C mutants which were produced at slightly lower levels (see Supporting Information).
Figure 1. Residues targeted for Cys scanning mutagenesis in Ste2.
90 different mutants were constructed in which one of the shaded residues was substituted with Cys. This Ste2 topology represents the working model at the start of these studies. Circled residues indicate the positions of Cys substitutions that caused defects in halo assays for cell division arrest.
Phenotypes of Cys substitution mutants
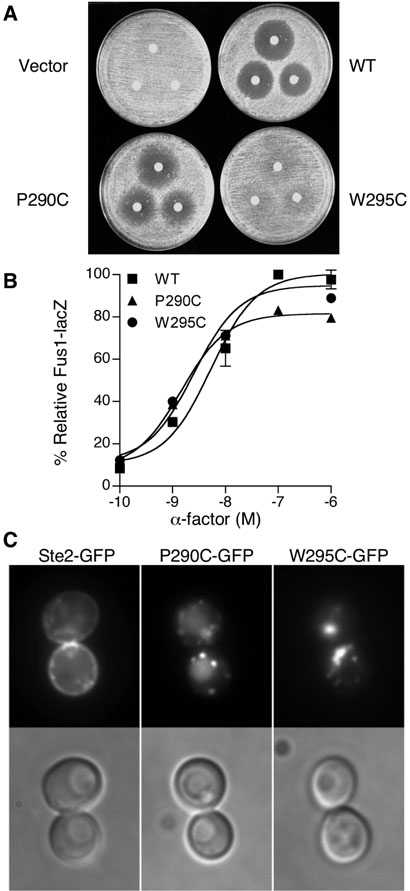
The signaling activity of the Cys substitution mutants was examined in halo assays for α-factor-induced cell division arrest. Halo assays are a sensitive test of STE2 function that measure the ability of cells to maintain pheromone-induced cell division arrest for two days. Five of the mutants displayed strong defects in this assay (Fig. 1; Q149C, K225C, R233C, P290C, and W295C). Cys substitution at positions 83, 90, 291, 292, 294, 297, and 298 showed slightly decreased sensitivity in halos assays (≤ 2-fold). Mutations at positions 67, 88, 145, 153, 156, 158, 159, and 289 were slightly more sensitive than wild type (≤ 2-fold). The phenotypes of these mutants that either increased or decreased the sensitivity by ≤ 2-fold were not studied further. The remaining Cys mutants were similar to the wild type.
The decreased sensitivity in halo assays caused by mutations affecting Lys225, Arg233, and Gln149 was consistent with previous studies. Mutations affecting Lys225 (17) and Arg233 (9, 10) were shown previously to cause partial defects in signaling. A Gln149 substitution with Cys was competent for pheromone signaling and displayed an elevated basal level of signaling (21). However, the Q149C mutant cells exhibited low cell-surface receptor number that presumably accounts for the defect in long term halo assays. The halo assay defects for the P290C and W295C mutants that have not been studied previously are shown in Fig. 2A. In contrast to wildtype cells that form a zone of cell division arrest (halo) surrounding a disk containing α-factor placed on a lawn of cells, the P290C mutant formed a partially filled-in halo and the W295C mutant was even more strongly defective in cell division arrest.
Figure 2.
Analysis of the effects of the P290C and W295C substitutions on Ste2 function and plasma membrane localization. (A) Halo assays for cell division arrest. Filter disks containing a-factor (375, 750, or 1500 ng) were applied onto agar plates spread with a lawn of yeast carrying the empty vector or indicated STE2 plasmid. Cell division arrest results in formation of zone of growth inhibition (halo) surrounding the filter disk. (B) Dose response assays for the pheromone-responsive Fus1-lacZ reporter gene. Cells carrying the indicated wild-type or mutant versions of STE2 on a plasmid were assayed for induction of the FUS1-lacZ reporter gene in response to a-factor. The β-galactosidase values were normalized to the maximal value of wildtype cells. The results represent the average of three independent experiments, each done in triplicate. (C) Fluorescence microscope images of the cellular localization of wild type, P290C and W295C versions of Ste2-GFP. Experiments were carried out with ste2Δ strain yLG123.
Previous studies indicate that a halo assay defect in cell division arrest could be caused either by a decrease in receptor signaling activity or by a decrease in the number of receptors on ell surface (21-23). To further investigate these possibilities, the P290C and W295C mutants were assayed for the ability to induce the pheromone-responsive FUS1-lacZ reporter gene, a relatively short term (2h) assay that is not affected as strongly by lower levels of cell-surface receptors as are the long term halo assays (2 days). Both the P290C and W295C mutants induced FUS1-lacZ to essentially the same level as the wild type (Fig. 2B). This suggests that these mutants receptors are primarily defective in plasma membrane localization or stability, since this phenotype of being able to induce signaling in the short-term FUS1-lacZ assays but unable to maintain cell division arrest for 2 days in halo assays has been observed previously for mutants with a low number of cell surface receptors (21-23). This is thought to occur because the trafficking defect of the mutant receptors is compounded by a decrease in receptor production that occurs in cells that have been division arrested, and consequently the arrested cells cannot efficiently replace the receptors that are rapidly internalized by ligand-induced endocytosis (24). Consistent with this, GFP-tagged version of P290C and W295C receptors showed greatly reduced plasma membrane localization and increased cytoplasmic fluorescence compared to the wild-type STE2-GFP (Fig. 2C). A control Western blot probed with anti-GFP antibody verified that the fluorescence was due to GFP linked to STE2, as there was essentially no free GFP detected (data not shown). This indicates that the P290C and W295C mutants are primarily defective in plasma membrane localization, and not in receptor signaling.
Assay for accessibility of substituted Cys residues to MTSEA-biotin
The solvent accessibility of the Cys residues substituted into the mutant receptors was assayed by testing their reactivity with MTSEA-biotin. MTSEA is a thiol-specific agent that reacts rapidly with the thiol group of the Cys side chain in aqueous environments, but not when membrane-imbedded (12). MTSEA-biotin was used so that reactive Cys residues would become biotinylated to facilitate quantitative analysis of the reaction. This approach also has the advantage in that STE2 Cys mutants can be assayed in yeast membrane preparations without the need to purify and reconstitute the receptors into artificial membranes that may alter receptor structure.
The accessibility assays were initiated by treating membrane fractions with MTSEAbiotin. The membranes were solubilized in detergent buffer, and then the STE2 proteins were collected using anti-HA antibody immobilized on agarose beads that recognized the 3xHA epitope tag added to the C terminus of STE2. For each assay, one portion of the sample was analyzed on a Western blot probed with Streptavidin to detect the degree of biotinylation, and a second portion of the sample was run on a Western blot probed with anti-HA monoclonal antibody 12CA5 to detect total STE2 protein. Quantitative analysis of the blots was used to determine the ratio of the biotinylated to total STE2 protein (See Experimental Procedures).
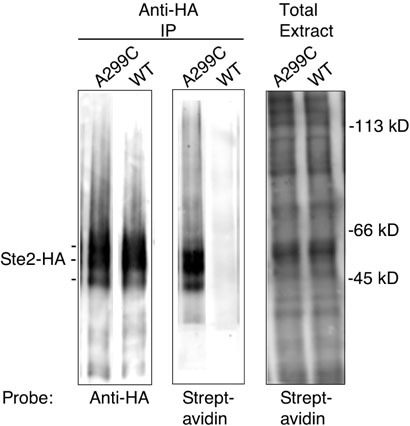
Each set of assays included the pseudo wild-type version of STE2 lacking Cys residues as a negative control and the STE2-A299C mutant as a positive control since it contains a Cys residue at a position that was predicted from previous studies to be at an accessible location in the cytoplasmic C terminus (25). As expected, the pseudo wild-type receptors lacking Cys residues did not react significantly with MTSEA-biotin, whereas A299C mutant showed significant reactivity with MTSEA-biotin (Fig. 3). To confirm that all membrane fractions reacted efficiently with MTSEA-biotin, an additional control was carried out in which samples of the total membrane extract were analyzed on a Western blot probed with Streptavidin to detect the biotinylation of other membrane proteins (Fig. 3). The reactivity of the different STE2 Cys mutants was then calculated based on the degree of biotinylation relative to the STE2-A299C mutant, which was set to 100%. The A299C mutant showed similar reactivity to STE2-T199C, which contains a Cys residue substituted at Thr199 in extracellular loop 2 that was used previously as the positive control for assaying the accessibility of Cys residues substituted into the extracellular regions of STE2 (data not shown and (14)).
Figure 3. Assay for reactivity of Ste2 with MTSEA-biotin.
Membrane fractions from cells producing the wild-type Ste2 lacking Cys residues or the A299C mutant were treated with MTSEA-biotin and solubilized in detergent buffer. Ste2 proteins were immunoprecipitated with anti-HA immobilized on beads, and the bound material was analyzed on Western blot probed with anti-HA (left panel) or with Streptavidin (center panel). As a control, a fraction of the total membrane extract used in the immunoprecipitations was analyzed on a Western blot probed with Streptavidin to show that the extracts were biotinylated to a similar extent (right panel). The Ste2-HA protein migrates as several bands due to heterogeneous glycosylation and phosphorylation (39) as indicated by the markings to the left. The positions of MW markers are indicated to the right.
Accessibility of STE2 intracellular residues
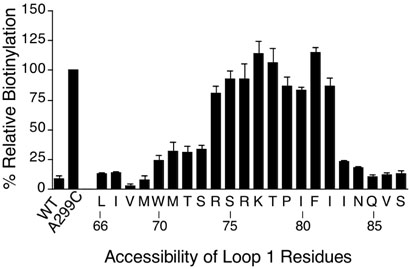
The accessibility of intracellular loop 1 was determined by analyzing STE2 proteins with Cys substituted at residues ranging from Leu66 in TMD1 to Ser87 in TMD2 (Fig. 4). Cys residues at positions 74 to 82 were highly reactive with MTSEA-biotin, indicating that these residues comprise intracellular loop 1. At the boundary of TMD1, residues 70-73 showed greatly reduced reactivity, and then positions 66-69 did not react detectably indicating they are inaccessible. Interestingly, there was a very sharp dropoff in reactivity at the border of TMD2 between Ile82 and Ile83, which suggests that this region may be in a special configuration (see Discussion).
Figure 4.
MTSEA-biotin reactivity of Cys residues substituted across intracellular loop 1. Assays were carried out by treating with MTSEA-biotin, solubilizing in detergent buffer, and then immunoprecipating HA-tagged Ste2 with anti-HA immobilized beads. Degree of receptor reactivity with MTSEA-biotin was quantified on Western blots probed with anti-HA to detect Ste2, and with Streptavidin to detect biotinylated Ste2. In each set of assays, control samples showed that the wild-type Ste2 lacking Cys residues did not react significantly, and that the Ste2-A299C mutant reacted well with MTSEA-biotin. The results for the mutants were normalized to the reactivity of Ste2-A299C, and represent the average of two to five independent assays.
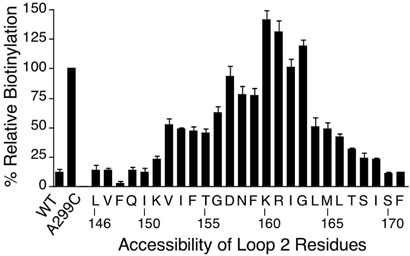
Intracellular loop 2 was defined by assaying Cys residues substituted from Leu146 in TMD3 to Phe171 in TMD4 (Fig. 5). Cys residues at positions 157-163 showed high reactivity with MTSEA-biotin, indicating these residues are clearly situated in the second cytoplasmic loop. At the boundary near TMD3, five consecutive residues showed reduced reactivity with MTSEA-biotin (positions 152 to 156), and then the next 6 residues were essentially not reactive (positions 151 to 146). At the boundary of TMD4, reactivity with MTSEA-biotin dropped for four residues (positions 164 to 167) and then trailed off for the next four residues (positions 168 to 171).
Figure 5.
MTSEA-biotin reactivity of Cys residues substituted across intracellular loop 2. The methods are described in the legend to Figure 4 and the Experimental Procedures.
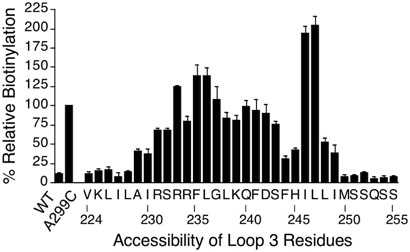
The 3rd intracellular loop was identified by analysis of Cys residues substituted from Val224 in TMD5 to Leu255 in TMD6 (Figure 6). The results indicate that the highly accessible region of intracellular loop 3 is from Arg233 to Leu247. The boundary region near TMD5 was observed as a drop in reactivity from positions 229-232, and the drop in reactivity near TMD6 occurred between residues 248-249. However, the pattern of accessibility near the boundary with TMD6 is unusual in that two positions showed low accessibility (F244C and H245C were <50% accessible relative to A299C). Interestingly, the following two residues (I246C and L247C) showed a higher degree of reactivity than the STE2-A299C positive control. This higher degree of reactivity is possible because the reaction conditions were set so that only about 30% of the A299C mutant protein was biotinylated. The absolute level of biotinylation of A299C was determined in this case by a different type of assay that measured the fraction of total STE2 protein that could be precipitated with Streptavidin beads. These MTSEA-biotin reaction conditions were used because they were found to give the best signal to noise ratio in preliminary optimization studies in that the wild-type STE2 lacking Cys residues shows very low non-specific reactivity under these conditions. The unexpectedly low reactivity at positions 244-245, and higher reactivity at positions 246-247 were reproducible in 3-4 independent experiments, suggesting these results may be indicative of a special structural feature of the third loop. For example, the corresponding region of rhodopsin is part of an α-helix that extends from TMD6 into the cytoplasm (26, 27). Lower reactivity could result from the packing of nearby residues in the loops that shield the Cys residues from the solvent. In support of this, we analyzed the proportion of each residue in the crystal structure of rhodopsin that is solvent accessible and found that some of the intracellular loop residues were less than 10% solvent accessible (e.g. Ala65, Leu68, Val139, and Ala234). Higher than expected reactivity may potentially result from a local environment that preferentially interacts with MTSEA-biotin or results in the ionization of the Cys side chains.
Figure 6.
MTSEA-biotin reactivity of Cys residues substituted across intracellular loop 3. The methods are described in the legend to Figure 4 and the Experimental Procedures.
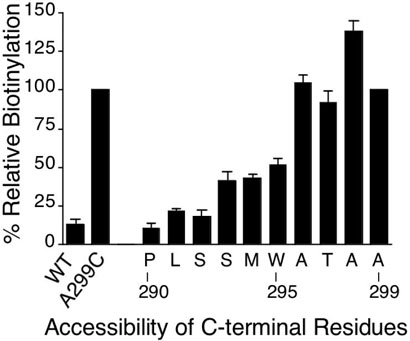
The cytoplasmic boundary of TMD7 was defined by analyzing Cys residues substituted from Pro290 to Ala299 (Fig. 7). Positions 290-292 showed very low reactivity, positions 293-295 showed intermediate reactivity and positions 296-299 were highly accessible. These results place the boundary between Trp295 and Ala296, consistent with previous finding that a version of STE2 truncated after residue 295 was functional (25).
Figure 7.
MTSEA-biotin reactivity of Cys residues substituted across the intracellular end of TMD7. The methods are described in the legend to Figure 4 and the Experimental Procedures.
DISCUSSION
The specific residues in STE2 and other GPCRs that are involved in G protein interaction have been difficult to identify by genetic approaches. For example, although the third intracellular loop of STE2 is implicated in G protein activation, Alanine-scanning and random mutagenesis studies revealed few mutations that strongly affected signaling (9, 10). Most strongly defective mutants involve multiple mutations or very non-conservative substitutions that alter the number of charged residues, which could indirectly affect the interaction with G protein. Furthermore, Cys scanning mutagenesis across the three intracellular loops and the cytoplasmic end of TMD7 revealed only five substitutions that caused strong signaling defects, and most of these are primarily defective in localizing to the plasma membrane and not in signaling (Figs. 1 and 2). Therefore, to better define the membrane topology of STE2, and to identify the residues that are capable of interacting with the cytoplasmic G protein, the accessibility of the Cyssubstituted residues in STE2 to the solvent was assayed by testing their ability to react with MTSEA-biotin.
Ste2 topology
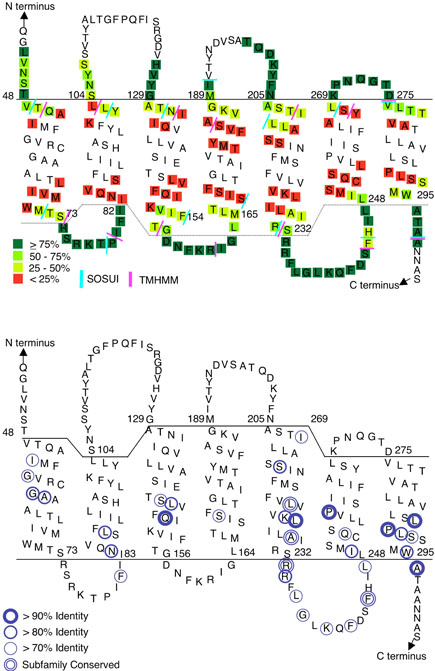
The reactivity of Cys-substituted residues is summarized on a topology map of STE2 to examine the implications for STE2 structure (Fig. 8A). The overall trend is that the highly reactive Cys residues that form the intracellular loops are typically flanked by short regions of intermediate accessibility followed by inaccessible residues. The drop in reactivity is thought to correspond to the membrane interface region of the TMDs. Although a number of different factors can influence the reactivity of any one particular residue in STE2, a drop in reactivity over 3-5 residues is consistent with expectations for an α-helical TMD that is crossing the membrane boundary zone (14). Similar results were observed for the solvent accessibility of Cys-substituted residues in rhodopsin (28-31), and the results were subsequently found to correlate well with the TMD arrangement observed in the rhodopsin crystal structure (27). The TMD boundaries determined by these experimental results for STE2 were compared to the predictions of TMHMM and SOSUI (Fig. 8A), which were found to be the two best algorithms for predicting TMDs in a large group of GPCR sequences (32). Interestingly, there were significant differences between the predictions of the algorithms and the Cys accessibility results for TMDs 2, 4, 6 and 7 in Ste2. TMHMM generally matched the experimental data better, and was often within 3 residues of the transition in reactivity to MTSEA-biotin. The differences between the predictions of the two different algorithms were especially significant for TMD 4, in which they differed by 6 residues. This indicates the importance of direct experimental evidence for defining the residues that are accessible to the G protein.
Figure 8. Summary of accessible residues and comparison with positions of conserved residues in Ste2.
(A) Reactivity of Cys-substituted residues in the intracellular regions of Ste2 is color-coded based on data from Figures 4-7. Accessibility data for the extracellular regions is summarized from previous studies (13, 14). The TMD boundaries were placed at the start of the drop in reactivity to MTSEA-biotin, as described in the text. The colored bars represent the ends of the TMDs predicted by the TMHMM and SOSUI computer algorithms (40) that were accessed at the ExPASy molecular biology server (http://ca.expasy.org/).
(B) Circles identify residues with the indicated percent identity across 28 different members of the Ste2 family of fungal pheromone receptors (5). Subfamily conserved residues show a high degree of identify within the budding yeast and filamentous fungi subfamilies, but are not identical between the two subfamilies.
Comparison with accessibility data for the extracellular side of Ste2 indicates that the membrane spanning regions vary in length, consistent with some TMDs being tilted relative to the plane of the membrane as they are in rhodopsin. This indicates that rhodopsin serves as a better model for Ste2 than does bacteriorhodopsin, which forms a relatively straight TMD bundle that is perpendicular to the membrane. It was also interesting that the accessibility boundary of intracellular TMD2 dropped off abruptly between positions 82 and 83 (Fig. 4). The cytoplasmic end of TMD2 in rhodopsin is the most buried by the other TMDs (26, 27), suggesting perhaps that a similar configuration might constrain the accessibility of this region of Ste2.
Intracellular loops
The highly accessible intracellular loops are very distinct from the TMDs in that ~42% of the amino acid residues are strongly polar. In particular, ~29% of the loop residues are basic, which could play a special role in G protein signaling. Alternatively, these basic residues may contribute to proper membrane topology by the “basic in – acidic out” rule (33).
Ste2 intracellular loops 1 and 2 do not appear to play essential roles in G protein interaction since Cys scanning mutagenesis across these regions did not cause strong phenotypes. Also, previous studies found that multiple mutations in these loops did not cause strong defects (34), and a deletion mutation that removed the accessible region of loop 2 in STE2 (Δ156-162) caused only a relatively minor defect (35). However, loops 1 and 2 are thought to interact directly with the G protein because mutations in these loops caused much stronger phenotypes in a version of STE2 in which the cytoplasmic C terminus is truncated (34), which weakens interaction with the G protein and makes the receptors more dependent on the cytoplasmic loops (24).
The third intracellular loop is also tolerant of relatively conservative Cys and Ala substitutions, but has been implicated in signaling by non-conservative mutations (Fig. 1 and (9, 10)). Two of the most well characterized mutants in the 3rd loop of STE2 are caused by substitutions affecting Leu236 (L236H or L236R), which cause strong defects in G protein activation but do not affect other aspects of receptor function such as plasma membrane localization, ligand binding, or ligand-induced endocytosis (7, 8). Interestingly, Leu236 maps to the accessible region of the 3rd loop near the boundary of TMD5, and could therefore be directly involved in contacting the G protein.
TMD interface regions
The boundary regions at the cytoplasmic ends of the TMDs that displayed intermediate accessibility are also likely to interact with the G protein. In particular, it is thought that the C terminus of the Gα subunit may interact with a pocket formed by the intracellular loops and TMD ends (1, 36). The residues with intermediate accessibility that comprise this region in STE2 are generally hydrophobic, with the exception of Arg231, whose long side chain is likely to project into the cytoplasm. Interestingly, biophysical studies suggest that the C terminus of the Gα subunit of transducin is in a hydrophobic environment when it interacts with rhodopsin (6). Consistent with this, the C termini of the cognate Gα proteins for STE2 and rhodopsin end in hydrophobic amino acids (I-G-I-I and C-G-L-F, respectively). Thus, the residues in the TMD boundary regions are implicated in forming part of the pocket that interacts with Gα.
G protein activation
To further examine the relationship between Ste2 structure and function, we compared the accessibility of residues that are highly conserved in the Ste2 family of pheromone receptors. The conserved residues were identified by aligning 28 Ste2 sequences from a broad range of yeast and filamentous fungi (5). The majority of the conserved residues are in the intracellular half of Ste2 (Fig. 8B), consistent with these receptors binding different pheromone ligands but all carrying out the similar task of G protein activation. The conserved residues in the TMDs are likely to play a role in interhelix interactions, and may possibly be involved in transducing the signal from ligand binding. Consistent with this, mutation of some of the very highly conserved residues causes constitutive activity (i.e. mutation of Gln149, Leu226, Pro258, and Leu289) (17, 21, 37, 38). Residues in the boundary regions with intermediate accessibility were not highly identical across the Ste2 family, although in most cases these positions were conserved as hydrophobic amino acids. The 3rd intracellular loop shows a much higher degree of amino acid conservation than do loops 1 and 2, consistent with the 3rd loop being more important for G protein activation. The conserved residues were scattered throughout the 3rd loop and were not clustered in any specific region. This suggests either that the 3rd loop makes multiple contacts with the G protein, or that the overall structure of the 3rd loop is important for proper receptor function.
Supplementary Material
ACKNOWLEDGMENTS
We thank Peter Dube, Bill Parrish, Jennifer Lin, Ken Duell, and Misty Saracino for advice and for help in constructing the Cys substitution mutants.
Abbreviations
- TMD
transmembrane domain
- GPCR
G protein-coupled receptor
- MTSEA-biotin
(2-([biotinoyl] amino) ethyl methanethiosulfonate)
- GTP-γ-S
guanosine-5′-0-3′-thiotriphosphate
- PBS
phosphate buffered saline
Footnotes
SUPPORTING INFORMATION AVAILABLE
Data showing the effects of pH on disulfide exchange with free cysteine, and Western blot analysis of some of the mutant Ste2 proteins are available free of charge via the Internet at http://pubs.acs.org.
This work was supported by National Institutes of Health Grant GM55107 awarded to J.B.K.
REFERENCES
- 1.Kristiansen K. Molecular mechanisms of ligand binding, signaling, and regulation within the superfamily of G-protein-coupled receptors: molecular modeling and mutagenesis approaches to receptor structure and function. Pharmacol. Ther. 2004;103:21–80. doi: 10.1016/j.pharmthera.2004.05.002. [DOI] [PubMed] [Google Scholar]
- 2.Gether U. Uncovering molecular mechanisms involved in activation of G proteincoupled receptors. Endocrin. Rev. 2000;21:90–113. doi: 10.1210/edrv.21.1.0390. [DOI] [PubMed] [Google Scholar]
- 3.Dohlman HG, Thorner JW. Regulation of G protein-initiated signal transduction in yeast: paradigms and principles. Annu. Rev. Biochem. 2001;70:703–754. doi: 10.1146/annurev.biochem.70.1.703. [DOI] [PubMed] [Google Scholar]
- 4.Dohlman HG. G proteins and pheromone signaling. Annu. Rev. Physiol. 2002;64:129–152. doi: 10.1146/annurev.physiol.64.081701.133448. [DOI] [PubMed] [Google Scholar]
- 5.Eilers M, Hornak V, Smith SO, Konopka JB. Comparison of Class A and D G Protein-Coupled Receptors: Common Features in Structure and Activation. Biochemistry. 2005;44:8959–8975. doi: 10.1021/bi047316u. [DOI] [PMC free article] [PubMed] [Google Scholar]
- 6.Janz JM, Farrens DL. Rhodopsin activation exposes a key hydrophobic binding site for the transducin alpha-subunit C terminus. J. Biol. Chem. 2004;279:29767–29773. doi: 10.1074/jbc.M402567200. [DOI] [PubMed] [Google Scholar]
- 7.Stefan CJ, Blumer KJ. The third cytoplasmic loop of a yeast G-proteincoupled receptor controls pathway activation, ligand discrimination, and receptor internalization. Mol. Cell. Biol. 1994;14:3339–3349. doi: 10.1128/mcb.14.5.3339. [DOI] [PMC free article] [PubMed] [Google Scholar]
- 8.Schandel KA, Jenness DD. Direct evidence for ligand-induced internalization of the yeast α-factor pheromone receptor. Mol. Cell. Biol. 1994;14:7245–7255. doi: 10.1128/mcb.14.11.7245. [DOI] [PMC free article] [PubMed] [Google Scholar]
- 9.Celic A, Martin NP, Son CD, Becker JM, Naider F, Dumont ME. Sequences in the intracellular loops of the yeast pheromone receptor Ste2p required for G protein activation. Biochemistry. 2003;42:3004–3017. doi: 10.1021/bi0269308. [DOI] [PubMed] [Google Scholar]
- 10.Clark CD, Palzkill T, Botstein D. Systematic mutagenesis of the yeast mating pheromone receptor third intracellular loop. J. Biol. Chem. 1994;269:8831–8841. [PubMed] [Google Scholar]
- 11.Slessareva JE, Ma H, Depree KM, Flood LA, Bae H, Cabrera-Vera TM, Hamm HE, Graber SG. Closely related G-protein-coupled receptors use multiple and distinct domains on G-protein alpha-subunits for selective coupling. J Biol Chem. 2003;278:50530–6. doi: 10.1074/jbc.M304417200. [DOI] [PubMed] [Google Scholar]
- 12.Karlin A, Akabas MH. Substituted-cysteine accessibility method. Methods Enzymol. 1998;293:123–145. doi: 10.1016/s0076-6879(98)93011-7. [DOI] [PubMed] [Google Scholar]
- 13.Lin J, Parrish W, Eilers M, Smith SO, Konopka JB. Aromatic residues at the extracellular ends of transmembrane domains 5 and 6 are important for ligand activation of the G protein-coupled a-factor receptor. Biochemistry. 2003;42:293–301. doi: 10.1021/bi026766o. [DOI] [PubMed] [Google Scholar]
- 14.Lin JC, Duell K, Konopka JB. A microdomain formed by the extracellular ends of the transmembrane domains promotes activation of the G proteincoupled a-factor receptor. Mol. Cell. Biol. 2004;24:2041–2051. doi: 10.1128/MCB.24.5.2041-2051.2004. [DOI] [PMC free article] [PubMed] [Google Scholar]
- 15.Schiestl RH, Gietz RD. High efficiency transformation of intact yeast cells using single stranded nucleic acids as a carrier. Curr. Genet. 1989;16:339–346. doi: 10.1007/BF00340712. [DOI] [PubMed] [Google Scholar]
- 16.Sherman F. Getting started with yeast. Methods Enzymol. 2002;350:3–41. doi: 10.1016/s0076-6879(02)50954-x. [DOI] [PubMed] [Google Scholar]
- 17.Dube P, DeConstanzo A, Konopka JB. Interaction between transmembrane domains 5 and 6 in the α-factor receptor. J. Biol. Chem. 2000;275:26492–26499. doi: 10.1074/jbc.M002767200. [DOI] [PubMed] [Google Scholar]
- 18.Blumer KJ, Thorner J. β and γ subunits of a yeast guanine nucleotidebinding protein are not essential for membrane association of the a subunit but are required for receptor coupling. Proc. Natl. Acad. Sci. U.S.A. 1990;87:4363–4367. doi: 10.1073/pnas.87.11.4363. [DOI] [PMC free article] [PubMed] [Google Scholar]
- 19.Chen JG, Rudnick G. Permeation and gating residues in serotonin transporter. Proc. Natl. Acad. Sci. U S A. 2000;97:1044–1049. doi: 10.1073/pnas.97.3.1044. [DOI] [PMC free article] [PubMed] [Google Scholar]
- 20.Mentesana PE, Dosil M, Konopka JB. Functional assays for mammalian G-protein-coupled receptors in yeast. Methods Enzymol. 2002;344:92–111. doi: 10.1016/s0076-6879(02)44708-8. [DOI] [PubMed] [Google Scholar]
- 21.Parrish W, Eilers M, Ying W, Konopka JB. The cytoplasmic end of transmembrane domain 3 regulates the activity of the Saccharomyces cerevisiae G-protein- coupled α-factor receptor. Genetics. 2002;160:429–443. doi: 10.1093/genetics/160.2.429. [DOI] [PMC free article] [PubMed] [Google Scholar]
- 22.Dube P, Konopka JB. Identification of a polar region in transmembrane domain 6 that regulates the function of the G protein-coupled α-factor receptor. Mol. Cell. Biol. 1998;18:7205–7215. doi: 10.1128/mcb.18.12.7205. [DOI] [PMC free article] [PubMed] [Google Scholar]
- 23.Konopka JB, Jenness DD. Genetic fine-structural analysis of the Saccharomyces cerevisiae α-pheromone receptor. Cell Regulation. 1991;2:439–452. doi: 10.1091/mbc.2.6.439. [DOI] [PMC free article] [PubMed] [Google Scholar]
- 24.Dosil M, Schandel K, Gupta E, Jenness DD, Konopka JB. The Cterminus of the Saccharomyces cerevisiae α-factor receptor contributes to the formation of preactivation complexes with its cognate G protein. Mol. Cell. Biol. 2000;20:5321–5329. doi: 10.1128/mcb.20.14.5321-5329.2000. [DOI] [PMC free article] [PubMed] [Google Scholar]
- 25.Reneke JE, Blumer KJ, Courchesne WE, Thorner J. The carboxyl terminal domain of the α-factor receptor is a regulatory domain. Cell. 1988;55:221–234. doi: 10.1016/0092-8674(88)90045-1. [DOI] [PubMed] [Google Scholar]
- 26.Palczewski K, Kumasaka T, Hori T, Behnke CA, Motoshima H, Fox BA, Le Trong I, Teller DC, Okada T, Stenkamp RE, Yamamoto M, Miyano M. Crystal structure of rhodopsin: A G protein-coupled receptor. Science. 2000;289:739–745. doi: 10.1126/science.289.5480.739. [DOI] [PubMed] [Google Scholar]
- 27.Li J, Edwards PC, Burghammer M, Villa C, Schertler GF. Structure of bovine rhodopsin in a trigonal crystal form. J. Mol. Biol. 2004;343:1409–1438. doi: 10.1016/j.jmb.2004.08.090. [DOI] [PubMed] [Google Scholar]
- 28.Altenbach C, Klein-Seetharaman J, Hwa J, Khorana HG, Hubbell WL. Structural features and light-dependent changes in the sequence 59-75 connecting helices I and II in rhodopsin: a site-directed spin-labeling study. Biochemistry. 1999;38:7945–7949. doi: 10.1021/bi990014l. [DOI] [PubMed] [Google Scholar]
- 29.Altenbach C, Yang K, Farrens DL, Farahbakhsh ZT, Khorana HG, Hubbell WL. Structural features and light-dependent changes in the cytoplasmic interhelical E-F loop region of rhodopsin: a site-directed spin- labeling study. Biochemistry. 1996;35:12470–12478. doi: 10.1021/bi960849l. [DOI] [PubMed] [Google Scholar]
- 30.Altenbach C, Cai K, Khorana HG, Hubbell WL. Structural features and light-dependent changes in the sequence 306-322 extending from helix VII to the palmitoylation sites in rhodopsin: a site-directed spin-labeling study. Biochemistry. 1999;38:7931–7937. doi: 10.1021/bi9900121. [DOI] [PubMed] [Google Scholar]
- 31.Farahbakhsh ZT, Ridge KD, Khorana HG, Hubbell WL. Mapping light-dependent structural changes in the cytoplasmic loop connecting helices C and D in rhodopsin: a site-directed spin labeling study. Biochemistry. 1995;34:8812–8819. doi: 10.1021/bi00027a033. [DOI] [PubMed] [Google Scholar]
- 32.Moller S, Croning MD, Apweiler R. Evaluation of methods for the prediction of membrane spanning regions. Bioinformatics. 2001;17:646–653. doi: 10.1093/bioinformatics/17.7.646. [DOI] [PubMed] [Google Scholar]
- 33.Killian JA, von Heijne G. How proteins adapt to a membrane-water interface. Trends Biochem. Sci. 2000;25:429–434. doi: 10.1016/s0968-0004(00)01626-1. [DOI] [PubMed] [Google Scholar]
- 34.Chinault SL, Overton MC, Blumer KJ. Subunits of a yeast oligomeric G protein-coupled receptor are activated independently by agonist but function in concert to activate G protein heterotrimers. J Biol. Chem. 2004;279:16091–16100. doi: 10.1074/jbc.M311099200. [DOI] [PubMed] [Google Scholar]
- 35.Martin NP, Leavitt LM, Sommers CM, Dumont ME. Assembly of G protein-coupled receptors from fragments: identification of functional receptors with discontinuities in each of the loops connecting transmembrane segments. Biochemistry. 1999;38:682–695. doi: 10.1021/bi982062w. [DOI] [PubMed] [Google Scholar]
- 36.Gilchrist A, Bunemann M, Li A, Hosey MM, Hamm HE. A dominant-negative strategy for studying roles of G proteins in vivo. J. Biol. Chem. 1999;274:6610–6616. doi: 10.1074/jbc.274.10.6610. [DOI] [PubMed] [Google Scholar]
- 37.Sommers CM, Martin NP, Akal-Strader A, Becker JM, Naider F, Dumont ME. A limited spectrum of mutations causes constitutive activation of the yeast α-factor receptor. Biochemistry. 2000;39:6898–6909. doi: 10.1021/bi992616a. [DOI] [PubMed] [Google Scholar]
- 38.Konopka JB, Margarit M, Dube P. Mutation of pro-258 in transmembrane domain 6 constitutively activates the G protein-coupled α-factor receptor. Proc. Natl. Acad. Sci. USA. 1996;93:6764–6769. doi: 10.1073/pnas.93.13.6764. [DOI] [PMC free article] [PubMed] [Google Scholar]
- 39.Mentesana PE, Konopka JB. Mutational analysis of the role of Nglycosylation in alpha-factor receptor function. Biochemistry. 2001;40:9685–9694. doi: 10.1021/bi0108507. [DOI] [PubMed] [Google Scholar]
- 40.Melen K, Krogh A, von Heijne G. Reliability measures for membrane protein topology prediction algorithms. J. Mol. Biol. 2003;327:735–744. doi: 10.1016/s0022-2836(03)00182-7. [DOI] [PubMed] [Google Scholar]
Associated Data
This section collects any data citations, data availability statements, or supplementary materials included in this article.


