Abstract
Objective: To study the relationships among magnetic resonance imaging (MRI), histological findings, and insulin-like growth factor-I (IGF-I) in steroid-induced osteonecrosis of the femoral head in rabbits. Methods: Thirty rabbits were randomly divided into experimental Group A (n=15) and control Group B (n=15). The 7.5 mg/kg (2 ml) of dexamethasone (DEX) and physiological saline (2 ml) were injected into the right gluteus medius muscle twice at one-week intervals in animals of Groups A and B, respectively. At 4, 8 and 16 weeks after obtaining an MRI, the rabbits were sacrificed and the femoral head from one side was removed for histological study of lacunae empty of osteocytes, subchondral vessels, and size of fat cells under microscopy, and the femoral head from the other side was removed for enzyme-linked immunoadsorbent assay (ELISA) for IGF-I. Results: At 4, 8 and 16 weeks after treatment, no necrotic lesions were detected in Group B, while they were detected in Group A. Light microscopy revealed that the fat cells of the marrow cavity were enlarged, subchondral vessels were evidently decreased, and empty bone lacunae were clearly increased. The IGF-I levels in Group A were significantly higher than those in Group B. At 8 weeks after the DEX injection, the MRI of all 20 femora showed an inhomogeneous, low signal intensity area in the femoral head, and at 16 weeks, the findings of all 10 femora showed a specific “line-like sign”. The MRI findings of all femora in Group B were normal. Conclusion: MRI is a highly sensitive means of diagnosing early experimental osteonecrosis of the femoral head. However, the abnormal marrow tissues appeared later than 4 weeks when the expression of IGF-I increased. This reparative factor has an early and important role in response to steroid-induced osteonecrosis of the femoral head, and provides a theoretical foundation for understanding the pathology and designing new therapies.
Keywords: Dexamethasone (DEX), Insulin-like growth factor-I (IGF-I), Magnetic resonance imaging (MRI), Osteonecrosis of the femoral head, Pathology
INTRODUCTION
An experimental rabbit model for steroid-induced osteonecrosis of the femoral head (ONFH) was first reported in (Yamamoto et al., 1997). High level of serum lipid in the early period (1~2 weeks) after steroid injection is important for the development of ONFH (Yamamoto et al., 1997), and a significant amount of lipid transport to the bone tissue has been suggested as the possible etiology in this model (Miyanishi et al., 2001). In bone tissue, such lipid is deposited on marrow fat cells (Gimble et al., 1996). An in vitro study reported that steroid stimulates the differentiation of cells in the bone marrow stroma into adipocytes, as well as the accumulation of fat in the marrow, thereby suppressing differentiation of the cells into osteoblasts (Cui et al., 1997). In a consideration of the compartmental nature of bone, Miyanishi et al.(2002) hypothesized that steroid-induced fat cell enlargement contributes to the development of ONFH in rabbits by increasing intraosseous pressure and decreasing blood flow within the hard cortex. This lipid-induced hypertrophy of the fat cells cannot expand the marrow cavity within the inflexible osseous cage. Consequently, the intraosseous pressure rises, leading to sinusoidal compression, venous stasis, and, eventually, arterial obstruction, accounting for the ischemic osteonecrosis (Miyanishi et al., 2002). The outcome of elevated intraosseous pressure depends to a large extent on additional parameters. Steroid-induced cholesterol deposition reduces the fluidity and permeability of cell membranes, contributing to osteocyte death. Microfractures, accumulating in the fragile remodeled bone, further compress the subchondral vessels, further compromising the already unstable circulation. The blood flow may be reduced by up to one third after continuous steroid treatment for 10 weeks. A failing blood supply of this magnitude would by itself be insignificant but would exacerbate cell death incidental to other conditions. Lastly, intraosseous hypertension inhibits the regeneration of blood vessels. Despite the wealth of literature on the subject, the exact pathogenesis of non-traumatic ONFH remains uncertain.
Insulin-like growth factor-I (IGF-I) is an essential factor for cell function and differentiation of chondrocytes during enchondral ossification, promotes the proliferation of osteoblasts, and stimulates the activation of IGF receptors; however, the role of IGF-I in steroid-induced ONFH is not clear (Jia and Heersche, 2000; Cheng et al., 2002).
Magnetic resonance imaging (MRI) is a comparatively sensitive diagnostic modality for early diagnosis of osteonecrosis (Vande Berg et al., 2006; Koo et al., 1999; Sakaia et al., 2000). However, unless reparative tissue appears in stage 1, conventional MRI is not believed to detect necrotic lesions in stage 0 of the ARCO (Association Research Circulation Osseous) international classification (Uberoi et al., 1994). If the sensitivity of MRI for detecting ONFH is increased, the duration of stage 0 can be shortened, so that the onset of ONFH development becomes clearer. To understand the nature of and reasons for time-dependent changes in MRI findings of ONFH from the onset, we conducted a longitudinal experimental study of serial repetitive MRI using a non-traumatic ONFH model in rabbits.
In order to deepen our understanding of the prevention, diagnosis and treatment of steroid-induced ONFH, it is important to clarify the time of disease onset after starting steroid treatment. It is also essential to clarify the relationship between the time when abnormal fat metabolism appears and the onset of ONFH, because abnormal fat metabolism is thought to be related to steroid-induced ONFH. In this report, we discuss the relationships among MRI, histological findings, and IGF-I in steroid-induced ONFH in rabbits.
MATERIALS AND METHODS
Animals
Thirty adult rabbits weighing 2.0~2.5 kg were purchased from the Animal Experimental Center of Zhejiang Medical Academy, China. The animals were housed at a constant temperature [(22±3) °C] and relative humidity [(50±20)%], and were allowed free access to food and water. All animals received humane care during this study, and the protocol was approved by the Institutional Animal Care Committee, China.
Protocol
The rabbits were randomly divided into experimental Group A (n=15) and control Group B (n=15). In Group A, 7.5 mg/kg (2 ml) of dexamethasone (DEX) was injected into the right gluteus medius muscle twice at one-week intervals. Group B was injected with physiological saline (2 ml) into the right gluteus medius muscle as a control. One rabbit in Group A died within 2 weeks of injection, and was excluded from the study; the remaining 14 rabbits were used for the following analyses. At 4 weeks after injection, 4 rabbits from Group A and 5 from Group B and at 8 and 16 weeks after injection, 5 rabbits from Group A and 5 from Group B were euthanized, respectively.
Computerized radiograph (CR) imaging
Serial radiographs of the femur using a Kodak 900 CR system were obtained for each rabbit before the first DEX injection, then at 4, 8 and 16 weeks after injection. The imaging parameters of the radiography were 70 kV and 8 mAs. Briefly, rabbits were anesthetized before CR by inhalation of halothane and each was placed supine in an imaging bed with the hips and knees flexed at right angles.
MRI
Serial coronal images of the rabbit femur were obtained repeatedly for each rabbit before the first DEX injection, then 4, 8 and 16 weeks after injection. MR images of the femur were obtained using a 1.5 Tesla superconducting magnet system (GE Signa Excite, USA). Briefly, rabbits were anesthetized by inhalation of halothane and each was placed supine in an imaging coil with the hips and knees flexed at right angles. Four contiguous multisection images in the coronal plane were obtained. The imaging parameters of the 1.5 Tesla system were a 3-mm slice thickness, a 256×128 imaging matrix, a field 140 mm of view, and 2 or 4 acquisitions. T2-weighted (T2W, repetition time (TR)/echo time (TE) 1500/60 ms), T1-weighted (T1W, TR/TE 600/18 ms) and fat suppression T1-weighted (FST1W) images were obtained with a spin echo (SE) sequence. MR images obtained before the first DEX injection were used as controls.
Histological study
After the 4-week (Group A, 4 rabbits; Group B, 5 rabbits), 8-week and 16-week MRIs (Groups A and B, 5 rabbits each), the animals were sacrificed. The femur was removed from one side for histological study, and the one from the other side for IGF-I assay. The femora were fixed in buffered 4% (w/w) paraformaldehyde saline (pH 7.4) at 4 °C, and decalcified in ethylene diamine tetraacetic acid (EDTA; pH 7.4) at 37 °C. They were then cut along the coronal plane to visualize trabecular bone and bone marrow. The specimens were embedded in paraffin, cut into 4-mm slices, and stained with hematoxylin and eosin (HE). Evidence of trabecular bone necrosis (ONFH) was defined as the presence of lacunae entire empty of osteocytes, decreased number of subchondral vessels and increased size of fat cells, as measured by micrometer under a light microscope; the size of the red blood cell was set as reference, at ×100 magnification.
IGF-I assay
Femora were dissected and freed from surrounding tissue under sterile conditions and immediately frozen in liquid nitrogen. Those from one side were kept in 2.2 mol/L HCl at 4 °C for 12 h, and washed with distilled water, and serial 20-µm sections were cut on cryostat (HE505E, Germany) and collected. The protein of the femora was extracted with a homogenizer (Polytron, PF 1200, Switzerland), and an aliquot was taken for total protein concentration according to Lowry’s method. After extraction, samples were centrifuged at 12 000 r/min and the supernatant was stored at −80 °C for assay. This assay applied the quantitative sandwich enzyme immunoassay technique (enzyme-linked immunoadsorbent assay (ELISA) Kit, Cat No. E0050Rb, Wuhan Uscn Sciences Co., Ltd., China). The procedures and analyses were performed according to the instructions of the manufacturer and reference (Wildemann et al., 2004). The minimum detectable dose of rabbit IGF-I is typically less than 0.078 ng/ml. The kit showed no cross-reactivity to IGF-II. The interassay coefficient of variation (CV) was 6.7% and the intra-assay CV was 2.31%.
RESULTS AND DISCUSSION
Histological study
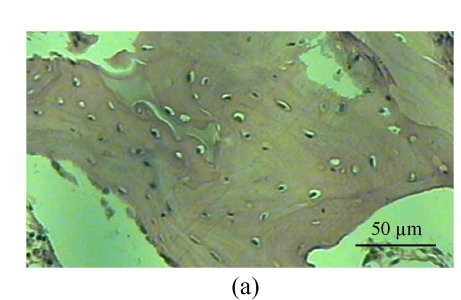
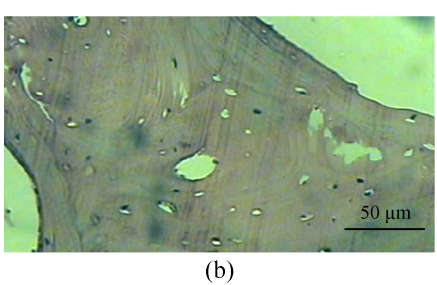
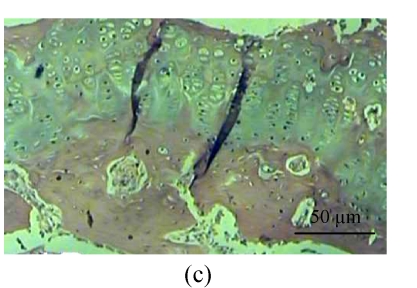
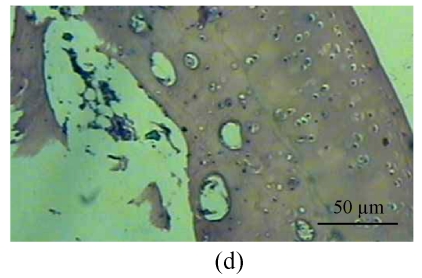
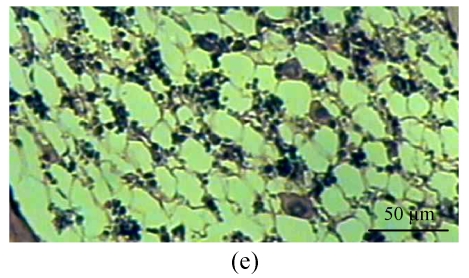
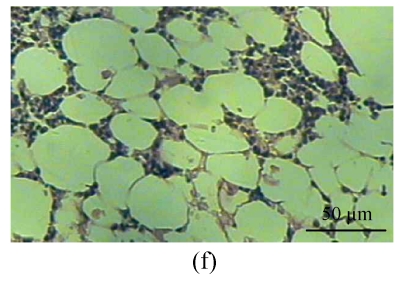
One rabbit of experimental Group A died within 2 weeks after injection, and was thus excluded from this study and the remaining 14 rabbits were used for the following analyses. At 4 weeks after test, 4 rabbits of the experimental Group A and 5 rabbits of the control Group B, and at 8, 16 weeks after test, 5 rabbits of the experimental Group A and 5 rabbits of the control Group B were sacrificed, respectively. The shape of the femoral head was normal in both groups. When they were cut along the coronal plane, the femoral head of Group A had osteoporosis and was easy to be cut; no necrotic lesions were found. In Group B, the femoral head was hard to be cut, and no necrotic lesions were found. Light microscopy revealed that the fat cells of the marrow cavity were enlarged, the subchondral vessels were evidently decreased, and the empty bone lacunae were clearly increased in Group A, while there were no pathological changes of structure in Group B. The differences between Groups A and B were statistically significant (P<0.001) (Fig.1; Tables 1~3).
Fig. 1.
Histological study of the light microscopy (HE staining). (a) Normal lacunae in Group B; (b) Empty lacunae increased 16 weeks after DEX injection in Group A; (c) Normal subchondral vessels in Group B; (d) Subchondral vessels decreased 16 weeks after DEX injection in Group A; (e) Normal fat cells of marrow cavity in Group B; (f) Enlarged fat cells of marrow cavity 16 weeks after DEX injection in Group A
Table 1.
Results of light microscopy 4 weeks after DEX injection
| Group | n | Empty lacunae n | Subchondral vessels n | Fat cell dia. (µm) |
| A | 4 | 5.80±2.57 | 3.7±1.30 | 50.55±6.50 |
| B | 5 | 3.96±2.62 | 5.4±1.78 | 40.88±4.04 |
| t | 2.36 | 3.57 | 6.11 | |
| P | <0.01 | <0.001 | <0.001 | |
Note: Group A: 4 rabbits, 5 histological sections/rabbit; Group B: 5 rabbits, 5 histological sections/rabbit
Table 3.
Results of light microscopy 16 weeks after DEX injection
| Group | n | Empty lacunae n | Subchondral vessels n | Fat cell dia. (µm) |
| A | 5 | 6.72±3.06 | 2.76±1.20 | 51.36±4.24 |
| B | 5 | 2.64±0.76 | 4.48±1.30 | 33.56±2.81 |
| t | 6.47 | 4.87 | 17.48 | |
| P | <0.001 | <0.001 | <0.001 | |
Note: Groups A and B: 5 rabbits, 5 histological sections/rabbit
Table 2.
Results of light microscopy 8 weeks after DEX injection
| Group | n | Empty lacunae n | Subchondral vessels n | Fat cell dia. (µm) |
| A | 5 | 6.04±1.99 | 2.72±1.06 | 49.16±4.40 |
| B | 5 | 3.64±1.47 | 4.00±1.15 | 44.52±4.66 |
| t | 4.85 | 4.08 | 3.62 | |
| P | <0.001 | <0.001 | <0.001 | |
Note: Groups A and B: 5 rabbits, 5 histological sections/rabbit
IGF-I study
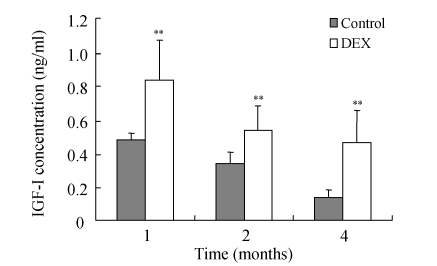
IGF-I was significantly increased in the femoral head at 4, 8 and 16 weeks after DEX injection (Table 4 and Fig.2), but IGF-I level decreased with age of rabbits in the control Group B.
Table 4.
IGF-I assay 4, 8 and 16 weeks after injection
| Group | n | IGF-I concentration (ng/ml) |
||
| 4 weeks | 8 weeks | 16 weeks | ||
| A | 5 (4)* | 0.833±0.212 | 0.679±0.098 | 0.566±0.211 |
| B | 5 | 0.477±0.088 | 0.339±0.142 | 0.137±0.086 |
| t | 3.4219 | 4.4064 | 4.2100 | |
| P | <0.005 | <0.0025 | <0.0025 | |
One rabbit died at 4 weeks after injection
Fig. 2.
Results of IGF-I assay at 4, 8 and 16 weeks after DEX injection. DEX was injected into the right gluteus medius muscle in DEX group, while control was injected with physiological saline
CR study
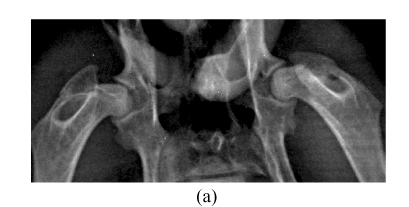
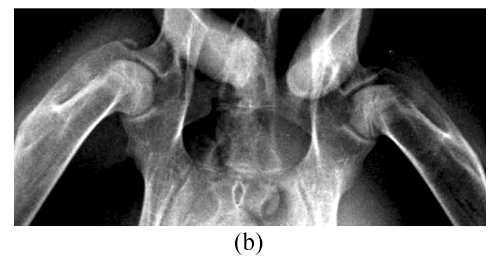
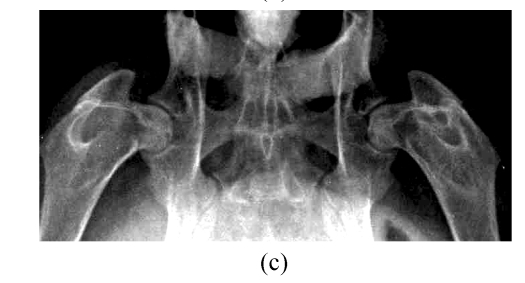
At 4, 8 and 16 weeks after the injection of corticosteroid, the radiographic morphology of the femoral heads from group A was normal throughout. However, the metaphysis and diaphysis showed osteoporosis, trabecular bone became irregular and unclear, and finally, low-density patchy shadows and radiolucent cystic areas were seen in CR. In Group B, the femoral head had normal radiographic morphology, as did trabecular bone and bone density throughout the study (Fig.3).
Fig. 3.
CR study. (a) Normal radiographic morphology of the femoral head, trabecular bone and bone density throughout the study in Group B; (b) Radiographic morphology of the femoral heads in Group A was normal, but the metaphysis and diaphysis showed osteoporosis, and trabecular bone became irregular and unclear at 4 weeks; (c) Radiographic morphology of the femoral heads of Group A was normal, but low-density patchy shadows and radiolucent cystic areas were seen in the femoral head at 16 weeks
MRI study
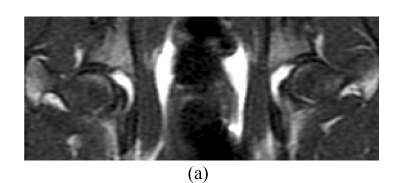
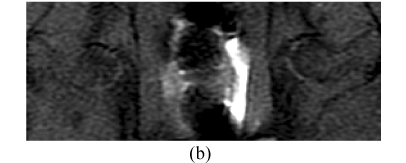
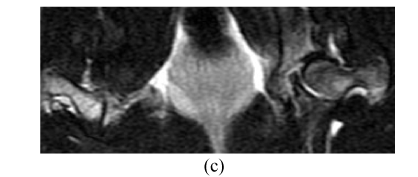
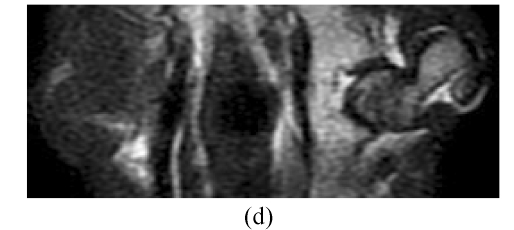
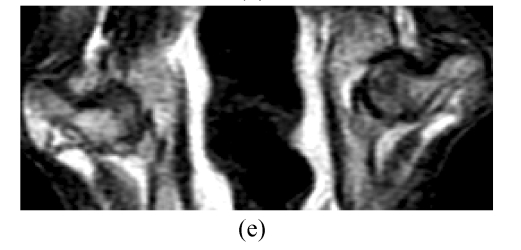
Before the corticosteroid injection, all 60 femora from 30 rabbits showed homogeneously low or intermediate signal intensity on T1W images, intermediate or high signal intensity on T2W, and homogeneously low signal intensity on STIR (short tau inversion recovery) images. In Group A, 4 weeks after the corticosteroid injection, the findings of all 28 femora (one rabbit had died) were normal on MRI (Figs.4a~4c). Eight weeks after injection, the findings of all 20 femora were abnormal, such as an inhomogeneous and low signal intensity area in the femoral head. Sixteen weeks after injection, the findings of all 10 femora showed a specific “line-like sign”, that is, high-signal intensity areas were surrounded by low signal intensity areas in the femoral head (Figs.4d and 4e). In Group B, the findings of all femora were normal on MRI throughout the study (Fig.4).
Fig. 4.
In Group B, MRI showing homogeneously low or intermediate signal intensity on T1W image (a) and STIRE image (b), homogeneously high or intermediate signal intensity on T2W image (c); In Group A, MRI showing an inhomogeneous and low signal intensity area in the femoral head on T1W image (d) and specific “line-like sign” in the femoral head on T1W image (e)
In addition to mediating the growth-promoting effects of growth hormone (GH), IGF-I is now recognized to influence various aspects of carbohydrate, lipid and protein metabolism. Because of its structural homology to insulin, the metabolic effects of these two polypeptides are, for the most part, qualitatively similar. These effects include the ability to increase the rates of glucose transport and glycolysis in muscle, reduce blood glucose levels in vivo, enhance lipogenesis in adipose tissue, stimulate protein synthesis and inhibit protein breakdown in skeletal muscle (Fan et al., 1994; Turkalj et al., 1992; Krause et al., 1992). Although the liver appears to be the major source of circulating IGF-I (Schwander et al., 1983), extrahepatic tissues have been shown to contain the peptide and the mRNA for IGF-I (D′Ercole et al., 1984; Murphy et al., 1987). Furthermore, tissue-specific changes in IGF-I protein and/or mRNA have been observed under several pathophysiological conditions, such as neoplasia and diabetes (Catanese et al., 1993; Gelato et al., 1991). Hence, IGF-I appears to function both in autocrine and paracrine fashions to regulate metabolism. Collectively, these data suggest that in vivo regulation of IGF-I action can be achieved by changing the circulating and/or tissue levels of IGF-I itself. Gram-negative infection and trauma often produce hypercatabolism that is associated with muscle wasting. A depression in the anabolic functions of IGF-I on protein metabolism might contribute to the catabolic state produced during these and related stress conditions. Several studies have shown that circulating IGF-I levels are depressed in a heterogeneous population of severely ill patients (Ross et al., 1991; Hawker et al., 1987). However, there is ample evidence in the literature attesting to the tissue-specific regulation of IGF-I and its binding proteins. Therefore, it is clear that IGF-I can regulate metabolism in a paracrine/autocrine manner that may not be adequately reflected by determining blood levels. To our knowledge, there is no information concerning alterations in the levels of IGF-I in steroid-induced rabbit ONFH.
The results of this study indicate that DEX induces dynamic changes of IGF-I level in the femoral head. It is significant that the glucocorticoid hormonal alterations result in anoxia and ischemia in femoral head. In this study, IGF-I took part early in the pathologic processes of steroid-induced ONFH. The processes in the femoral head include anoxia and ischemia. Anoxia is an irritant factor in stimulating IGF-I expression. Four weeks after corticosteroid injection, pathologic assessment demonstrated that the fat cells of marrow cavity were enlarged, subchondral vessels were evidently decreased, and empty bone lacunae were clearly increased, so the intraosseous pressure rose and ONFH developed early. Meanwhile, the expression of IGF-I had increased, suggesting that the reparative reaction itself began early. With IGF-I and other factors, inflammation and congestion were initiated around the necrotic lesions resulting in osteoporosis. Over weeks, a reactive boundary face was formed between the anoxia and normal areas where congestion, inflammatory cells, and reparative fibrous tissues had occurred. The regenerative vessels formed in the necrotic area absorbed necrotic bone tissues by osteoclast action and stimulated an ossification reaction, which resulted in an increment of bone trabeculae, because the ossification was deposited directly on the necrotic lesion. If the reparative reaction was incomplete, remnant necrotic lesions were replaced by fibrous and other tissues. Therefore, IGF-I has an important role in the reparative processes of ONFH, and these results provide a theoretical foundation for therapy. In this study, although the levels of IGF-I in Group A were markedly higher than those in Group B (P<0.005) throughout the study, the levels of IGF-I in both groups had a decreasing trend with age. The mechanism needs to be further clarified.
The mechanism by which corticosteroid mediates these changes in IGF-I is unknown; however, corticosteroid is a potent immunosuppressant, resulting in the release of a large number of secretary products from macrophages. Hence, we hypothesize that the effect of corticosteroid on IGF-I is mediated indirectly through the enhanced production of one or more cytokines.
We did not find marrow necrosis, and normal shape of fibrous tissues and normal density of bone trabecula were showed under CR at 4 and 8 weeks, but we found low-density patchy shadows and radiolucent cystic areas in the femoral head at 16 weeks by CR. Therefore, we considered that serial radiographs showed ONFH 16 weeks after corticosteroid injection.
MRI is a highly sensitive means of diagnosing early experimental ONFH, showing abnormal marrow tissues including edema, necrosis and reparative tissues in marrow, and can be used in judging prognosis and degree of damage (Vande et al., 1999; Mitchell et al., 1986; Brody et al., 1991). In this study, 8 weeks after the corticosteroid injection, the findings of all 20 femora were abnormal by MRI, such as an inhomogeneous and low signal intensity area in the femoral head. Sixteen weeks after the injection, the findings of all 10 femora showed a specific “line-like sign” (Mitchell, 1989; Duda et al., 1993; Vande et al., 1993), that is, high-signal intensity areas were surrounded by low signal intensity areas in the femoral head (Fig.4e). The pathology of the “line-like sign” on MRI is that a reactive boundary face formed between anoxic and normal areas, where congestion, inflammatory cells and reparative fibrous tissues occur. These signs include “single line-like sign”, “double line-like sign” and “three line-like sign”. The single line-like sign reflects fewer reparative tissues at the reactive boundary face than ossification of outer normal tissues; the double line-like sign reflects ossification on microfractures above the single line-like sign; and the three-line-like sign reflects ossification on the reactive boundary face of an inner necrotic lesion and outer normal tissues. In this study, the single line-like sign appeared on MRI, in which the central areas of high-signal intensity represented necrotic fat tissues that were not hydrated. We found that MRI is a highly sensitive means of diagnosing early experimental ONFH, but it detected abnormal marrow tissues after 4 weeks on expression of IGF-I, so we must improve the technique such as using contrast-enhanced fat suppression MRI.
The ONFH in this rabbit model has histological similarity to ONFH in humans. The histopathologic features of ONFH in this model are characterized by empty lacunae and appositional bone formation accompanied by surrounding marrow necrosis, and by reparative changes including fibrous tissues and new trabecular bone formation. However, ONFH in this model did not induce collapse of the ONFH region, because experimental necrotic lesions were detected early on MRI and the natural course of the experimental ONFH lesions was monitored by MRI. This is useful for investigating the pathophysiology of ONFH and evaluating treatment strategies. MRI may also be clinically useful for the detection of early ONFH to establish preventative treatments against its development in patients with organ transplantation, because the onset of the episode (transplantation or steroid administration) is clearly defined.
CONCLUSION
We conclude that this study is the first one prospectively addressing the relationships among MRI, histological findings, and IGF-I. The findings in the present study suggest that IGF-I has an important role in reparative processes of ONFH, and that MRI is a highly sensitive means of diagnosing early experimental ONFH at 8 weeks in steroid-induced rabbit osteonecrosis of the femoral head. The study provides a theoretical foundation for therapy for ONFH.
Acknowledgments
The author would like to thank Jing-quan Wang, pathologist at the 117 Hospital of the People Liberation Army, for carrying out the pathologic assessments. We wish to thank Prof. Iain C. Bruce, Department of Physiology, School of Medicine, Zhejiang University, China, for his help with the English editing of the manuscript.
Footnotes
Project (No. 06MA169) supported by the Medical Science Foundation of Nanjing Military Region, China
The papers for the Postdoctoral Fellows Association of Zhejiang Province, China
References
- 1.Brody AS, Strong M, Babikian G. Avascular necrosis: early MR imaging and histologic findings in a canine model. AJR. 1991;157(2):341–345. doi: 10.2214/ajr.157.2.1853819. [DOI] [PubMed] [Google Scholar]
- 2.Catanese VM, Svfiavolino PJ, Lango MN. Discordant, organspecific regulation of insulin-like growth factor-I messenger ribonucleic acid in insulin-deficient diabetes in rats. Endocrinology. 1993;132(2):496–503. doi: 10.1210/en.132.2.496. [DOI] [PubMed] [Google Scholar]
- 3.Cheng MZ, Simon CF, Rawlinsine AA. Human osteoblast proliferative responses to strain and 17beta2 estrodiol are mediated by the estrogen receptor and the receptor for lnsulin-like growth factor I. J Bone Miner Res. 2002;17(4):593–602. doi: 10.1359/jbmr.2002.17.4.593. [DOI] [PubMed] [Google Scholar]
- 4.Cui Q, Wang GJ, Balian G. Steroid-induced adipogenesis in a pluripotential cell line from bone marrow. J Bone Joint Surg. 1997;79(7):1054–1063. doi: 10.2106/00004623-199707000-00012. [DOI] [PubMed] [Google Scholar]
- 5.D′Ercole AJ, Stiles AD, Underwood LE. Tissue concentrations of somatomedin-C: further evidence for multiple sites of synthesis and paracrine or autocrine mechanisms of action. Proc Natl Acad Sci USA. 1984;81(3):935–939. doi: 10.1073/pnas.81.3.935. [DOI] [PMC free article] [PubMed] [Google Scholar]
- 6.Duda SH, Laniado M, Schick F. The double-line sign of osteonecrosis: evaluation on chemical shift MR images. Eur J Radiol. 1993;16(3):233–238. doi: 10.1016/0720-048X(93)90081-W. [DOI] [PubMed] [Google Scholar]
- 7.Fan F, Molina PE, Gelato MC, Lang CH. Differential tissue regulation of insulin-like growth factor-I content and binding proteins after endotoxin. Endocrinology. 1994;134(4):1685–1692. doi: 10.1210/en.134.4.1685. [DOI] [PubMed] [Google Scholar]
- 8.Gelato MC, Vassalotti J, Spatola E, Carlson HE, Rulherford C, Marsh K. Differential tissue regulation of the insulin-like growth factors in rats bearing the MStT/W15 pituitary tumor. Neuroendocrinology. 1991;561(6):765–774. doi: 10.1159/000126306. [DOI] [PubMed] [Google Scholar]
- 9.Gimble JM, Robinson CE, Wu X, Kelly KA. The function of adipocytes in the bone marrow stroma: an update. Bone. 1996;19(5):421–428. doi: 10.1016/S8756-3282(96)00258-X. [DOI] [PubMed] [Google Scholar]
- 10.Hawker FH, Stewart PM, Baxter RC, Borkmann M, Tan K. Relationship of somatomedin-C/1 insulin-like growth factor I levels to conventional nutritional indices in critically ill patients. Crit Care Med. 1987;15(8):732–736. doi: 10.1097/00003246-198708000-00004. [DOI] [PubMed] [Google Scholar]
- 11.Jia DA, Heersche JNM. Insulin like growth factor-1 and 2 stimulate osteoprogenitor proliferation and differentiation and adipocyte formation in cell populations derived from adult rat bone. Bone. 2000;27(6):785–794. doi: 10.1016/S8756-3282(00)00400-2. [DOI] [PubMed] [Google Scholar]
- 12.Koo KH, Ahn IO, Kim R. Bone marrow edema and associated pain in early stage osteonecrosis of the femoral head: prospective study with serial MR images. Radiology. 1999;213(3):715–722. doi: 10.1148/radiology.213.3.r99dc06715. [DOI] [PubMed] [Google Scholar]
- 13.Krause U, Wegener G, Hewsholme EA. Effects of insulin-like growth factor I on the rates of glucose transport and utilization in rat skeletal muscle in vifro. Biochem J. 1992;285(Pt 1):269–274. doi: 10.1042/bj2850269. [DOI] [PMC free article] [PubMed] [Google Scholar]
- 14.Mitchell DG. Using MR imaging to probe the pathophysiology of osteonecrosis. Radiology. 1989;171(1):25–26. doi: 10.1148/radiology.171.1.2928533. [DOI] [PubMed] [Google Scholar]
- 15.Mitchell MD, Kundel HL, Steinberg ME, Kressel HY, Alavi A, Axel L. Avascular necrosis of the hip: comparison of MR, CT, and scintigraphy. AJR. 1986;147(1):67–71. doi: 10.2214/ajr.147.1.67. [DOI] [PubMed] [Google Scholar]
- 16.Miyanishi K, Yamamoto T, Irisa T, Yamashita A, Jingushi S, Noguchi Y, Iwamoto Y. A high LDL/HDL cholesterol ratio as a potential risk factor for corticosteroid-induced osteonecrosis in rabbits. Rheumatology. 2001;40(2):196–201. doi: 10.1093/rheumatology/40.2.196. [DOI] [PubMed] [Google Scholar]
- 17.Miyanishi K, Yamamoto T, Irisa T, Yamashita A, Jingushi S, Noguchi Y, Iwamoto Y. Bone marrow fat cell enlargement and a rise in intraosseous pressure in steroid-treated rabbits with osteonecrosis. Bone. 2002;30(1):185–190. doi: 10.1016/S8756-3282(01)00663-9. [DOI] [PubMed] [Google Scholar]
- 18.Murphy LJ, Bell GI, Friesen HG, Friesen HG. Tissue distribution of insulin like growth factor-I and -II messenger ribonucleic acid in the adult rat. Endocrinology. 1987;120(4):1279–1282. doi: 10.1210/endo-120-4-1279. [DOI] [PubMed] [Google Scholar]
- 19.Ross R, Miell J, Freeman E, Jones J, Matthew D, Buchanan C. Critically ill patients have high basal growth hormone levels with attenuated oscillatory activity associated with low levels of insulin-like growth factor-I. Clin Endocrinol (Oxf) 1991;35(1):47–54. doi: 10.1111/j.1365-2265.1991.tb03495.x. [DOI] [PubMed] [Google Scholar]
- 20.Sakaia T, Suganoa N, Tsuji T, Nishii T, Yoshikawa H, Ohzono K. Serial magnetic resonance imaging in a non-traumatic rabbit osteonecrosis model: an experimental longitudinal study. Magnetic Resonance Imaging. 2000;18(7):897–905. doi: 10.1016/S0730-725X(00)00175-2. [DOI] [PubMed] [Google Scholar]
- 21.Schwander JC, Hauri C, Zapf J, Froesch ER. Synthesis and secretion of insulin-like growth factor and its binding protein by the perfused rat liver: dependence on growth hormone status. Endocrinology. 1983;113(1):297–305. doi: 10.1210/endo-113-1-297. [DOI] [PubMed] [Google Scholar]
- 22.Turkalj I, Keller U, Ninnis R. Effect of increasing doses of recombinant human insulin-like growth factor-I on glucose, lipid and leucine metabolism in man. J Clin Endocrinol Metab. 1992;75(5):1186–1191. doi: 10.1210/jc.75.5.1186. [DOI] [PubMed] [Google Scholar]
- 23.Uberoi R, Tai G, Hughes PM. Gadolinium-DTPA-enhanced MRI in the evaluation of osteonecrosis. Clin Radiol. 1994;49(9):645–648. doi: 10.1016/S0009-9260(05)81884-7. [DOI] [PubMed] [Google Scholar]
- 24.Vande BC, Malghem J, Lecouvet FE, Jamart J, Maldague B. Idiopathic bone marrow edema lesions of the femoral head: predictive value of MR imaging findings. Radiology. 1999;212(2):527–535. doi: 10.1148/radiology.212.2.r99au03527. [DOI] [PubMed] [Google Scholar]
- 25.Vande BE, Malghem JJ, Labaisse MA. MR imaging of avascular necrosis and transient marrow edema of the femoral head. Radiographics. 1993;13:501–520. doi: 10.1148/radiographics.13.3.8316660. [DOI] [PubMed] [Google Scholar]
- 26.Vande Berg B, Gilon R, Malghem J, Lecouvet F, Depresseux G, Houssiau F. Correlation between baseline femoral neck marrow status and the development of femoral head osteonecrosis in corticosteroid-treated patients: a longitudinal study by MR imaging. Eur J Radiol. 2006;58(3):444–449. doi: 10.1016/j.ejrad.2006.01.009. [DOI] [PubMed] [Google Scholar]
- 27.Wildemann B, Schmidmaier G, Brenner N. Quantification, localization, and expression of IGF-I and TGF-β1 during growth factor-stimulated fracture healing. Calcif Tissue Int. 2004;74(4):388–397. doi: 10.1007/s00223-003-0117-2. [DOI] [PubMed] [Google Scholar]
- 28.Yamamoto T, Irisa T, Sugioka Y, Sueishi K. Effects of pulse methylprednisolone on bone and marrow tissues. Arthritis Rheum. 1997;40(11):2055–2064. doi: 10.1002/art.1780401119. [DOI] [PubMed] [Google Scholar]


