

Abstract
Multichain immune recognition receptors (MIRRs) found on the surface of T cells, B cells, mast cells, natural killer cells, basophils, and other immune cells, are formed by the association of several single-pass transmembrane proteins, with immunoglobulin-like ligand recognition domains and signal-transducing domains present on separate subunits. The MIRR signaling subunits all have cytoplasmic domains containing one or more copies of an immunoreceptor tyrosine-based activation motif (ITAM), tyrosine residues of which are phosphorylated upon receptor engagement in an early and obligatory event in the signaling cascade. Despite the proximity to the cell membrane and crucial role in transmembrane signal transduction, little is known about the structure and lipid-binding activity of the ITAM-containing cytoplasmic domains. Here we investigate the conformation and lipid-binding activity of several MIRR cytoplasmic domains, namely T cell receptor ζcyt, CD3εcyt, CD3δcyt, and CD3γcyt, B cell receptor Igαcyt and Igβcyt, and Fc receptor FcεRIγcyt, using purified recombinant proteins. Secondary structure prediction analysis and experimental circular dichroism spectra identify each of these cytoplasmic domains as natively unfolded proteins. We also report that ζcyt, CD3εcyt, and FcεRIγcyt bind to acidic and mixed phospholipid vesicles and that the binding strength correlates with the protein net charge and the presence of clustered basic amino acid residues. Circular dichroism analysis reveals the lack of secondary structure for these domains in lipid-bound form. Phosphorylation of ζcyt and FcεRIγcyt does not alter their random-coil conformation but weakens binding to membranes. The implications of these results for transmembrane signal transduction by immune receptors are discussed.
Immune cells respond to the presence of foreign antigens with a wide range of responses. Antigen recognition by immune cells resulting in the initiation of these responses is mediated by the interaction of membrane-bound receptors with soluble, particulate, and cellular antigens. The family of antigen receptors named multichain immune recognition receptors (MIRRs) (1) shares common structural and functional features, including multiple subunits with extracellular ligand-binding domains and intracellular signaling domains carried on separate protein chains. Members of the MIRR family include the T cell receptor (TCR), the B cell receptor (BCR), and the high-affinity IgE receptor (FcεRI) expressed by mast cells and basophils. A common feature of the members of the MIRR family is the presence of one or more copies of the immunoreceptor tyrosine-based activation motif (ITAM) (2) composed of conserved sequences of amino acids that contain two appropriately spaced tyrosines (YxxL/Ix6-8YxxL/I; where x denotes nonconserved residues). These tyrosines are phosphorylated upon receptor engagement in an early and obligatory event in the signaling cascade. However, despite the proximity to the cell membrane and crucial role in transmembrane signal transduction, little is known about structure and lipid-binding activity of the ITAM-containing cytoplasmic domains. We have shown previously that these proteins are oligomeric and, at the same time, tend to be unfolded in solution (3).
Recently, it has been suggested that protein phosphorylation predominantly occurs within intrinsically disordered protein regions (4). The intrinsically disordered proteins represent a new class of proteins that lack a folded structure under physiological conditions and that exist in the ensemble of conformations. They are also referred to as “natively unfolded” (5) or “intrinsically unstructured” (6). Despite the fact that the existence of unstructured proteins has been recognized for many years, the functional role of intrinsically disordered proteins in crucial areas such as transcriptional regulation, translation and cellular signal transduction has only recently been reported due to progress in biochemical methodology (4). The lack of folded structure in signaling proteins might give these proteins a functional advantage over globular proteins with well-defined secondary and tertiary structure: the ability to bind to multiple different targets without sacrificing specificity and to provide the ability to overcome steric restrictions, thus enabling larger surface interactions.
In this study, using circular dichroism (CD) spectroscopy, we demonstrated that the cytoplasmic domains of MIRR signaling subunits, namely TCR ζ, CD3ε, CD3δ, and CD3γ, BCR Igα and Igβ, and FcεRI γ chain are intrinsically unstructured in both monomeric and oligomeric states. We also compared the experimental results with a number of bioinformatics methods used to predict secondary structure and localize disordered domains, and found good agreement between computational predictions and the data obtained. A lipid-binding assay employing sucrose-loaded large unilamellar vesicles (LUV) (7) was used to measure the partitioning of the ITAM-containing proteins onto phospholipid vesicles containing 100, 50 and 0% acidic lipid and to evaluate the effect of phosphorylation on the binding of ζcyt and FcεRIγcyt. The assay revealed that ζcyt, CD3εcyt, and FcεRIγcyt bind to acidic and mixed phospholipid vesicles and that the binding strength correlates with the protein net charge and the presence of clustered basic amino acid residues. Circular dichroism analysis shows the lack of secondary structure for these domains in lipid-bound form. Phosphorylation of ζcyt and FcεRIγcyt does not alter their random-coil conformation but decreases their binding to membranes.
MATERIALS AND METHODS
Reagents
Bovine thrombin (cat.#154163, 2430 u/mg) was purchased from ICN Biomedicals (Costa Mesa, CA). Dithiothreitol and glucose were purchased from Sigma Chemical Company (St. Louis, MO). Ni-NTA agarose was procured from Qiagen (Valencia, CA). The zwitterionic lipid 1-palmitoyl-2-oleoyl-sn-glycero-3-phosphocholine (POPC) and the acidic lipid 1-palmitoyl-2-oleoyl-sn-glycero-3-phosphoglycerol (POPG) were purchased from Avanti Polar Lipids (Alabaster, AL). All other chemicals used were of high quality analytical grade. All solutions were made in Milli-Q water.
Cloning, Expression and Purification
Cytoplasmic domains of the human ITAM-containing proteins (CD3ε, 57 AA, P07766, SwissProt; CD3δ, 46 AA, P04234; CD3γ, 46, P09693; TCRζ, 115 AA, P20963; FcεRIγ, 44 AA, P30273; Igα, 63 AA, P11912, and Igβ, 51 AA, P40259) were cloned, expressed and purified as described previously (3). Briefly, the relevant cDNAs were cloned into the pET32a(+) vector (Novagen) downstream of the thioredoxin (Trx) and His6 tag coding sequences. The original enterokinase site, which has proven to be inadequate for this application, has been replaced by a thrombin site in all of the proteins. The constructs were designed so that after cleavage, the recombinant proteins each begin with Gly-Ser followed by the native sequence. The expression plasmids were transformed into the BL21(DE3) strain of E. coli.
The following general procedure was used for protein expression and purification. A single colony was inoculated into 100 mL of LB broth containing 50 μg/mL ampicillin and grown at 37°C for 16 h. The cells were inoculated into 1 L of LB medium containing 50 μg/mL ampicillin, grown to an OD600 value of 0.9-1.2 and induced with 0.4 mM isopropyl β-d-thiogalactopyranoside. After 3 h, the cells were harvested and the pellet was resuspended in 100 mL of the lysis buffer (10 mM Tris, 100 mM NaH2PO4, pH 8.0) containing 8 M urea. The cell suspension was stirred at 4°C for 16 h. It was then centrifuged at 6500g for 15 min, and the supernatant was directly loaded onto a Ni-NTA agarose column pre-equilibrated with the same buffer. The column was washed with the lysis buffer (pH 8.0) and the protein eluted using the same buffer with gradual pH reduction according to the manufacturer’s instructions. The fractions containing the target fusion protein were pooled, subjected to dialysis against 14 liters of 20 mM HEPES (pH 7.5) containing 150 mM NaCl and 0.1 mM DTT for 16 h at 4°C with two changes, and centrifuged at 6500g for 15 min. The protein was digested at 25°C for 1 h in the presence of 1 mM DTT and 5 mM CaCl2 with 6 units of thrombin/mg of protein. The digest was quenched by addition of PMSF to a final concentration of 0.1 mg/mL and diluted two-fold with 0.1% TFA. Reverse-phase HPLC purification was performed on a C18 Vydac 22 × 250 mm preparative column (Vydac, Hesperia, CA) with a linear acetonitrile gradient (0-72%) in 0.1% TFA (12 ml/min). The fractions containing the target protein were identified by Tricine SDS-PAGE (12.5%), pooled and lyophilized. For ζcyt protein purification, an additional ion-exchange chromatographic step was added to the general purification scheme as described previously (3).
The purity of the proteins that were obtained was evaluated using SDS-PAGE followed by Coomassie-staining and was found to be greater than 98% (3). The purity and identity of the proteins obtained were also confirmed by analytical RP-HPLC, ES-MS, and N-terminal sequencing.
Analysis of Protein Phosphorylation
Phosphorylation of ζcyt and FcεRIγcyt in a final protein concentration of 0.01 or 0.2 mM was performed at 37°C using a recombinant protein tyrosine kinase src(86-536) (0.2 μM) in 20 mM HEPES (pH 7.5) containing 150 mM NaCl, 2 mM MgATP, 10 mM MgCl2, and 50 μM Na3VO4 as described previously (3). The extent of phosphorylation in phospho-ζcyt (four and six moles of phosphate per mole of protein, respectively) and phospho-FcεRIγcyt (one and two moles of phosphate per mole of protein, respectively) was determined by MALDI-MS of the relevant protein species purified using reverse-phase HPLC. Purified, completely phosphorylated ζcyt and FcεRIγcyt (six and two moles of phosphate per mole of protein, respectively) were used for further experiments.
Sucrose-Loaded Vesicle Binding Assay
Sucrose-loaded POPG and POPG/POPC (1:1, molar ratio) large unilamellar vesicles (LUVs) were prepared as described by Buser et al. (7). Briefly, the corresponding lipid or lipid mixtures in CHCl3 were evaporated under argon and then vacuum-dried for 3 h at 20°C. The dried lipid was resuspended in 176 mM sucrose and 1 mM MOPS at pH 7.0; the air was displaced with argon. LUVs were made after five freeze-thaw cycles by extruding multilamellar vesicles 10 times through a stack of two polycarbonate filters (100-nm pore diameter) in an Avanti mini-extruder (Avanti Polar Lipids, Alabaster, AL). The vesicle solution was diluted 5 times with 1 mM MOPS buffer, pH 7.0, containing 0.1 M KCl and osmotic to the internal sucrose buffer, and centrifuged at 100000g for 1 h at 25°C using a table-top Beckman TL-100 ultracentrifuge equipped with a TLA-45 rotor. The supernatant was removed, and the lipid pellet was resuspended in the same buffer solution. The final concentration of the vesicle solution was determined using a phosphorous assay (8).
In the membrane-binding assay, protein in a final concentration of 10 μM was mixed with the sucrose-loaded LUV; [protein] ≪ [lipid] so that the protein did not bind a significant fraction of the acidic lipid. After 15 min of equilibration at room temperature (20°C), vesicle-bound protein was separated by centrifugation (for 1 h at 100000g and 25°C). Ninety percent of the supernatant and pellet was evaluated for protein content using a fluorescamine assay (7). The percentage of the protein bound at a given lipid concentration was calculated and corrected for the 1-3% lipid that remained in the supernatant.
Dynamic Light Scattering
Scattering data were collected at 20°C with a DynaPro-MS800 instrument (Protein Solutions, Charlottesville, VA). Free and protein-bound vesicle solutions were filtered with 0.22 μm Millex filters prior to measurements. During the illumination, the photons scattered by vesicles were collected at 90° on 1-5 s acquisition times (depending on protein concentration). Translational diffusion coefficients (D) were determined from scattering data with the DYNAMICS autocorrelation analysis software (version 5.25.44, Protein Solutions). D was converted to a hydrodynamics radius Rh through the Stokes-Einstein equation (Rh = kT/6πηD, where η is the solvent viscosity, k is the Boltzmann’s constant and T is the temperature).
Circular Dichroism Measurements
Far-UV CD spectra were recorded on an Aviv 202 spectropolarimeter (AVIV Instruments, Lakewood, NJ) with 0.01 and 1.0 mM protein in PBS (pH 7.0) in 1.0 and 0.01 mm path-length cells, respectively. Data were collected at 25°C every nanometer from 260 to 190 nm with 1.0 s averaging per point and a 1 nm bandwidth. The CD spectra of at least six scans were signal averaged, baseline corrected by subtracting an averaged buffer spectrum, and normalized to molar residue ellipticity.
Mass Spectrometry
Protein samples were applied to a MALDI target in 50% ACN/0.1% TFA/matrix (α-cyano-4-hydroxy-cinnamic acid)/water and the molecular masses were determined using a Voyager Elite STR (Perseptive Biosystems, Cambridge, MA) mass spectrometer. ES-MS was performed at the Department of Chemistry Instrumentation Facility (Massachusetts Institute of Technology, Cambridge, MA) using a Bruker Daltonics APEX II 3 Tesla Fourier transform mass spectrometer supplied with an electrospray ionization source (Bruker Daltonics, Inc., Billerica, MA).
Partition Coefficient Calculation
In order to describe the partitioning of cytoplasmic domains of the human ITAM-containing proteins onto phospholipid membranes, we used a molar partition coefficient, K (M-1), which is the proportionality factor between the mole fraction of protein bound to phospholipid vesicle membrane, and the molar concentration of protein free in the bulk aqueous phase, as described previously by Buser and colleagues (7). The percent of protein bound to lipid for varying lipid concentration, where [L] ≫ [P]m, was fit to the following equation with an iterative non-linear least squares curve fit using Kaleidagraph 3.5 (Synergy Software, PA):
where [L] is the concentration of lipid and m is the maximal percent bound. [P]m is the concentration of liposome-bound protein. For partitioning of CD3εcyt onto POPG vesicles, the observed concentration dependence was steeper than that described by the equations used, and the partition coefficient values obtained should be considered an estimate.
Sequence Analysis, Secondary Structure, and Disorder Prediction
The amino acid sequences of the cytoplasmic domains of T cell receptor subunits CD3ε, CD3δ, CD3γ and ζ, B cell receptor subunits Igα and Igβ, and Fcε receptor γ subunit are shown in Figure 1.
Figure 1.

Amino acid sequences of cytoplasmic domains of ζ, CD3ε, FcεRIγ, CD3δ, CD3γ, Igα and Igβ. The sequence positions with negatively charged amino acid residues are shown by “-”, and the positions with positively charged amino acid residues are shown by “+”. ITAM domains are underlined. ITAM Tyr residues are indicated in bold.
By using the Swiss Institute of Bioinformatics (SIB) server ExPASy (9) the following information was extracted for each individual protein: (1) number of amino acid residues, (2) molecular mass, (3) total number of negatively (Asp + Glu) and positively charged (Arg + Lys) residues, and (4) theoretical pI value. The protein net charge was calculated as the difference between the numbers of positively and negatively charged residues at pH 7.0.
Secondary structure was predicted using the hierarchical neural network algorithm (10), and the PHD and PSIPRED v2.3 prediction programs (11, 12).
Predictions of intrinsic disorder in the proteins studied were performed using PONDR® VL3 predictor, charge-hydropathy plot, and cumulative distribution function (CDF) analysis access to which was provided by Molecular Kinetics, Inc. (http://www.pondr.com). PONDR® VL3 combines the predictions of 30 neural networks for the entire protein sequence. This predictor was trained using disordered regions from more than 150 proteins characterized by NMR, X-ray crystallography, circular dichroism, limited proteolysis and other physical approaches (13). Charge-hydropathy (CH) plot analysis is another established method of order-disorder classification (14). Disordered (natively unfolded) proteins are generally characterized by a combination of high net charge and low hydropathy, and therefore are clustered above the boundary. In contrast, ordered proteins are generally clustered below the boundary, being characterized by lower net charge and higher hydropathy (14). The CDF analysis separates ordered and disordered sequences based on the per-residue disorder score retrieved by PONDR® VLXT, and the optimal boundary (10): the CDF curves for ordered proteins are located above the boundary, whereas the CDF curves of disordered proteins are located below the boundary.
Numerically, disorder prediction was performed according to the algorithm of Uversky et al. (14). Briefly, the mean hydrophobicity, <H>, was calculated as the sum of all residue hydrophobicities, divided by the total number of residues, using the Kyte/Doolittle scale (15), rescaled to a range of 0-1 (14). The boundary <H> value, <H>b, was calculated using the Uversky equation <H>b = (|<R>| + 1.151)/2.785, where |<R>| is the mean net charge defined as the absolute value of the difference between the numbers of positively and negatively charged residues at pH 7.0, divided by the total residue number (14). The positive difference between <H>b and the mean hydrophobicity, <H>, calculated by the Kyte and Doolittle approximation (15) by using a window size of 5 amino acids, was used as an indicator of protein unfoldedness.
RESULTS
Cytoplasmic Domains of ITAM-Containing Proteins are Unstructured, Random-Coil Proteins in Both Monomeric and Oligomeric States
Bioinformatics methods and subsequent verification by experimental data were applied to the structural investigation of the cytoplasmic domains of TCR CD3ε, CD3δ, CD3γ and ζ, BCR Igα and Igβ, and FcεRI γ subunit. Two complementary methods were used to analyze the sequences of the cytoplasmic domains: prediction of ordered/disordered protein regions, and prediction of secondary structure elements. As predicted using the algorithm of Uversky et al. (14) and the hierarchical neural network algorithm (10), the proteins of interest can be classified as intrinsically unstructured, or natively unfolded, proteins (Table 1). Lack of considerable secondary structure was also observed using the PHD (11) and PSIPRED v2.3 (12) prediction programs (data not shown).
Table 1.
Summary of Disordera and Secondary Structureb Predictions for Cytoplasmic Domains of MIRR Signaling Subunits
| protein | ζcyt | CD3εcyt | CD3δcyt | CD3γcyt | Igαcyt | Igβcyt | FcεRIγcyt |
|---|---|---|---|---|---|---|---|
| net chargec | +5 | +11 | 0 | 0 | -9 | -10 | +3 |
| |<R>|d | 0.0435 | 0.1930 | 0.0000 | 0.0000 | 0.1429 | 0.1961 | 0.0682 |
| <H>be | 0.4289 | 0.4826 | 0.4133 | 0.4133 | 0.4646 | 0.4837 | 0.4378 |
| <H>f | 0.3489 | 0.3148 | 0.3742 | 0.3171 | 0.3892 | 0.3861 | 0.3797 |
| <H>b - <H>g | 0.0800 | 0.1678 | 0.0391 | 0.0962 | 0.0754 | 0.0976 | 0.0581 |
| Results of Secondary Structure Predictionh,i | |||||||
|---|---|---|---|---|---|---|---|
| Alpha helix | 40.87 | 14.04 | 19.57 | 2.17 | 22.22 | 0 | 25.00 |
| Extended strand | 5.22 | 0 | 0 | 0 | 0 | 21.57 | 18.18 |
| Random coil | 53.91 | 85.96 | 80.43 | 97.83 | 77.78 | 78.43 | 56.82 |
Using the algorithm of Uversky et al. (14).
Using the hierarchical neural network algorithm (10).
Using the Swiss Institute of Bioinformatics (SIB) server ExPASy (9).
The mean net charge, defined by Uversky et al. (14) as the absolute value of the difference between the numbers of positively and negatively charged residues at pH 7.0, divided by the total residue number.
The boundary <H> value, calculated using the Uversky equation <H>b = (|<R>| + 1.151)/2.785.
The mean hydrophobicity, defined using the Kyte/Doolittle scale (15), as the sum of all residue hydrophobicities, divided by the total number of residues and rescaled to a range of 0-1.
The positive difference between <H>b and <H> indicates that a protein is unfolded.
The values are indicated in %.
No significant fraction was predicted for 310 helix, Pi helix, beta bridge, beta turn, bend region, ambiguous and other states.
Figure 2 represents results of the intrinsic disorder estimation in the cytoplasmic domains of TCR ζ, CD3ε, CD3δ, and CD3γ, BCR Igα and Igβ, and FcεRI γ subunit using two binary classifiers, CH-plot (Figure 2A) and CDF analysis (Figure 2B), and PONDR® VL3 (Figure 2C). According to the CH-plot analysis (Figure 2A), all ITAM-containing cytoplasmic domains studied are predicted to be natively unfolded, as all of them are located above the boundary. This means that these domains likely possess highly expanded conformations. Figure 2B shows that curves corresponding to four domains, TCR ζ, CD3ε, CD3δ, and BCR Igβ are located well below the boundary, whereas CD3γ, BCR Igα and FcεRI γ subunit curves closely follow the boundary. Thus, CDF analysis predicts that TCR ζ, CD3ε, CD3δ, and BCR Igβ are mostly disordered, whereas CDF analysis predicts that CD3γ, BCR Igα and FcεRI γ subunit potentially contain more order. Figure 2C represents PONDR® VL3 curves for all ITAM-containing cytoplasmic domains analyzed in this study. The profiles of disorder distribution suggest that all these proteins are essentially disordered, as the vast majority of their PONDR curves are located above the 0.5 threshold. Overall, there is a good correlation between the results of binary classifiers (CH-plot and CDF analysis) and PONDR® VL3 predictor. In fact all of these algorithms indicate that the cytoplasmic domains of TCR ζ, CD3ε, CD3δ, and CD3γ, BCR Igα and Igβ, and FcεRI γ subunit are mostly disordered. It should be noted that all of these analyses assume that the predicted cytoplasmic regions can be considered separately from the adjacent predicted transmembrane regions.
Figure 2.
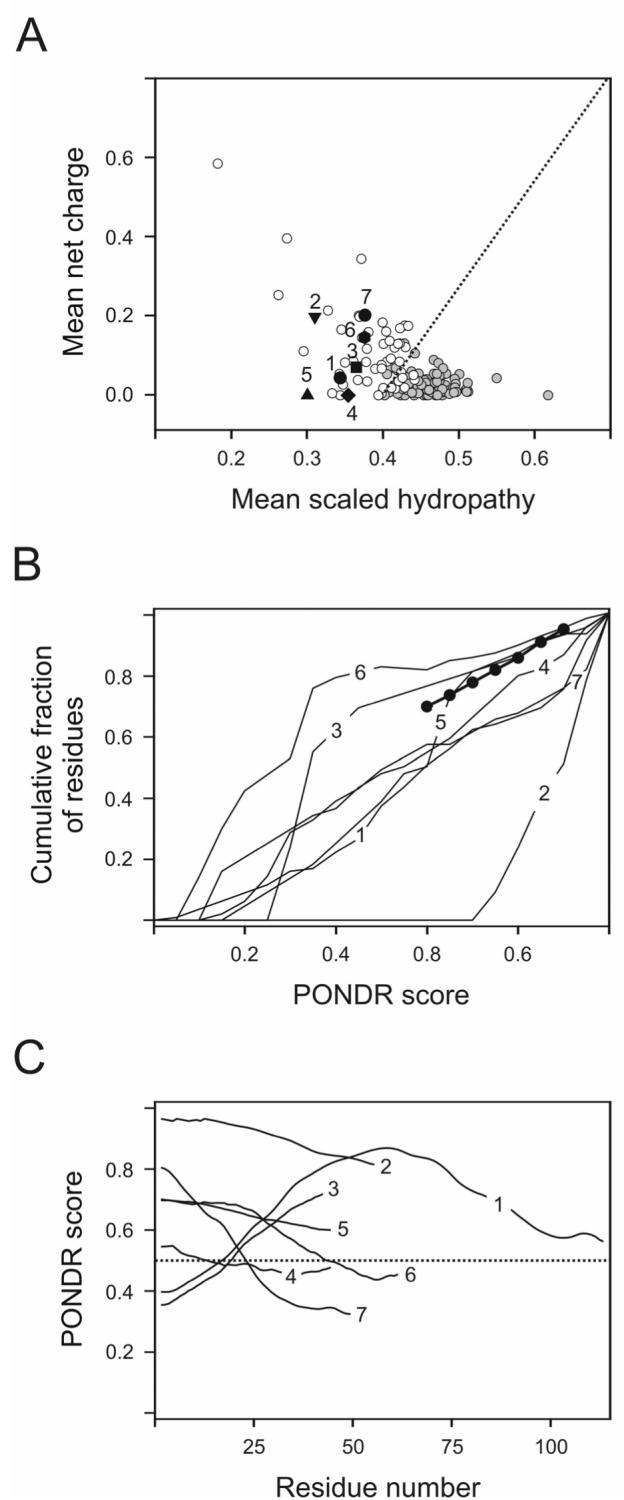
Analysis of intrinsic disorder distribution in cytoplasmic domains of ζ (1), CD3ε (2), FcεRIγ (3), CD3δ (4), CD3γ (5), Igα (6) and Igβ (7). A. Charge-hydropathy (CH) plot analysis. Data for individual proteins (symbols with numbers) are compared with set of natively unfolded (white circles) and natively folded proteins (gray circles). Black dotted line corresponds to the boundary separating compact and natively unfolded proteins. B. Cumulative distribution function (CDF) analysis. Boundary separating intrinsically disordered and ordered proteins is shown as a bold line with circles. This method separates ordered and disordered sequences based on the per-residue disorder score estimated by PONDR® VLXT, and the optimal boundary: the CDF curves for ordered proteins are located above the boundary, whereas the CDF curves of disordered proteins are located below the boundary. C. PONDR® VL3 data. A protein is predicted to be disordered if the majority of its PONDR® VL3 curve is located above the 0.5 line (black dotted line).
The experimental CD data are consistent with the output of the different algorithms used for the disorder and secondary structure predictions. The far-ultraviolet CD spectra were taken at 5 μM and 1 mM concentrations. We have previously shown for each of the ITAM-containing proteins studied here that at 5 μM and 1 mM concentrations these proteins are mostly monomeric and dimeric, respectively (3). CD analysis of CD3εcyt, CD3δcyt, CD3γcyt, FcεRIγcyt, Igαcyt, and Igβcyt shows the characteristics of intrinsically unstructured proteins at both concentrations (Figure 3). For ζcyt and FcεRIγcyt, no changes were observed in the CD spectra when the proteins were completely phosphorylated (Figure 3). Considering that the CD spectra for both protein concentrations are very similar, it can be concluded that oligomerization does not induce any secondary or tertiary structure formation. Thus, intermolecular interactions in protein dimers represent specific interactions between unstructured, random coiled molecules. Interestingly, for ζcyt, the percent of α-helicity was estimated to be approximately 40% (Table 1) while the CD spectra taken at low and high protein concentrations do not reveal any detectable secondary structure. It is possible that this predicted helical conformation can be experimentally induced by actions of the specific agents promoting helix formation such as trifluoroethanol (TFE), detergents or lipids. Indeed, helical conformation of ζcyt has been shown to be induced by TFE (16) and lipid-modeling agents (17).
Figure 3.
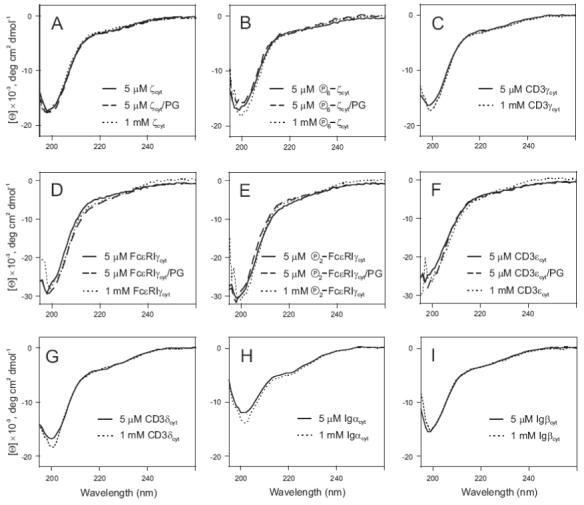
The far-ultraviolet CD spectra of cytoplasmic domains of ζ (A), CD3γ (C), FcεRIγ (D), CD3ε (F), CD3δ (G), Igα (H) and Igβ (I). The spectra of fully phosphorylated proteins, ζcyt and FcεRIγcyt, are also indicated (B and E, respectively). The mean residue ellipticity is plotted as a function of wavelength for low (5 μM, solid line) and high (1 mM, dotted line) protein concentrations in PBS (pH 7.0) in 1.0 and 0.01 mm path-length cells, respectively. CD spectra of ζcyt (A), FcεRIγcyt (D), CD3εcyt (F) as well as fully phosphorylated ζcyt (B) and FcεRIγcyt (E) in the presence of large unilamellar phospholipid vesicles formed from POPG (indicated as PG) are shown by broken lines.
Thus, the protein structure prediction results in conjunction with the experimental data presented indicate that the cytoplasmic domains of the ITAM-containing proteins studied are intrinsically unstructured proteins, further supporting the hypothesis that intrinsically unstructured protein domains play an important role in protein phosphorylation and signal transduction (4).
Cytoplasmic Domains of T Cell Receptor ζ, CD3ε, and FcεRIγ Subunits Bind to Acidic and Mixed Phospholipid Vesicles
A sucrose-loaded vesicle-binding sedimentation assay (7) is widely used to measure the membrane binding of proteins and peptides. LUVs containing acidic (POPG), neutral (POPC), or mixed POPG/POPC (1:1, molar ratio) phospholipids were used as model membranes in our experiments to characterize lipid-binding activity of the ITAM-containing proteins. Importantly, dynamic light scattering (DLS) measurements did not reveal any changes in vesicle size distribution before and after experiments (data not shown), suggesting that protein binding does not disturb the lipid bilayer structure in the LUVs used and does not cause vesicle fusion.
Figure 4 illustrates the partitioning of the proteins studied onto phospholipid LUVs containing 0, 50, and 100 mole percent of acidic lipid in 100 mM KCl. The values of K determined by the fitting the data in Figure 4 are shown in Table 2. Cytoplasmic domains of CD3γ (net charge of 0), CD3δ (net charge of 0), Igα (net charge of -9) and Igβ (net charge of -10) did not bind to phospholipid vesicles at any of the compositions tested (data not shown). For ζcyt and FcεRIγcyt, increasing the mole percent of acidic lipid from 50 to 100% increases K approximately 40- and 12-fold, respectively, and phosphorylation does not alter this dependence. This steep dependence of binding on the mole percent of acidic lipid is characteristic of multivalent basic proteins/peptides (18, 19). In addition, phosphorylation of these proteins results in approximately 40- and 5-fold decreases in the partition coefficient for ζcyt and FcεRIγcyt, respectively, and these values are similar for both acidic and mixed phospholipid vesicles (Table 2).
Figure 4.
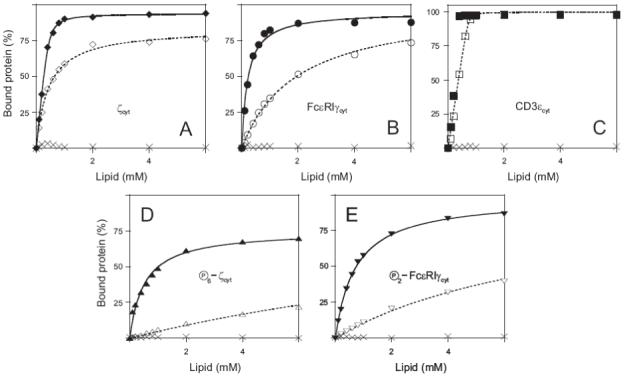
The membrane binding of the MIRR cytoplasmic domains. (A-E) Partitioning of ζcyt (A), FcεRIγcyt (B), CD3εcyt (C) as well as fully phosphorylated ζcyt (D) and FcεRIγcyt (E) onto large (100 nm diameter) unilamellar phospholipid vesicles (LUV). The results were obtained with a sucrose-loaded vesicle assay using LUV formed from POPG (A-E, filled symbols, solid lines) and 1:1 POPG/POPC (A-E, empty symbols, dotted lines), and POPC (A-E, crossings) in 100 mM KCl buffered to pH 7.0 with 1 mM MOPS. Each plotted point is the average of at least two samples at that total lipid concentration; the errors associated with the points are <10%. The solid and dotted lines correspond to theoretical binding curves that were obtained as described under Materials and Methods. Cytoplasmic domains of CD3γ (net charge of 0), CD3δ (net charge of 0), Igα (net charge of -9) and Igβ (net charge of -10) did not bind to phospholipid vesicles of any of the compositions tested (data not shown).
Table 2.
Membrane Partitioning of Cytoplasmic Domains of MIRR Signaling Subunitsa
| partition coefficient K, M-1 |
change in Kc phospho/non-phospho | |||
|---|---|---|---|---|
| Protein | net chargeb | POPG | 1:1 POPG/POPC | |
| ζcyt | +5 | 84000 | 2200 | |
| phospho-ζcytd | -5.5e | 2000 | 50 | ∼ 1/40 |
| FcεRIγcyt | +3 | 7000 | 510 | |
| phospho-FcεRIγcytd | -0.5e | 1400 | 110 | ∼ 1/5 |
| CD3εcyt | +11 | ∼ 6 × 10⁷ f | ∼ 5 × 10⁵ | - |
No lipid binding was observed for CD3δcyt, CD3γcyt, Igαcyt, and Igβcyt.
Using the Swiss Institute of Bioinformatics (SIB) server ExPASy (9).
Change in membrane partitioning for fully phosphorylated proteins relatively to non- phosphorylated proteins.
6 and 2 mol of phosphate/mol of protein for phospho-ζcyt and phospho-FcεRIγcyt, respectively.
Assuming pKs near 1.2 and 6.5 for phosphotyrosine phosphate group.
Estimated value.
Using the Swiss Institute of Bioinformatics (SIB) server ExPASy (9), we calculated the net protein charge for the ITAM-containing proteins studied (Tables 1 and 2). For phosphorylated ζcyt and FcεRIγcyt, net charges were estimated assuming pKs near 1.2 and 6.5 for phosphotyrosine phosphate group (20). Figure 5 shows the molar partition coefficients determined from the experimental measurements of the binding of the ITAM-containing proteins to mixed (open symbols) and acidic (filled symbols) phospholipid vesicles as a function of net protein charge. For ζcyt, FcεRIγcyt, and CD3εcyt, the data obtained show strong dependence of the partitioning of these proteins onto acidic and mixed phospholipid vesicles on net protein charge, with extremely tight binding for CD3ε (net charge of +11).
Figure 5.
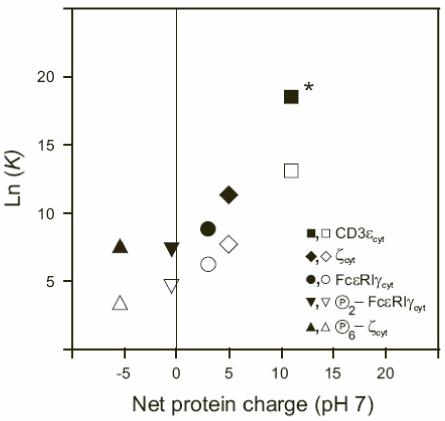
The membrane binding of the cytoplasmic domains increases as the net charge of the protein increases. The filled and empty symbols are the logarithmic values of the molar partition coefficients K (M-1) determined from experimental measurements of the binding of ζcyt (net charge of +5), FcεRIγcyt (net charge of +3), CD3εcyt (net charge of +11) as well as fully phosphorylated ζcyt (net charge of -5.5) and FcεRIγcyt (net charge of -0.5) to POPG (filled symbols) and 1:1 POPG/POPC (empty symbols) LUV in 1 mM MOPS, 100 mM KCl, pH 7.0. * Estimated from the curve fit.
Phosphorylation of two and six ITAM Tyr residues in FcεRIγcyt and ζcyt, respectively, reduces the corresponding net charges of the proteins from +3 to -0.5 for FcεRIγcyt and from +5 to -5.5 for ζcyt (Table 2). Considering that CD3δcyt, CD3γcyt, Igαcyt and Igβcyt with net charges of 0, 0, -9 and -10, respectively, (Table 1) do not bind to acidic and mixed phospholipid vesicles, it could be expected that phosphorylated FcεRIγcyt and ζcyt also would not show lipid activity. The phosphorylation-induced net charge reduction results in reduction but not abrogation of the interaction of the phosphorylated proteins with acidic phospholipid bilayers (Table 2 and Figure 3). Analysis of primary amino acid sequences shows the existence of clusters of basic residues in both FcεRIγcyt and ζcyt (Figure 1). We suggest that binding to acidic phospholipids is not simply dependent on the overall net charge but can also involve clustered basic amino acids.
Previously, ζcyt has been reported to adopt helical conformation in the presence of TFE (16), micelles of lysomyristoylphosphatidylglycerol (LMPG) (17) and small unilamellar vesicles (SUVs) of dimyristoylphosphatidylglycerol (DMPG) (17). We investigated whether binding to acidic phospholipid LUVs induced helical structure formation in the ITAM-containing proteins studied here. For POPG LUV-bound CD3εcyt, ζcyt, and FcεRIγcyt as well as fully phosphorylated ζcyt and FcεRIγcyt, analysis of the CD spectra revealed the lack of induction of any detectable secondary structure (Figure 3, panels A, B, D-F). These data indicate that lipid binding can occur in the absence of helical structure induction, and that the nature of lipid-protein interactions and the protein regions involved in lipid binding can be different for micelles and various lipid vesicles.
Thus, cytoplasmic domains of ζ, CD3ε and FcεRIγ bind to vesicles containing acidic phospholipids, and this binding depends on several parameters such as the mole percent of acidic lipid, net protein charge, and the presence of clustered basic amino acid residues in primary sequence.
DISCUSSION
ITAM-containing cytoplasmic domains of MIRR signaling subunits play a crucial role in transducing transmembrane activation signals, and phosphorylation of tyrosines within the ITAM upon receptor engagement represents an early and obligatory step in initiating the signaling cascade (21). Recently, it has been suggested that phosphorylation commonly occurs within intrinsically disordered protein regions (4), and our findings further support this hypothesis. On the other hand, the ITAM-containing cytoplasmic domains are in close proximity to the cell membrane, and lipid-binding activity of these proteins could also be involved in signal transduction.
In earlier studies, we showed that ζcyt and several other ITAM-containing cytoplasmic domains are oligomeric in solution and, at the same time, tend to be intrinsically unstructured (3). Based on these results, we suggested an important role for homooligomerization of the cytoplasmic domains of MIRR signaling subunits in transmembrane signal transduction (22, 23), and hypothesized a role of the lipid-binding activity of ζcyt in TCR-mediated signaling (17). In the present studies, we focused on detailed comparative characterization of the conformations of ITAM-containing proteins in both monomeric and oligomeric states. Using a well-defined lipid bilayer system of phospholipid LUVs, we studied the lipid-binding activities of these proteins and their specificities.
From computational secondary structure and disorder prediction analysis, we found that the cytoplasmic domains of ζ and other ITAM-containing proteins can be classified as intrinsically unstructured proteins (Figure 2 and Table 1). The theoretical predictions agreed with the experiments. Our CD measurements indicated that all of cytoplasmic domains studied were unstructured in solution and, more specifically, in both monomeric and oligomeric states (Figure 3). Importantly, homooligomerization of ζcyt and other ITAM-containing proteins does not induce any detectable secondary structure formation, suggesting the existence of specific interactions between unfolded protein molecules. In addition, phosphorylation of tyrosines in the ITAM domains of FcεRIγcyt and ζcyt, also did not change the random coil-like conformation observed. These results suggest that phosphorylation sites are easily accessible on unfolded cytoplasmic domains of MIRR-signaling subunits in both monomeric and oligomeric states. Interestingly, for ζcyt, the results of secondary structure prediction show approximately 40% α-helicity while CD analysis reveals the lack of secondary structure of this protein. The reason for this discrepancy is unknown. However, it can be suggested that the potential α-helicity might be induced by specific agents. Indeed, it has been previously reported that the agents promoting helix formation such as TFE (16), LMPG (17) or DMPG (17) induce partly helical conformation in ζcyt, and the percentage of α-helix represents approximately 35-40% (17).
The amino acid sequences of ζcyt, CD3εcyt and FcεRIγcyt show the presence of clusters of basic residues (Figure 1). These clusters have been shown to play an important role in membrane binding of peptides and proteins (18, 19, 24, 25). We have investigated the membrane binding of the cytoplasmic domains of ζ and other ITAM-containing proteins using acidic phospholipid LUVs composed of POPC and/or POPG with 0, 50, and 100 mole percent of POPG. According to DLS, protein binding does not alter vesicle size distribution, suggesting that the vesicles used do not fuse in the presence of the ITAM-containing proteins (data not shown). As expected, proteins with positive net charge such as ζcyt, CD3εcyt and FcεRIγcyt bind to acidic and mixed phospholipids while proteins with negative net charge such as CD3δcyt, CD3γcyt, Igαcyt and Igβcyt do not (Figure 4 and Table 2). The lipid-binding activity increases with increasing of net protein charge (Table 2 and Figure 4) and the mole percent of POPG (Table 2 and Figure 4). Fully phosphorylated ζcyt and FcεRIγcyt with net protein charges of -5.5 and -0.5, respectively, are still able to bind acidic phospholipids (Table 2 and Figures 4 and 5). For these proteins, the partitioning of these proteins onto acidic phospholipid LUVs might be driven by the clusters of basic amino acid residues rather than the overall net charge. The human immunodeficiency virus type 1 Nef protein has been reported to bind to the cell membrane despite its net charge of -9.0 (25). In this case as well as others, a cluster of positively charged residues has been shown to play a critical role in membrane association (25,26). The presence of such clusters, however, is not sufficient for lipid binding, as Igαcyt which has a cluster of 3 amino acids but a net charge of -9.0 does not bind to acidic phospholipid vesicles.
Surprisingly, in this study we found that binding of CD3εcyt, ζcyt, phospho-ζcyt, FcεRIγcyt and phospho-FcεRIγcyt, to acidic phospholipid LUVs is not accompanied by induction of any detectable secondary structure (Figure 3). These results are contradictory to previously reported helical structure formation of ζcyt in the presence of TFE (16) and LMPG micelles and DMPG SUVs (17), possibly suggesting different modes of interactions of the proteins of interest with micelles, SUVs and LUVs. In this study, we use POPG LUVs, which would be expected to be a better model to mimic the cell membrane than micelles or SUVs. Our further studies are in progress to shed light upon this unexpected phenomenon.
In summary, our data suggest that the ITAM-containing receptor signaling subunits possess interesting structural and functional features. First, their cytoplasmic domains are intrinsically disordered in both monomeric and oligomeric states, thus providing the molecular basis for reversibility of phosphorylation and suggesting the existence of specific interactions between unfolded protein molecules. Second, the cytoplasmic domains of ζ, CD3ε and FcεRIγ exhibit significant lipid-binding activity towards acidic phospholipids, suggesting a potential physiological role of the interaction of these domains with the membrane in transmembrane signaling and cell activation. Further biochemical and biophysical studies are needed to characterize the nature of the molecular mechanisms involved in homointeractions of these protein domains and their binding to the membrane. We are currently investigating these possibilities.
ABBREVIATIONS
- BCR
B cell receptor
- CD
circular dichroism
- DTT
1,4-dithiothreitol
- ES-MS
electrospray mass spectrometry
- GF
gel filtration
- ITAM
immunoreceptor tyrosine-based activation motif
- LUV
large unilamellar vesicles
- MALDI-MS
matrix assisted laser desorption ionization mass spectrometry
- MHC
major histocompatibility complex
- MOPS
3-(N-morpholino)propanesulfonic acid
- PBS
phosphate buffered saline (1 mM KH2PO4, 10 mM Na2HPO4, 137 mM NaCl, 2.7 mM KCl)
- POPC (or PC)
1-Palmitoyl-2-Oleoyl-sn-Glycero-3-Phosphocholine
- POPG (or PG)
1-Palmitoyl-2-Oleoyl-sn-Glycero-3-[Phospho-rac-(1-glycerol)] (Sodium Salt)
- RP-HPLC
reverse-phase high-performance liquid chromatography
- SDS-PAGE
sodium dodecyl sulfate-polyacrylamide gel electrophoresis
- TCR
T cell receptor
- TFA
trifluoroacetic acid
Footnotes
This study was supported in part by the National Science Foundation (NSF; project MCB-0091072, to A.B.S., D.A.A., and L.J.S.) and by the NIH/NIAID, University of Massachusetts Center for AIDS Research (project P30 AI42845-08, to A.B.S.). The Programs of the Russian Academy of Sciences for the “Molecular and cellular biology” and “Fundamental science for medicine” provided partial support to V.N.U.
REFERENCES
- 1.Keegan AD, Paul WE. Multichain immune recognition receptors: similarities in structure and signaling pathways. Immunol. Today. 1992;13:63–68. doi: 10.1016/0167-5699(92)90136-U. [DOI] [PubMed] [Google Scholar]
- 2.Reth M. Antigen receptor tail clue. Nature. 1989;338:383–384. [PubMed] [Google Scholar]
- 3.Sigalov A, Aivazian D, Stern L. Homooligomerization of the Cytoplasmic Domain of the T Cell Receptor ζ Chain and of Other Proteins Containing the Immunoreceptor Tyrosine-Based Activation Motif. Biochemistry. 2004;43:2049–2061. doi: 10.1021/bi035900h. [DOI] [PubMed] [Google Scholar]
- 4.Iakoucheva LM, Radivojac P, Brown CJ, O’Connor TR, Sikes JG, Obradovic Z, Dunker AK. The importance of intrinsic disorder for protein phosphorylation. Nucleic Acids Res. 2004;32:1037–1049. doi: 10.1093/nar/gkh253. [DOI] [PMC free article] [PubMed] [Google Scholar]
- 5.Uversky VN. Natively unfolded proteins: a point where biology waits for physics. Protein Sci. 2002;11:739–756. doi: 10.1110/ps.4210102. [DOI] [PMC free article] [PubMed] [Google Scholar]
- 6.Dyson HJ, Wright PE. Intrinsically unstructured proteins and their functions. Nat. Rev. Mol. Cell. Biol. 2005;6:197–208. doi: 10.1038/nrm1589. [DOI] [PubMed] [Google Scholar]
- 7.Buser CA, Sigal CT, Resh MD, McLaughlin S. Membrane binding of myristylated peptides corresponding to the NH2 terminus of Src. Biochemistry. 1994;33:13093–13101. doi: 10.1021/bi00248a019. [DOI] [PubMed] [Google Scholar]
- 8.Van Veldhoven PP, Mannaerts GP. Inorganic and organic phosphate measurements in the nanomolar range. Anal. Biochem. 1987;161:45–48. doi: 10.1016/0003-2697(87)90649-x. [DOI] [PubMed] [Google Scholar]
- 9.Appel RD, Bairoch A, Hochstrasser DF. A new generation of information retrieval tools for biologists: the example of the ExPASyWWWserver. Trends Biochem. Sci. 1994;19:258–260. doi: 10.1016/0968-0004(94)90153-8. [DOI] [PubMed] [Google Scholar]
- 10.Oldfield CJ, Cheng Y, Cortese MS, Brown CJ, Uversky VN, Dunker AK. Comparing and combining predictors of mostly disordered proteins. Biochemistry. 2005;44:1989–2000. doi: 10.1021/bi047993o. [DOI] [PubMed] [Google Scholar]
- 11.Rost B, Sander C. Combining evolutionary information and neural networks to predict protein secondary structure. Proteins. 1994;19:55–72. doi: 10.1002/prot.340190108. [DOI] [PubMed] [Google Scholar]
- 12.Jones DT. Protein secondary structure prediction based on position-specific scoring matrices. J. Mol. Biol. 1999;292:195–202. doi: 10.1006/jmbi.1999.3091. [DOI] [PubMed] [Google Scholar]
- 13.Obradovic Z, Peng K, Vucetic S, Radivojac P, Brown CJ, Dunker AK. Predicting intrinsic disorder from amino acid sequence. Proteins. 2003;53:566–572. doi: 10.1002/prot.10532. [DOI] [PubMed] [Google Scholar]
- 14.Uversky VN, Gillespie JR, Fink AL. Why are ‘natively unfolded’ proteins unstructured under physiologic conditions? Proteins. 2000;41:415–427. doi: 10.1002/1097-0134(20001115)41:3<415::aid-prot130>3.0.co;2-7. [DOI] [PubMed] [Google Scholar]
- 15.Kyte J, Doolittle BF. A simple method for displaying the hydropathic character of a protein. J. Mol. Biol. 1982;157:105–132. doi: 10.1016/0022-2836(82)90515-0. [DOI] [PubMed] [Google Scholar]
- 16.Laczko I, Hollosi M, Vass E, Hegedus Z, Monostori E, Toth GK. Conformational effect of phosphorylation on T cell receptor/CD3 zeta-chain sequences. Biochem. Biophys. Res. Commun. 1998;242:474–479. doi: 10.1006/bbrc.1997.7989. [DOI] [PubMed] [Google Scholar]
- 17.Aivazian D, Stern LJ. Phosphorylation of T cell receptor zeta is regulated by a lipid dependent folding transition. Nat. Struct. Biol. 2000;7:1023–1026. doi: 10.1038/80930. [DOI] [PubMed] [Google Scholar]
- 18.Murray D, Hermida-Matsumoto L, Buser CA, Tsang J, Sigal CT, Ben-Tal N, Honig B, Resh MD, McLaughlin S. Electrostatics and the membrane association of Src: theory and experiment. Biochemistry. 1998;37:2145–2159. doi: 10.1021/bi972012b. [DOI] [PubMed] [Google Scholar]
- 19.Ben-Tal N, Honig B, Peitzsch RM, Denisov G, McLaughlin S. Binding of small basic peptides to membranes containing acidic lipids: theoretical models and experimental results. Biophys. J. 1996;71:561–575. doi: 10.1016/S0006-3495(96)79280-9. [DOI] [PMC free article] [PubMed] [Google Scholar]
- 20.Halligan BD, Ruotti V, Jin W, Laffoon S, Twigger SN, Dratz EA. ProMoST (Protein Modification Screening Tool): a web-based tool for mapping protein modifications on two-dimensional gels. Nucleic Acids Res. 2004;32:W638–W644. doi: 10.1093/nar/gkh356. [DOI] [PMC free article] [PubMed] [Google Scholar]
- 21.Fodor S, Jakus Z, Mocsai A. ITAM-based signaling beyond the adaptive immune response. Immunol. Lett. 2006;104:29–37. doi: 10.1016/j.imlet.2005.11.001. [DOI] [PubMed] [Google Scholar]
- 22.Sigalov AB. Multichain immune recognition receptor signaling: different players, same game? Trends Immunol. 2004;25:583–589. doi: 10.1016/j.it.2004.08.009. [DOI] [PubMed] [Google Scholar]
- 23.Sigalov A. Multi-chain immune recognition receptors: spatial organization and signal transduction. Semin. Immunol. 2005;17:51–64. doi: 10.1016/j.smim.2004.09.003. [DOI] [PubMed] [Google Scholar]
- 24.Ben-Tal N, Honig B, Miller C, McLaughlin S. Electrostatic binding of proteins to membranes. Theoretical predictions and experimental results with charybdotoxin and phospholipid vesicles. Biophys. J. 1997;73:1717–1727. doi: 10.1016/S0006-3495(97)78203-1. [DOI] [PMC free article] [PubMed] [Google Scholar]
- 25.Bentham M, Mazaleyrat S, Harris M. Role of myristoylation and N-terminal basic residues in membrane association of the human immunodeficiency virus type 1 Nef protein. J. Gen. Virol. 2006;87:563–571. doi: 10.1099/vir.0.81200-0. [DOI] [PubMed] [Google Scholar]
- 26.McLaughlin S, Murray D. Plasma membrane phosphoinositide organization by protein electrostatics. Nature. 2005;438:605–611. doi: 10.1038/nature04398. [DOI] [PubMed] [Google Scholar]