
Figure 2.
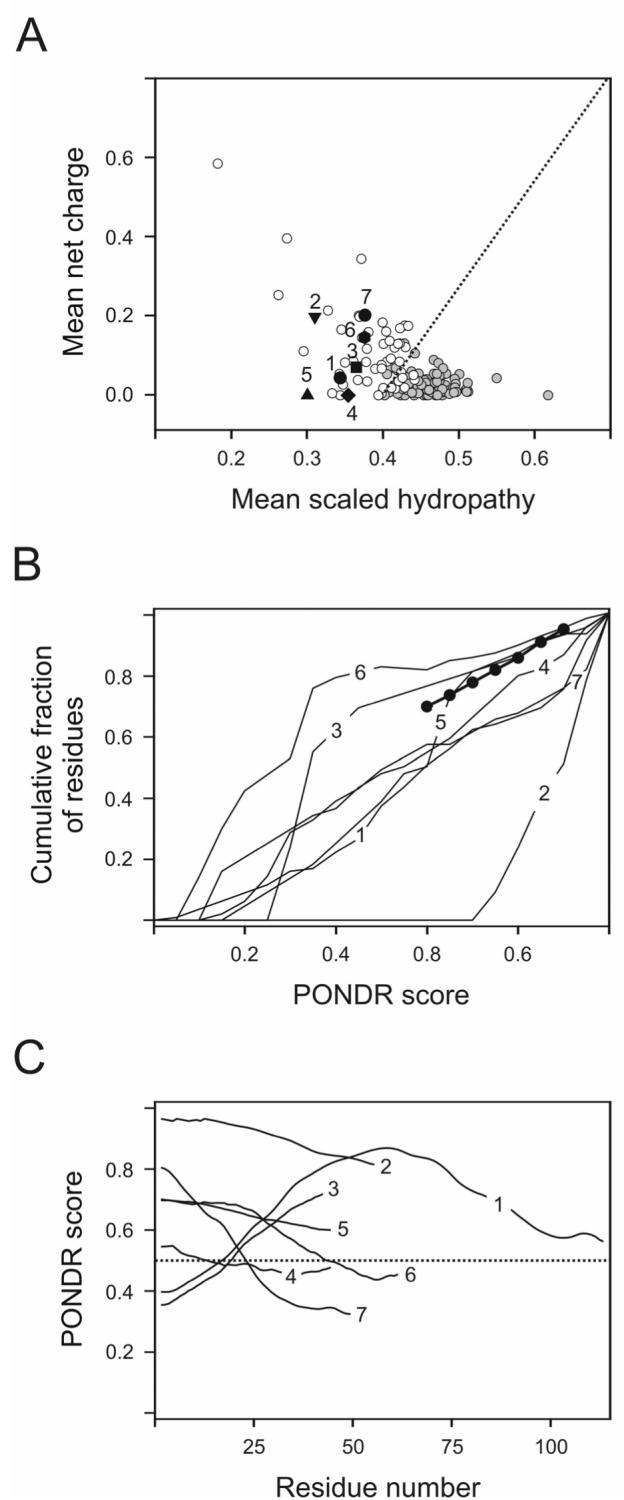
Analysis of intrinsic disorder distribution in cytoplasmic domains of ζ (1), CD3ε (2), FcεRIγ (3), CD3δ (4), CD3γ (5), Igα (6) and Igβ (7). A. Charge-hydropathy (CH) plot analysis. Data for individual proteins (symbols with numbers) are compared with set of natively unfolded (white circles) and natively folded proteins (gray circles). Black dotted line corresponds to the boundary separating compact and natively unfolded proteins. B. Cumulative distribution function (CDF) analysis. Boundary separating intrinsically disordered and ordered proteins is shown as a bold line with circles. This method separates ordered and disordered sequences based on the per-residue disorder score estimated by PONDR® VLXT, and the optimal boundary: the CDF curves for ordered proteins are located above the boundary, whereas the CDF curves of disordered proteins are located below the boundary. C. PONDR® VL3 data. A protein is predicted to be disordered if the majority of its PONDR® VL3 curve is located above the 0.5 line (black dotted line).