

Abstract
Normal and abnormal blood cells are typically analyzed by either histologic or flow cytometric approaches. Histology allows morphological examination of complex visual traits but with relatively limited numbers of cells. Flow cytometry can quantify multiple fluorescent parameters on millions of cells, but lacks morphological or sub-cellular spatial detail. In this review we present how a new flow technology, the ImageStream (Amnis Corporation, Seattle, WA), blends morphology and flow cytometry and can be used to analyze cell populations in ways not possible by standard histology or flow cytometry alone. The ImageStream captures brightfield, darkfield and multiple fluorescent images of individual cells in flow. The images can then be analyzed for levels of fluorescence intensity in multiple ways (i.e. maximum, minimum, or mean) as well as the shape and size of the area of fluorescence. Combinatorial measurements can also be defined to compare levels and spatial associations for multiple fluorescent channels. We demonstrate an application of this technology to distinguish six stages of erythroid maturation which have been classically defined by morphological criteria, by measuring changes in Ter119 mean intensity and area, DNA (Draq5 stain) mean intensity and area, and RNA content (thiazole orange stain). Using this approach, we find that other characteristics of erythroid maturational, such as marker expression and nuclear offset, vary appropriately within the defined cell subsets. Finally, we show that additional measurements of cell characteristics not classically analyzed in cytometry, including surface unevenness and unusually high contrast in brightfield images combined with fluorescent markers allow complex discriminations of rare populations.
Keywords: Erythropoiesis, Multispectral Imaging, ImageStream
Main Text
The field of hematology has benefited significantly from the techniques of histological examination and flow cytometry. Classification of normal and abnormal hematopoietic cells often hinges on diagnostic flow cytometric or morphological criteria. None-the-less, these techniques are distinct and often represent parallel, not integrated, approaches. Histology’s strength is in the depth and complexity of cellular detail. Immunohistochemistry allows further identification of specific cellular components. However, histology’s quantitative power is limited by the frequent subjectivity of characteristics, the limited number of fluorescent parameters that can be visualized on the same cell and the time required to analyze even several hundred cells. In contrast, flow cytometry offers immense quantitative capabilities including the analysis of millions of cells and the potential of measuring a dozen or more concurrent fluorescent parameters on the same cell. Yet flow cytometric data are based on single values per cell and lack sub-cellular spatial detail or visual information regarding the normal appearance of cells and stains. New approaches that intercalate cytometry and morphology are being developed for analyses of attached cells or tissue sections (e.g. iColor by Compucyte, INCell 1000 by GE) or of cells in flow (ImageStream by Amnis Corporation). This review will present examples of how we have used the combination of flow cytometry and morphology afforded by the ImageStream to address questions that have been recalcitrant to significant quantitative analysis.
The ImageStream analyzes individual cells in flow by darkfield, brightfield and multiple fluorescent parameters (Basiji et al., 2007). However, unlike standard flow cytometry, the data are collected as images (Fig.1A). These images can be thought of as two-dimensional spatial grids in which a third dimension of intensity is captured for each pixel. Depending on machine configuration, standard fluorescent stains excited by 488, 405 and 658 nm lasers can be assayed. The ImageStream’s power and limitations are intermediate between those of microscopy and of flow cytometry. Four different fluorescent stains can be analyzed in addition to a brightfield and a darkfield image. Typical files contain data collected from tens of thousands of cells and can reach a hundred thousand cells if desired. The sub-cellular detail of images is about that of 40X magnification microscopy, having approximately a one micron resolution, which allows visualization and quantitation of many sub-cellular characteristics.
Figure 1.
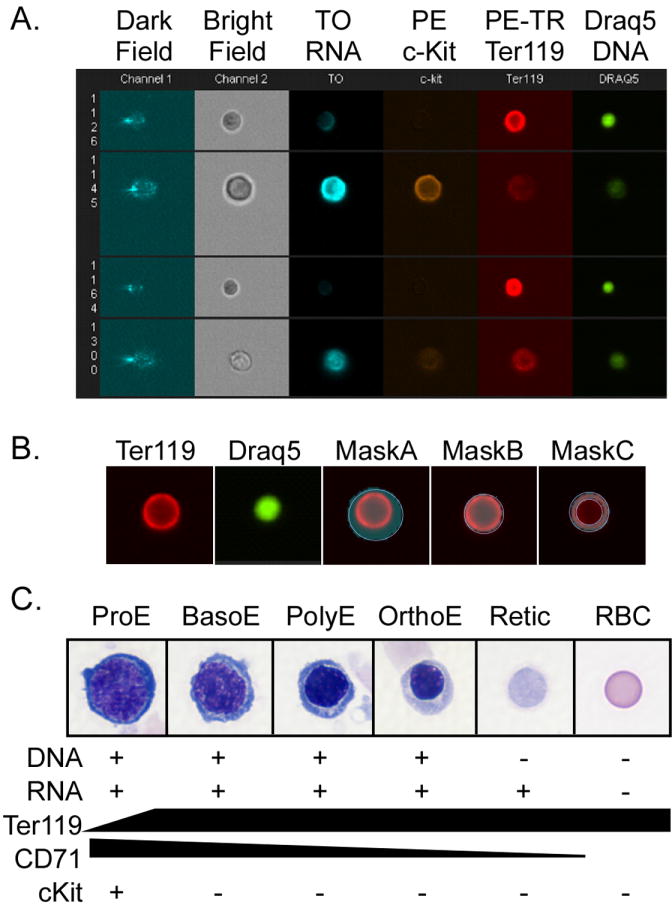
ImageStream analysis of erythroid cells. A. Six concurrent images were captured for each cell in flow. In this example, murine bone marrow erythroid cells were imaged in darkfield (channel 1), brightfield (channel 2), Thiazole Orange (TO, binds RNA, channel 3), PE-cKit (channel 4), PE-Texas Red- Ter119 (PE-TR Ter119, channel 5), and Draq5 (Biostatus Limited, binds DNA, channel 6). B. Masks define areas within the image. Left two images are Ter119 and Draq5 images for comparison without any masks highlighted. Mask A (highlighted) is the default mask of the Ter119 image. Mask B is the morphology mask describing the area of the Ter119 signal. Mask C is an example of a combined mask that is the result of subtracting the Draq5 morphology mask from the Ter119 morphology mask thus defining the cytoplasmic area. C. Images of progressive stages of erythroid cell maturation. Cells were cytospun and stained with Wright-Giemsa. As cells mature from proerythroblasts (ProE) to basophilic erythroblasts (BasoE) to polychromatophilic erythroblasts (PolyE) to basophilic erythroblasts (BasoE) to orthochromatic-erythroblasts (OrthoE) their cellular and their nuclear size decrease and the nucleus darkens as the cytoplasm lightens. Enucleation leads to reticulocytes (Retic), which loses their remaining organelles and RNA content, and thus their basophilic cytoplasmic staining, to become a mature red blood cell (RBC). Changes in the cytometric markers during erythroid maturation are listed below each stage.
The unique power of ImageStream analysis is its ability to discriminate populations based on combined variables of size, shape, and texture as well as brightfield and fluorescent intensity, all utilizing familiar sequential gating strategies on bivarient plots or histograms as for flow cytometry. There are additionally specialized analytical approaches available through the Image Data Exploration and Analysis (IDEAS) software. A particularly useful feature of this software is the ability to select a cell based on its image, and then see its data point highlighted on any graph. The reverse is also true. The images of a gated population or a single dot on a plot can be viewed and data for that cell or population can then be highlighted throughout the analysis. This feature provides important feedback for setting gate boundaries, particularly when discriminating between closely related cells. Additionally, the IDEAS software also includes the option of defining populations by selecting individual cells based on image data. This sentinel population can then be highlighted in graphs, allowing rapid tests for which of the many available quantifiable features will maximize discrimination between cell populations.
There is a daunting complexity of features that can be measured using the IDEAS software. For the purposes of understanding the examples in this review, we will give an overview of the most common and basic features. Descriptions of more features can be found online (www.Amnis.com). A central component of the analysis is the definition of two-dimensional areas or “masks” within images (Fig. 1B). Masks are based on changes in intensity in a designated channel and are calculated for each cell based on its individual signal in that channel. The default mask (Fig. 1B-MaskA) is designed to cover all areas with intensity over background. Morphology masks (Fig. 1B- MaskB), are based on sharp changes in intensity, and thus more accurately define the area of fluorescent signal. Masks can also be based on intensity thresholds allowing for identification and counting of spots of higher intensity. All of these masks can be expanded, contracted, and filled as well as combined using Boolean logic. For example a morphology mask of the nucleus (based on a DNA stain) subtracted from the morphology mask of the cell (based on a cell surface marker) creates a new mask of the cytoplasmic area (Fig. 1B-MaskC). Features are measurements limited to specified mask within the image. They include spatial analysis of mask size and shape characteristics. Additionally, brightfield, darkfield or fluorescent intensity within the masked area can be assayed. This includes analysis of intensity in one channel using a mask defined by intensity in a different channel. Therefore, queries of sub-cellular localization using indicators for specific cell regions, as well as general similarity of shape and position of any signals can be measured (Beum et al., 2006). Besides total intensity, intensity can assayed as mean, maximum or minimum levels as well as texture features such as contrast, number of spots, or slope of intensity changes (i.e. sharpness or fuzziness). As with masks, features can be combined with Boolean logic to define a more complex feature.
Examples of the unique capabilities of this approach are found in our analysis of erythroid cell maturation. Erythroid cells mature within the complex cellular milieu of the bone marrow and undergo a progressive set of morphologically identifiable stages (Bloom and Fawcett, 1975, see Fig. 1C). Erythroid precursors undergo a progressive decrease in cellular and nuclear size as they mature. The cytoplasm transitions from dark blue (basophilic) to red (acidophilic) due to the loss of organelles such as ribosomes and the accumulation of hemoglobin. The nucleus becomes progressively more pycnotic and eventually becomes freely movable in the cell. The nucleus is then removed to form an enucleated reticulocyte that completes its maturation to a mature red blood cell by removal of its remaining organelles and then enters the bloodstream. The erythroid lineage makes up a minority of the bone marrow, making quantitative measurements of cellular perturbations extremely laborious. Thus, to study this lineage in disease and recovery from external insults, we wanted to use flow cytometry to analyze large numbers of cells as well as to measure aspects of cell cycle and apoptosis during maturation. However, the use of flow cytometry to analyze erythropoiesis is been hampered by the paucity of cell surface markers as well as the inability to measure morphological characteristics that classically define specific stages of erythropoiesis. The challenge was to find a combination of parameters that could be assessed by multispectral imaging and be linked to the known histological parameters of erythroid maturation that are based on cell and nuclear size as well as cytoplasmic and nuclear characteristics observed with Wrights-Giemsa staining (Fig. 1C). Common flow cytometric markers used to identify erythroid precursors in mouse include the erythroid-specific cell surface marker, Ter119, and the transferin receptor CD71 (Kina et al., 2000; Socolovsky et al., 2001; Papathanasiou et al., 2003; Zhang et al., 2003). Ter119 is first expressed at low levels in the most immature erythroblast, and thereafter is at a constant level per cell. CD71 is the marker most often used to further discriminate Ter119-positive erythroid precursors by flow cytometry as it decreases during maturation. However, it isn’t clear how to correlate the defined morphological stages to CD71 levels, or even whether CD71 decreases in a stage-specific manner. We chose to utilize Ter119 (a pan-erythroid marker), and thiazole orange (to detect RNA that correlates with basophilic staining of ribosomes), and Draq5 (to detect DNA) to define progressive stages of maturing erythroid cells (Fig1A).
An important consideration in multispectral analysis is the utilization of sophisticated measurements of fluorescent signals. In standard flow cytometry, only the total fluorescent intensity for each cell is measured while multispectral analysis can measure fluorescence in multiple ways. For example, small bright cells with the same number of fluorescent molecules as large dim cells, and thus indistinguishable by standard flow cytometry, can be discriminated by their difference in mean intensity. This is demonstrated in Figure 2 where cells with similar total levels of Ter119 (Fig. 2A) are plotted by mean and maximum Ter119 intensity (Fig. 2B) creating a continuum of big and Ter119-dim cells to small and Ter119-bright cells (see inserts in Fig. 2B). In terminal erythroid differentiation, both cellular and nuclear areas decrease while their total levels of Ter119 antigen and DNA per cell remain the same. Therefore, mean levels of Ter119 and DNA staining increase with maturation and can be used to discriminate erythroid precursors.
Figure 2.

Discrimination of cells with alternative intensity measurements. A. Histogram of total Ter119 intensity per cell of Ter119-positive cells from murine bone marrow. A subpopulation of cells with similar (< 2-fold) levels of Ter119 intensity selected to be plotted in B is indicated in red. B. Cells selected in A were plotted by Ter119 mean and maximum intensity producing a continuum of less mature big and Ter119-dim (bottom right insert) to more mature small and Ter119-bright cells (top right insert). Green crosshairs and arrows indicate where the cells visualized in the inserts are located in the graph.
The gating strategy we developed for delineating erythroid intermediates in bone marrow is shown in Figure 3. Initial gating selected a population of single cells that were in focus. We removed images with multiple cells based on their large brightfield area major axis (longest diameter). Cells that were in focus were selected by their sharp change in brightfield intensity at the edge of the cell (gradient max of an edge mask as shown in Fig. 1B MaskC). Ter119 staining was used to select erythroid cells (Fig. 3A). Ter119 mean intensity was plotted versus cell area in brightfield. This approach allowed elimination of Ter119-negative cells as well as cells whose size and mean intensity was not consistent with erythroid maturation (e.g. “big and bright” clumps of little bright cells or “small and dim” cells with fluorescent debris attached, highlighted cells in Fig. 3A). This exemplifies an important strategy of using visual examination of cells within a plot to set gates that eliminate noise as well as capture desired subsets.
Figure 3.

Erythroid intermediates as delineated by ImageStream analysis utilizing IDEAS 2.0 software. Murine bone marrow cells were stained with the RNA stain thiazole orange (TO), biotinated Ter119 revealed by PE-Texas Red streptavidin and the DNA stain Draq5. Multispectral imaging of cells was carried out on the ImageStream and the data files were compensated as published (George et al., 2004; Ortyn et al., 2006). Initial gating removed images containing multiple cells and out of focus cells and the resultant file of single cells was analyzed by the gating strategy shown in panels A to F and discussed in the text. Arrows indicate cell populations that were plotted in successive graphs. In A, green crosshairs and arrows indicate where the cells visualized in the inserts are located in the graph (left brightfield, middle Ter119, right Draq5). Final populations are indicated by red-boxed names. Panel G contains 3 examples each of identified erythroid cell intermediates. Triple panels of images are brightfield (left panel), combined Ter119 (red) and Draq5 (green) (middle panel), and TO (right panel). The sensitivity of the thiazole orange images was increased equally for the reticulocyte and RBC images to emphasize the residual TO staining evident in the reticulocytes.
The Ter119-positive cells were then separated into nucleated and enucleated subpopulations based on Draq5 staining (Fig. 3B). Aspect ratio, or roundness, of the Draq5 area was also plotted on this graph so that dividing cells could be removed from the analysis. The enucleated cells are defined as RNA-positive reticulocytes (Retics) and RNA-negative mature red blood cells (RBCs) based on thiazole orange staining (Fig. 3C). Proerythroblasts (ProE) can be distinguished from the remaining erythroid precursors by their high RNA content as well as dim Ter119 (mean intensity) staining (Fig. 3D). The remaining three erythroid precursor populations, basophilic erythroblasts (BasoE), polychromatophilic erythroblasts (PolyE) and orthochromatic erythroblasts (OrthoE), are the most difficult to separate into homogenous populations using classic flow cytometry. We have defined these populations using criteria derived from traditional histology (Fig. 1C). Progressive nuclear condensation is discriminated by Draq5 area (Fig. 3E) and decreasing cell size is discriminated by Ter119 area (Fig. 3F). Additionally, the condensation of Ter119 and Draq5 stains were detected using mean intensity (as in Fig 2B). For both stains, area is graphed versus the mean intensity divided by area. By including area as a denominator on the Y-axis, the continuum of small and bright (upper left) to big and dim (lower right) is accentuated. Initially, Ter119 hi/ TO lo (Fig. 3D) cells are gated into three overlapping populations of cells with condensed nuclei (Draq5 small and bright), mid-sized nuclei (Draq5 mid) and larger nuclei (Draq5 big and dim) (Fig. 3E). Each of these three populations is then graphed as in Fig. 3F and gated based in non-overlapping gates of cell size and Ter119 intensity. Examination of the Ter119 and Draq5 stained images of cells plotted within these graphs were used to create gates that grouped morphologically similar cells together (as in Fig. 3G). We utilized overlapping gates with the Draq5 staining because we found greater variability within these three populations in nuclear size then in Ter119 staining. A boundary between large and small nuclei was placed based on separation of OrthoE and BasoE cells. An overlapping mid-size nuclear gate was then created to include the range where PolyEs were observed. For Ter119 gating, boundaries of the non-overlapping gates were selected based on visualization of individual cells as well as the known proportions of these erythroid precursor subpopulations determined by initial histological examinations (see below). In order to be classified as BasoE, cells must have been gated in both the big and dim gates for Draq5 staining and Ter119 staining. Likewise, PolyE or OrthoE are gated as both Draq5 and Ter119 mid, or both Draq5 and Ter119 small and bright, respectively.
Using this approach, over 80% of the nucleated Ter119-positive cells can be classified into specifically staged erythroblast populations. Definition of these gates for erythroid precursors can be subjective, particularly since erythroid precursor maturation occurs as a continuum, not in discrete steps. However similar subjectivity, if not more, is associated with the microscopic classification of erythroid precursors and is also found in the flow cytometric assays where fewer parameters are used to classify erythroid cells. To maximize reproducibility between experiments, appropriate positive controls must be included in each experiment. Thus, bone marrow from normal age-matched controls were used to set gates that established consistent proportions of these erythroid precursors (8% +/- 2% ProE, 16%+/- 4% BasoE, 27%+/- 4% PolyE and 35% +/- 6% OrthoE, average of five experiments +/- standard deviation). These ratios are similar to those determined by histology from the same marrow samples (data not shown). Ultimately, it is the ability to reproducibly define sequential maturational subsets in control samples and then directly apply the same gating strategy to experimental samples that creates a viable quantitative assay of erythroid maturation.
The robustness of the multispectral-defined stages of erythroid cell maturation is evidenced by expected correlations of maturational characteristics not used in the initial analysis. For example, RNA levels decrease between basophilic and orthochromatic erythroblasts as expected due to loss of basophilic staining (diminution in TO in Fig. 3G). The use of only three fluorescent stains in classification allowed us one fluorescent channel for analytical purposes. Using this channel we confirmed the expected decrease in cKit levels as cells progress from proerythroblast to basophilic erythroblasts (Fig. 4A). A feature measuring nuclear asymmetry was created dividing the distance between centers of the nuclear and cytoplasmic morphology masks by the cellular diameter. This identified a subpopulation of erythroblasts with asymmetric nuclei of which 87% were classified as orthochromatic erythroblasts (Fig. 4B), the stage at which asymmetric nuclei are observed histologically (Fig. 1C). In contrast, we found that while CD71 levels do decrease during maturation as reported (Socolovsky et al., 2001) particularly as reticulocytes transition to RBC, levels of CD71 were not a good discriminator of intermediate stages of erythropoiesis (Fig. 4C). We are using this approach to further develop cell stains and gating strategies for use in flow cytometric cell sorting. Utilizing multispectral imaging to test new reagents allows visual comparisons of cells derived from a variety of gating strategies within a single experiment and consequently facilitates development of new protocols for classic flow cytometry.
Figure 4.

Analyses of erythroid populations utilizing the ImageStream. A. Total intensity levels of cKit (PE-CD117) intensity were graphed for four erythroblast populations (containing 1246 total cells) as determined in Figure 3. As expected, proerythroblasts have the highest cKit levels, with the basophilic erythroblasts having lower levels as cKit is down-regulated during erythroid maturation. B. Asymmetry of nuclei was calculated using morphology masks and the following equation (square root ((delta center x Ter119 vs. Draq5)2+(delta center y Ter119 vs. Draq5)2)/ area Ter119). Cells with asymmetric nuclei are shown. A large majority (>87%) were classified as orthochromatic erythroblasts consistent with the known biology of those cells. C. Total intensity levels of CD71 were graphed for three mid maturation stages of erythroblasts (containing 1315 total cells) classified as in Figure 3. While there was an some decrease in CD71 as cells mature from basophilic, polychromatophilic to orthochromatic erythroblasts, large overlap in CD71 intensity makes it a poor discriminator of these stages of erythropoiesis. D. Fixed murine fetal liver cells stained with Ter119, Draq5 and with antibodies to embryonic erythroid specific εy-globin (McGrath et al., 2007) were analyzed by ImageStream. Orthochromatic erythroblasts of the embryonic (primitive erythroid) lineage are very rare in the fetal liver, but have a diagnostic dark and craggy appearance in bright field images (asterisks in upper left image). These characteristics can be plotted as brightfield minimum intensity and Gradient RMS brightfield (lower graph) allowing the gating of a cell population that contains embryonic erythroblasts (upper right image, brightfield and combined εy-globin (yellow) and Draq5 (pink) images).
In the above analysis, familiar parameters such a size and fluorescent intensity are employed. However, the complexity of analyzable features is leading to an expanding variety of uses for the combination of cytometry and imaging. We were able to study a unique transient erythroid lineage found in the early embryo (McGrath et al., 2008), in part based on their uniquely “craggy and dark” appearance in brightfield imagery (Fig. 4D). Darkness could be determined by minimum intensity and cragginess could be measured as a frequent change in the intensity of brightfield signal within the cells (Gradient RMS). ImageStream analysis of cell and nuclear shape combined with immunophenotype has been used by other investigators to define cells produced during ES cell differentiation, cells bound by natural killer cells, and which cells are producing IFN-gamma (Kim et al., 2007; Neff-LaFord et al., 2007; Woll et al., 2008). There are a growing number of investigators using the ImageStream to quantify colocalization of proteins or the extent of a protein’s localization within the nucleus (Beum et al., 2006; Liu et al., 2007; Matsuda et al., 2007; Ramos et al., 2007). The combination of standard fluorescent detectors of aspects of apoptosis with examination of nuclear morphology has also been used to facilitate a more complete analysis of the apoptotic process and allow late stage apoptosis to be distinguished from necrosis (George et al., 2004; Guzman et al., 2007).
The multispectoral imaging of cells in flow, in adherent cultures or in tissues will be an important new tool that can be used with standard flow cytometry as well as histologic microscopy. The power to analyze the images of large numbers of cells will greatly improve our ability to detect complex and rare populations compared to standard histological approaches. Quantitation of sub-cellular and complex morphologic features alongside mulitiple measurements of fluorescence intensity will also greatly improve our understanding of the cells analyzed by flow cytometry. Multispectral imaging of cells in tissues should facilitate the examination of interactions of hematopoietic cell with their cellular niche. The limit of these analyses will be our ability to translate what we see into quantifiable features. The power of these approaches lies in the exquisite human skill for visual discrimination combined with the highly quantifiable molecular biological reagents that are increasingly available to researchers. Particularly in the field of hematology, with its large extant histological and flow cytometric data bases, these new approaches will open up new possibilities for analyzing how a cell functions and changes in cellular differentiation and disease.
Footnotes
Publisher's Disclaimer: This is a PDF file of an unedited manuscript that has been accepted for publication. As a service to our customers we are providing this early version of the manuscript. The manuscript will undergo copyediting, typesetting, and review of the resulting proof before it is published in its final citable form. Please note that during the production process errors may be discovered which could affect the content, and all legal disclaimers that apply to the journal pertain.
References
- Basiji DA, Ortyn WE, Liang L, Venkatachalam V, Morrissey P. Cellular image analysis and imaging by flow cytometry. Clin Lab Med. 2007;27:653–70. viii. doi: 10.1016/j.cll.2007.05.008. [DOI] [PMC free article] [PubMed] [Google Scholar]
- Beum PV, Lindorfer MA, Hall BE, George TC, Frost K, Morrissey PJ, Taylor RP. Quantitative analysis of protein co-localization on B cells opsonized with rituximab and complement using the ImageStream multispectral imaging flow cytometer. J Immunol Methods. 2006;317:90–9. doi: 10.1016/j.jim.2006.09.012. [DOI] [PubMed] [Google Scholar]
- Bloom W, Fawcett L. A Textbook of Histology. W B Saunders Company; Philadelphia, P.A: 1975. [Google Scholar]
- George TC, Basiji DA, Hall BE, Lynch DH, Ortyn WE, Perry DJ, Seo MJ, Zimmerman CA, Morrissey PJ. Distinguishing modes of cell death using the ImageStream multispectral imaging flow cytometer. Cytometry A. 2004;59:237–45. doi: 10.1002/cyto.a.20048. [DOI] [PubMed] [Google Scholar]
- Guzman ML, Li X, Corbett CA, Rossi RM, Bushnell T, Liesveld JL, Hebert J, Young F, Jordan CT. Rapid and selective death of leukemia stem and progenitor cells induced by the compound 4-benzyl, 2-methyl, 1,2,4-thiadiazolidine, 3,5 dione (TDZD-8) Blood. 2007;110:4436–44. doi: 10.1182/blood-2007-05-088815. [DOI] [PMC free article] [PubMed] [Google Scholar]
- Kim GG, Donnenberg VS, Donnenberg AD, Gooding W, Whiteside TL. A novel multiparametric flow cytometry-based cytotoxicity assay simultaneously immunophenotypes effector cells: comparisons to a 4 h 51Cr-release assay. J Immunol Methods. 2007;325:51–66. doi: 10.1016/j.jim.2007.05.013. [DOI] [PMC free article] [PubMed] [Google Scholar]
- Kina T, Ikuta K, Takayama E, Wada K, Majumdar AS, Weissman IL, Katsura Y. The monoclonal antibody TER-119 recognizes a molecule associated with glycophorin A and specifically marks the late stages of murine erythroid lineage. British Journal of Haematology. 2000;109:280–287. doi: 10.1046/j.1365-2141.2000.02037.x. [DOI] [PubMed] [Google Scholar]
- Liu XS, Li XH, Wang Y, Shu RZ, Wang L, Lu SY, Kong H, Jin YE, Zhang LJ, Fei J, Chen SJ, Chen Z, Gu MM, Lu ZY, Wang ZG. Disruption of palladin leads to defects in definitive erythropoiesis by interfering with erythroblastic island formation in mouse fetal liver. Blood. 2007;110:870–6. doi: 10.1182/blood-2007-01-068528. [DOI] [PubMed] [Google Scholar]
- Matsuda JL, George TC, Hagman J, Gapin L. Temporal dissection of T-bet functions. J Immunol. 2007;178:3457–65. doi: 10.4049/jimmunol.178.6.3457. [DOI] [PubMed] [Google Scholar]
- McGrath KE, Kingsley PD, Koniski AD, Porter RL, Bushnell TP, Palis J. Enucleation of primitive erythroid cells generates a transient population of “pyrenocytes” in the mammalian fetus. Blood. 2008;111:2409–17. doi: 10.1182/blood-2007-08-107581. [DOI] [PMC free article] [PubMed] [Google Scholar]
- Neff-LaFord H, Teske S, Bushnell TP, Lawrence BP. Aryl hydrocarbon receptor activation during influenza virus infection unveils a novel pathway of IFN-gamma production by phagocytic cells. J Immunol. 2007;179:247–55. doi: 10.4049/jimmunol.179.1.247. [DOI] [PubMed] [Google Scholar]
- Ortyn WE, Hall BE, George TC, Frost K, Basiji DA, Perry DJ, Zimmerman CA, Coder D, Morrissey PJ. Sensitivity measurement and compensation in spectral imaging. Cytometry A. 2006;69:852–62. doi: 10.1002/cyto.a.20306. [DOI] [PubMed] [Google Scholar]
- Papathanasiou P, Perkins AC, Cobb BS, Ferrini R, Sridharan R, Hoyne GF, Nelms KA, Smale ST, Goodnow CC. Widespread failure of hematolymphoid differentiation caused by a recessive niche-filling allele of the Ikaros transcription factor. Immunity. 2003;19:131–44. doi: 10.1016/s1074-7613(03)00168-7. [DOI] [PubMed] [Google Scholar]
- Ramos HJ, Davis AM, George TC, Farrar JD. IFN-alpha is not sufficient to drive Th1 development due to lack of stable T-bet expression. J Immunol. 2007;179:3792–803. doi: 10.4049/jimmunol.179.6.3792. [DOI] [PMC free article] [PubMed] [Google Scholar]
- Socolovsky M, Nam H, Fleming MD, Haase VH, Brugnara C, Lodish HF. Ineffective erythropoiesis in Stat5a(-/-)5b(-/-) mice due to decreased survival of early erythroblasts. Blood. 2001;98:3261–73. doi: 10.1182/blood.v98.12.3261. [DOI] [PubMed] [Google Scholar]
- Woll PS, Morris JK, Painschab MS, Marcus RK, Kohn AD, Biechele TL, Moon RT, Kaufman DS. Wnt signaling promotes hemato-endothelial cell development from human embryonic stem cells. Blood. 2008;111:122–31. doi: 10.1182/blood-2007-04-084186. [DOI] [PMC free article] [PubMed] [Google Scholar]
- Zhang J, Socolovsky M, Gross AW, Lodish HF. Role of Ras signaling in erythroid differentiation of mouse fetal liver cells: functional analysis by a flow cytometry-based novel culture system. Blood. 2003;102:3938–46. doi: 10.1182/blood-2003-05-1479. [DOI] [PubMed] [Google Scholar]