Abstract
The role of secondary structures and base mutability at different levels of transcription and supercoiling is analyzed in variable region antibody genes VH5, VH94 and VH186.2. The data are consistent with a model of somatic hypermutation in which increasing levels of transcription and secondary structure stability correlate with the initial formation of successive mutable sites. Encoded differences exist in stem length and the number of GC pairs at low versus high levels of transcription in CDRs. These circumstances simplify the complexities of coordinating mutagenesis by confining this process to each mutable site successively, as they form in response to increasing levels of transcription during affinity maturation.
1. Introduction
During somatic hypermutation (SHM), coordinated mutagenesis optimizes the fit of antibody to antigen. This extraordinary process apparently involves a transcription-induced million-fold increase in mutation frequency focused in a small region of VH genes, which share several characteristics not present in other highly mutable genes, such as the tumor suppressor gene, p53, and lacI. The CDRs in heavy chain genes reveal mutable sites that are exposed successively, 5′ to 3′, as transcription levels increase. In common with other highly mutable genes such as p53, secondary structures (SS) formed during SHM have stable stems that create pauses during transcription, resulting in the repetitive exposure of unpaired bases at mutable sites in the non-transcribed strand. These characteristics of SSs in highly mutable genes are encoded in the DNA, which also specifies the basic platform for coordinating mutagenesis during affinity maturation.
In our companion paper, I. VH gene transcription creates stabilized secondary structures for coordinated mutagenesis during somatic hypermutation (referred to as paper I), a highly mutable 65 nt SS in VH5, called SS14.9, was analyzed using the mfg computer algorithm. This program simulates the formation of SSs in the non-transcribed strand during transcription, and displays successive sequence-determined SSs containing “hot spots”, or sites of unpaired highly mutable bases. The existence of six hypermutable sites in SS14.9 was independently discovered by Ronai et al. (2007) in the identical gene sequence of splenocyte DNA isolated from immunized mice, using a chemical assay to identify the mutable ssDNA segments. In VH5, SS14.9 is formed repeatedly during the folding process, as a result of Stem-Induced Backtracking (S-IB) which localizes and increases the exposure and mutability of all unpaired bases in this SS.
The present paper provides further analyses of VH5 and two other VH genes to clarify mechanisms by which increasing levels of transcription during affinity maturation would result in the successive appearance of mutable sites, 5′ to 3′, and in increased mutation frequencies in CDRs during SHM.
2. Materials and Methods
2.1. Genes analyzed
The sequence and mutation frequencies (if available) of the following genes were included in this study: VH5 (GenBank accession numbers X92278 and M99684) (Zheng et al., 2005), VH94 (GenBank accession number L10094), VH186.2 (GenBank accession number U64039.1), and p53 (GenBank accession number NT_010718.15). In VH5 the mfg nt number 1 corresponds to nt 311 in the GenBank sequence; in VH94, the mfg nt number 1 corresponds to number 142 in the GenBank sequence; in VH 186.2 the mfg nt number 10 corresponds to nt 1 (Siekevitz et al., 1987), and in p53 the mfg nt number 1 corresponds to nt 7,175,166.
2.2. The mfg program
This program interfaces with the mfold program, which forms and reports all possible SSs from a given segment of ssDNA, in decreasing order of stability. Evidence indicates that increased levels of transcription and supercoiling generally correlate with increased levels of SS stability, and investigations of mutagenesis in both prokaryotes and eukaryotes have shown that observed base mutability can generally be predicted (MI), knowing the stability (−ΔG) of the SS in which the base is unpaired and the extent to which it is unpaired during transcription (percent of total folds): MI = (−ΔG) (% unpaired). For more detailed information see paper I; Reimers et al. (2004); Wright et al. (2002); Wright et al. (2003).
3. Results
3.1. Increasing levels of transcription localize the successive formation of mutable sites to the CDRs
A series of window sizes was examined for each VH gene to find the most likely SS for coordinating mutagenesis in vivo (Table 1). A high-stability SS was identified for each window size and the number of S-IB repeats in an mfg analysis was noted. Window sizes were selected by the frequency with which a specific high-stability SS was formed at successive window sizes, and the frequency of its repeated formation during S-IB. On average, these variables plateau at 65 or 70 nts for VH5, VH94 and VH186.2. Using this and other information from previous investigations, window sizes of 65, 50 and 30 nts (representing high, medium and low levels of transcription) were chosen for analyzing the first two genes. For VH186.2, successive 30 nt sequences did not always form SSs, resulting in an incomplete mfg analysis. Therefore, 80, 65, and 40 nt window sizes were chosen.
Table 1.
Maximum number of S-IB repeats at different window sizes as predicted by mfg
| VH5 | VH94 | VH186.2 | ||||
|---|---|---|---|---|---|---|
| Window Size (nts) | −ΔG | Number of repeats | −ΔG | Number of repeats | −ΔG | Number of repeats |
| 30 | 1.3 | 20 | 10.8 | 21 | 6.4 | 29 |
| 40 | 11.2 | 17 | 3.1 | 34 | 7.5 | 28 |
| 50 | 13.6 | 26 | 11.2 | 19 | 10.4 | 26 |
| 60 | 14.9 | 27 | 16.4 | 23 | 12.8 | 25 |
| 65 | 14.9 | 37 | 17.0 | 26 | 12.8 | 29 |
| 70 | 14.9 | 47 | 17.3 | 27 | 12.8 | 33 |
| 75 | 16.0 | 38 | 17.0 | 26 | 14.2 | 21 |
| 80 | 16.5 | 39 | 18.4 | 25 | 14.1 | 21 |
| 90 | 17.8 | 41 | 19.0 | 27 | 15.4 | 18 |
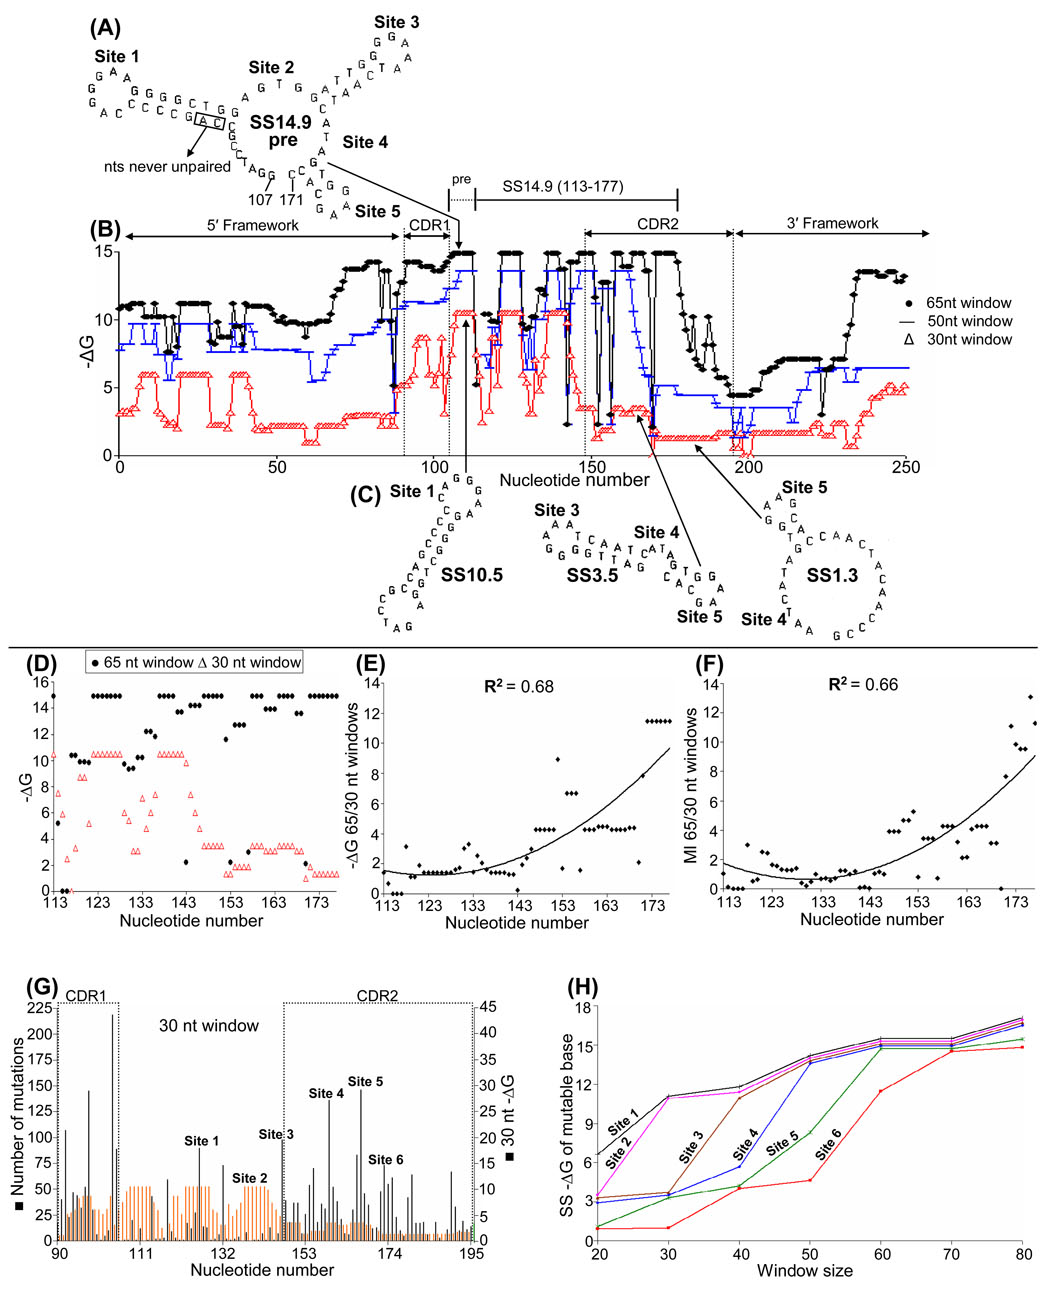
Using window sizes of 65, 50, and 30 nts, Fig. 1B shows mfg-generated profiles of SS stabilities (−ΔGs) in VH5 that reflect different levels of transcription (paper I). In Fig. 1B, note that increasing levels of SS stability are depicted in the vertical direction. The most stable SS at the 65 nt level of transcription, SS14.9 pre (nt 107–171), is depicted in Fig. 1A. Three 30 nt SSs are shown in Fig. 1C. The highly unpaired bases at mutable sites in SSs are retained as SS stabilities increase with increasing levels of transcription (Wright et al., 2004, and paper I). In VH genes, different stability profiles (−ΔGs) of the non-transcribed strand during transcription are similar in pattern prior to reaching their peak SS stabilities. For example, in VH5 (Fig. 1B) all three stability profiles first peak at the same point in the sequence (~ nt 107). However, at a point just 5′ of CDR2, the 30 nt SS stability drops from a −ΔG of 10.5 to 1.3 (Fig. 1C), while the stability of the 65 nt SS14.9 remains high (this also occurs in CDR1 to a lesser extent). Thus, the −ΔG profiles of 65 and 30 nt SSs become staggered by the increasing difference between their stabilities as the result of a striking decrease in 30 nt SS stabilities (Fig. 1C). This decrease is due to encoded alterations in stem length and stability: the 30 nt SS10.5 has 7 C:G and 1 A:T pairs, whereas the 30 nt SS1.3 has 2 C:G and 1 A:T pair. The stabilities of 65 nt and 30 nt SS in nts 113–177 are plotted in Fig. 1D. Thus, as transcription levels (SS stabilities) increase, the −ΔG ratio of 65 to 30 nt (Fig. 1E) increases, as does predicted base mutability, or MI (Fig. 1F). Percent unpaired is high at all mutable sites at all levels of transcription, and thus has little additional effect on MI (paper I). Fig. 1G profiles the −ΔG of 30 nt SSs in VH5 compared to mutation frequencies in the entire CDR, showing the regional correlation between high mutation frequencies and low −ΔG SSs at low levels of transcription. Correlations such as those described in Fig.1E–G were not found in the 5′ or 3′ framework regions (not shown).
Fig. 1. Stability profiles of SSs formed at different levels of transcription in VH5.
(A) SS14.9 pre, the structure of the most stable SS formed during simulated transcription of VH5 using a 65 nt window. The location of hypermutable Sites 1–5 in SS14.9 pre are indicated. (B) Stability (−ΔG) profiles of SSs formed in the CDRs using window sizes of 65 nt (circles), 50 nt (lines) and 30 nt (triangles). (C) Three successive (5′ to 3′) SSs (SS10.5, SS3.5 and SS1.3) formed using a 30 nt window. (D) The stability (−ΔG) during transcription (5′ to 3′) of 65 nt compared to 30 nt SSs. (E) The 65/30 ratio of these stabilities as transcription levels increase. (F) The predicted increase in base mutability (MI) as transcription levels and SS stabilities increase, 5′ to 3′. (G) The correlation between high mutation frequencies and low SS stabilities in the CDRs using a 30 nt window. (H) The successive appearance of mutable sites as transcription levels and SS stabilities increase. The conversion of SS14.9 pre to SS14.9 is not shown in Fig. 1A (see paper I).
Evidence suggests that peak mutation frequencies move 5′ to 3′ as transcription levels increase during affinity maturation (see Discussion). Thus, Site 1 (Fig. 1C) exists at both high (SS14.9) and low (SS10.5) levels of transcription, in a similar position of each structure. However, this is not true of Site 6 in SS1.3, which only exists as a highly mutable site in SS14.9 when this SS is formed from SS14.9 pre at high levels of transcription (Fig. 1H; see paper I).
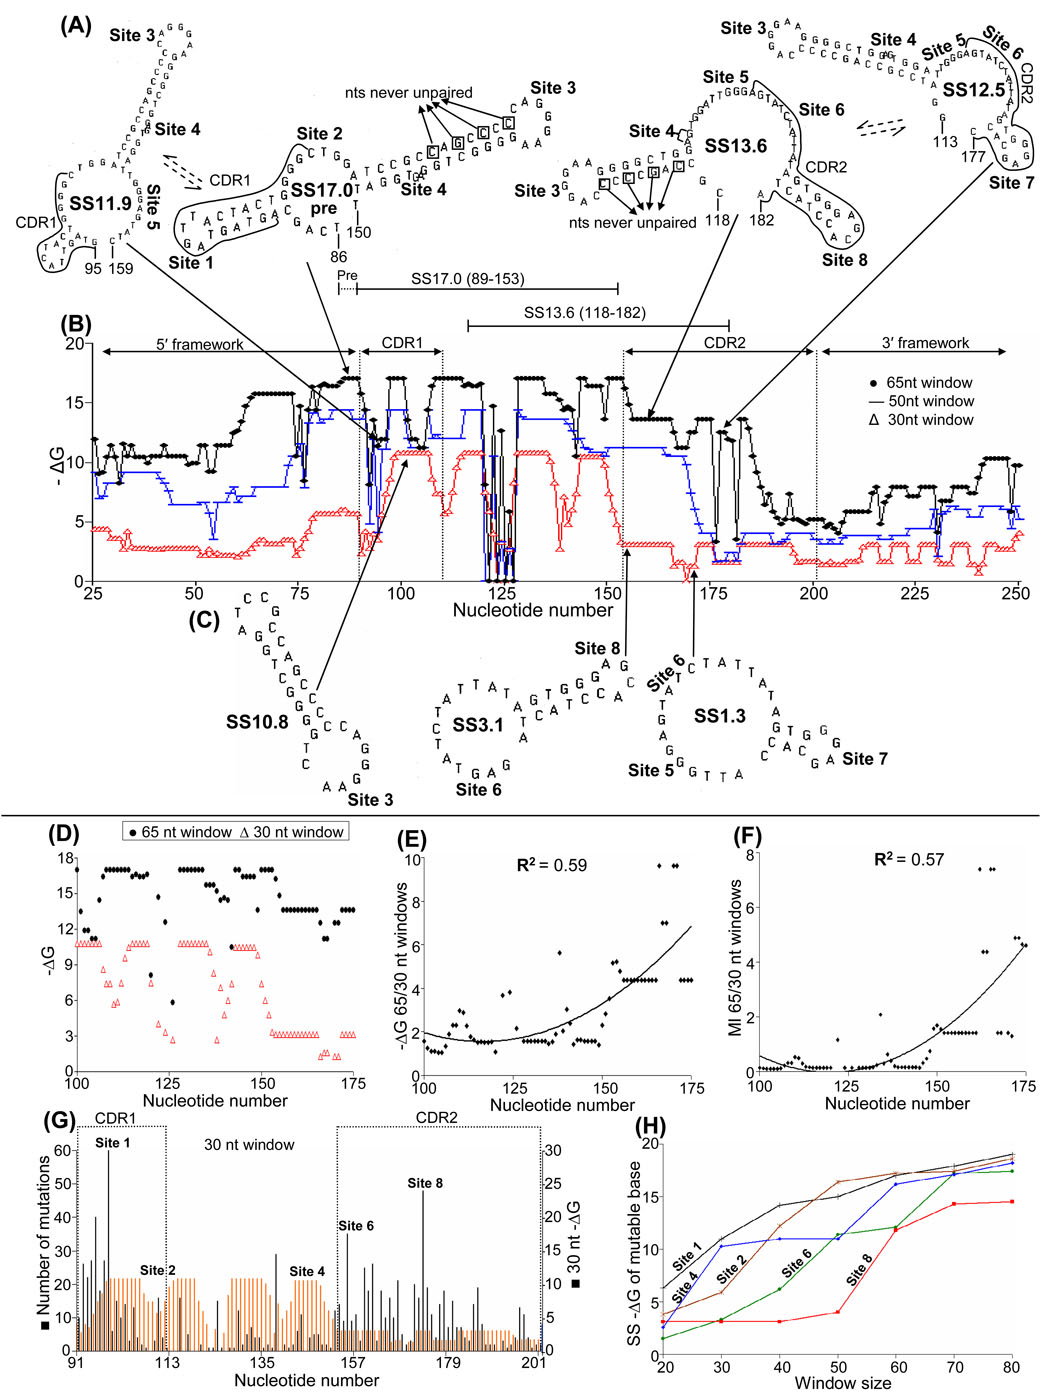
Compared to VH5, VH94 is more complicated because of the number of inter-converting and over-lapping SSs (Fig. 2). SS17.0 is the dominant 65 nt SS in this gene and this structure is first formed just 5′ of CDR1. Thereafter it is reformed a total of 24 times (Table 2). VH94 actually shows two dominant 65 nt SSs: SS17.0 for CDR1 and SS13.6 for CDR2 (Fig. 2A and Fig. 5B). Mutable sites in CDRs were numbered successively in this gene with sites 1–5 existing in SS17.0 (red in Table 2), and Sites 6 – 8 existing primarily in SS13.6 (blue in Table 2). The formation of successive structures and several important parameters can be followed in detail from the computer output in Table 2. The majority of highly mutable bases 5′ of and in CDR1 occur in segments of unpaired bases in SS17.0 (red) and SS11.9 (brown), whereas 5′ of and in CDR2, SS17.0 (red), SS13.6 (blue) and SS12.5 (green) contain most of the mutable bases. In spite of the complicated SS interactions in VH94, the rapid decrease in 30 nt SS stabilities relative to those in 65 nt SSs (Fig. 2B and C) is much like that in VH5 (Fig. 1B and C), and there is a significant correlation between increased levels of SS stability and predicted base mutability in CDR2 (Figs. 2D–F). As in VH5 (Fig. 1G), VH94 shows a correlation between regions of high mutation frequency and low −ΔG SSs at low levels of transcription (Fig. 2G) and mutable sites appear 5′ to 3′ during affinity maturation (Fig. 2H).
Fig. 2. Stability profiles of SSs formed at different levels of transcription in VH94.
(A) The four primary SSs containing unpaired mutable bases in the sequence segments that include CDR1 and CDR2, using a 65 nt window. One location for each structure is arrowed in the sequence, and mutable bases are encapsulated by lines (see Table 2). (B) Stability profiles of SS formed using windows of 65, 50, and 30 nts. (C) Three 30 nt SSs formed 5′ to 3′ during transcription. (D–H) Data are depicted as in Fig. 1.
Table 2.
Computer output of nt 85–183 in VH94 derived from mfg analysis using a 65nt window
| nt | number | Base | Foldb | −ΔGa | % unpaired | mutations | |
|---|---|---|---|---|---|---|---|
| 85 | A | 85–149 | −16.7 | 61 | 14 | ||
| 86 | T | 86–150 | −17.0b | 66 | 4 | ||
| 87 | C | 87–151 | −17.0b | 47 | 5 | ||
| 88 | A | 88–152 | −17.0b | 41 | 10 | ||
| 89 | G | 89–153 | −17.0b | 49 | 25 | ||
| 90 | C | 64–128 | −15.7 | 32 | 22 | ||
| 91 | A | 77–141 | −14.4 | 18 | 10 | ||
| 92 | G | 32–96 | −8.1 | 12 | 26 | ||
| 93 | T | 93–157 | −13.5 | 15 | 22 | ||
| 94 | A | 30–94 | −11.3 | 13 | 27 | ||
| 95 | G | 95–159 | −11.9 | 15 | 40 | ||
| 96 | T | 96–160 | −11.9 | 15 | 18 | ||
| 97 | A | 86–150 | −17.0 | 93 | 27 | ||
| 98 | Site 1 | G | 87–151 | −17.0 | 93 | 60 | |
| 99 | T | 88–152 | −17.0 | 96 | 6 | ||
| 100 | T | 89–153 | −17.0 | 98 | 15 | ||
| 101 | A | 93–157 | −13.5 | 16 | 10 | ||
| 102 | C | 95–159 | −11.9 | 13 | 14 | ||
| 103 | T | 96–160 | −11.9 | 13 | 3 | ||
| 104 | A | 97–161 | −11.2 | 13 | 13 | ||
| 105 | C | 98–162 | −11.2 | 13 | 4 | ||
| 106 | T | 77–141 | −14.4 | 20 | 2 | ||
| 107 | G | 80–144 | −16.4 | 44 | 1 | ||
| 108 | G | 86–150 | −17.0 | 78 | 0 | ||
| 109 | G | 87–151 | −17.0 | 76 | 3 | ||
| 110 | G | 88–152 | −17.0 | 58 | 16 | ||
| 111 | Site 2 | C | 89–153 | −17.0 | 58 | 4 | |
| 112 | T | 89–153 | −17.0 | 46 | 1 | ||
| 113 | G | 89–153 | −17.0 | 46 | 0 | ||
| 114 | G | 89–153 | −17.0 | 64 | 0 | ||
| 115 | A | 80–144 | −16.4 | 40 | 16 | ||
| 116 | T | 79–143 | −16.6 | 52 | 0 | ||
| 117 | C | 80–144 | −16.4 | 40 | 5 | ||
| 118 | C | 81–145 | −16.4 | 40 | 0 | ||
| 119 | G | 79–143 | −16.6 | 43 | 0 | ||
| 120 | C | 56–120 | −8.1 | 1 | 2 | ||
| 121 | C | - | - | - | 0 | ||
| 122 | A | 75–139 | −14.7 | 4 | 1 | ||
| 123 | G | - | - | - | 1 | ||
| 124 | C | 60–124 | −12.6 | 3 | 15 | ||
| 125 | C | - | - | - | 1 | ||
| 126 | C | 126–190 | −5.8 | 1 | 0 | ||
| 127 | C | - | - | - | 1 | ||
| 128 | C | 86–150 | −17.0 | 93 | 1 | ||
| 129 | A | 87–151 | −17.0 | 96 | 12 | ||
| 130 | G | 88–152 | −17.0 | 93 | 2 | ||
| 131 | Site 3 | G | 89–153 | −17.0 | 93 | 5 | |
| 132 | G | 89–153 | −17.0 | 93 | 7 | ||
| 133 | A | 89–153 | −17.0 | 93 | 4 | ||
| 134 | A | 89–153 | −17.0 | 95 | 4 | ||
| 135 | G | 71–135 | −15.7 | 12 | 1 | ||
| 136 | G | 72–136 | −15.7 | 12 | 2 | ||
| 137 | G | 73–137 | −15.7 | 12 | 1 | ||
| 138 | G | 74–138 | −15.2 | 18 | 29 | ||
| 139 | C | 77–141 | −14.4 | 10 | 0 | ||
| 140 | T | 76–142 | −14.6 | 13 | 2 | ||
| 141 | G | 77–143 | −14.4 | 18 | 1 | ||
| 142 | G | 121–185 | −10.5 | 15 | 2 | ||
| 143 | Site 4 | A | 86–150 | −17.0 | 83 | 6 | |
| 144 | G | 87–151 | −17.0 | 83 | 11 | ||
| 145 | T | 81–145 | −16.4 | 41 | 0 | ||
| 146 | G | 82–146 | −16.4 | 30 | 4 | ||
| 147 | G | 83–147 | −16.4 | 35 | 5 | ||
| 148 | A | 84–148 | −16.4 | 41 | 5 | ||
| 149 | T | 118–182 | −13.6 | 52 | 2 | ||
| 150 | T | 86–150 | −17.0 | 100 | 2 | ||
| 151 | Site 5 | G | 87–151 | −17.0 | 73 | 1 | |
| 152 | G | 88–152 | −17.0 | 73 | 12 | ||
| 153 | G | 89–153 | −17.0 | 73 | 14 | ||
| 154 | A | 90–154 | −16.2 | 84 | 9 | ||
| 155 | G | 91–155 | −14.8 | 89 | 35 | ||
| 156 | T | 92–156 | −13.6 | 89 | 9 | ||
| 157 | A | 118–182 | −13.6 | 100 | 11 | ||
| 158 | T | 119–183 | −13.6 | 100 | 3 | ||
| 159 | C | 119–183 | −13.6 | 100 | 25 | ||
| 160 | Site 6 | T | 119–183 | −13.6 | 100 | 18 | |
| 161 | A | 119–183 | −13.6 | 100 | 26 | ||
| 162 | T | 119–183 | −13.6 | 100 | 3 | ||
| 163 | T | 119–183 | −13.6 | 100 | 18 | ||
| 164 | A | 119–183 | −13.6 | 100 | 10 | ||
| 165 | T | 119–183 | −13.6 | 80 | 16 | ||
| 166 | A | 113–177 | −12.5 | 29 | 10 | ||
| 167 | G | 103–167 | −11.2 | 15 | 21 | ||
| 168 | T | 104–168 | −11.2 | 15 | 5 | ||
| 169 | G | 105–169 | −11.2 | 10 | 2 | ||
| 170 |  |
G | 113–177 | −12.5 | 24 | 3 | |
| 171 | G | 114–178 | −12.5 | 24 | 20 | ||
| 172 | A | 118–182 | −13.6 | 95 | 16 | ||
| 173 | G | 119–183 | −13.6 | 100 | 48 | ||
| 174 | C | 119–183 | −13.6 | 86 | 19 | ||
| 175 | A | 119–183 | −13.6 | 86 | 11 | ||
| 176 | C | 167–231 | −3.3 | 15 | 4 | ||
| 177 | C | 113–177 | −12.5 | 23 | 14 | ||
| 178 | T | 114–178 | −12.5 | 23 | 18 | ||
| 179 | A | 115–179 | −11.9 | 23 | 7 | ||
| 180 | C | 116–180 | −11.8 | 23 | 15 | ||
| 181 | T | 178–242 | −3.5 | 23 | 7 | ||
| 182 | A | 118–182 | −13.6 | 69 | 7 | ||
| 183 | C | 119–183 | −13.6 | 78 | 4 | ||
The most stable SS in which each base is unpaired. The five mutable sites in SS17.0 are in red and some sites are also noted in less stable SSs (green, brown and blue).
SS17.0 pre is in bolded red.
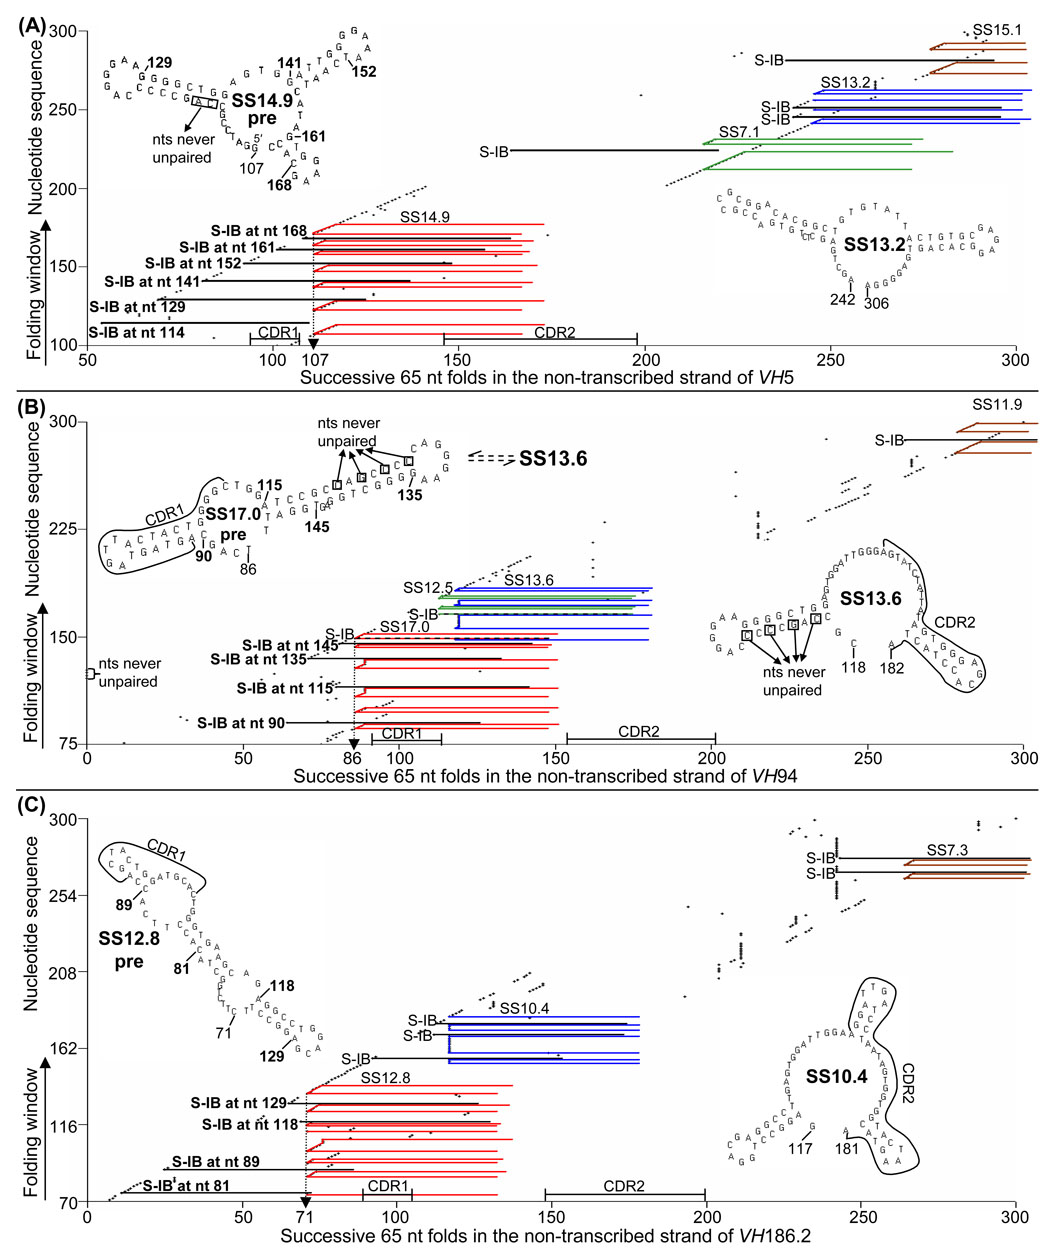
Fig. 5. S-IB using 65 nt folds of the non-transcribed strands of three VH genes.
(A) S-IB in the sequence including SS14.9 pre and SS13.2 in the variable region of VH5. SS14.9 pre is the most stable SS in which each base at each mutable site is unpaired. Therefore, when the folding window reaches each site of unpaired bases (following S-IB at stems), formation of SS14.9 pre is initiated, beginning at nt 107 and proceeding for as many unpaired bases as exist at each site (see paper I). (B) S-IB in the sequence including two primary SSs in VH94. Colors coordinate with those in Table 2. (C) S-IB in VH186.2. SS12.8 and SS10.4 inter-convert and provide the primary source of unpaired mutable bases in CDR1 and CDR2 of this gene.
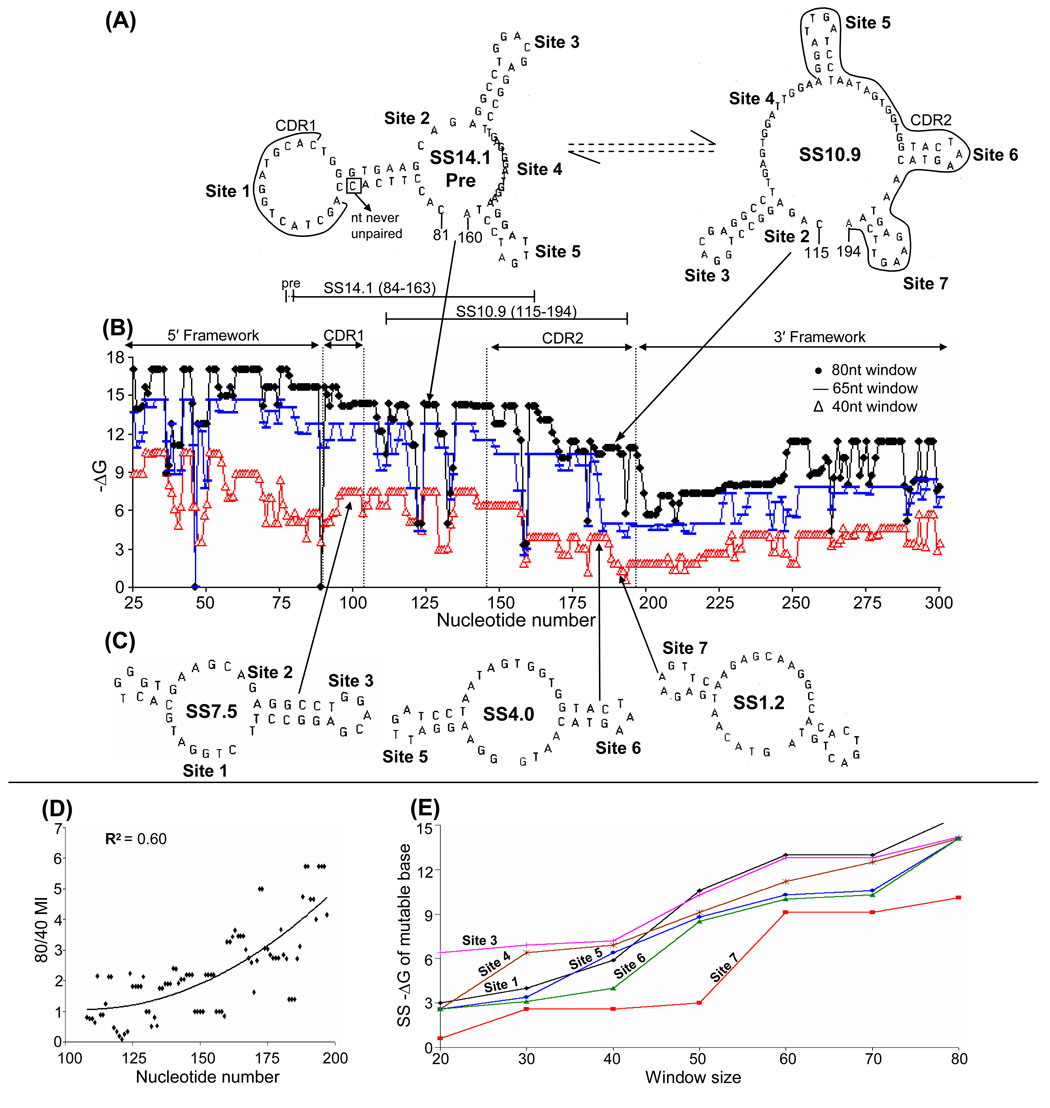
Although (to our knowledge) a database of high frequency mutations in VH186.2 is not available, we also analyzed some SS relationships in this gene (Fig. 3). Again, staggered stability profiles are seen in CDRs, and two major over-lapping SSs, SS14.1 pre and SS10.9, share mutable bases in CDR1 and CDR2. As discussed earlier, SSs lower than 40 nt could not be examined in this gene. Using 80 to 40 nt ratios, significant correlations were also found between increased SS stability and predicted base mutability (Fig. 3D), and mutable sites were formed 5′ to 3′ (Fig. 3E).
Fig. 3. Stability profiles of SSs formed at different levels of transcription in VH186.2.
(A) Two inter-converting SSs containing unpaired bases at sites in CDR1 and CDR2 using an 80 nt window. (B) Stability profiles of SSs formed using windows of 80, 65, and 40 nts. (C) Three successive SSs formed using a 40 nt window. (D) The predicted increase in base mutability (MI) as transcription levels and SS stabilities increase, 5′ to 3′. (E) The successive appearance of mutable sites as transcription levels and SS stabilities increase.
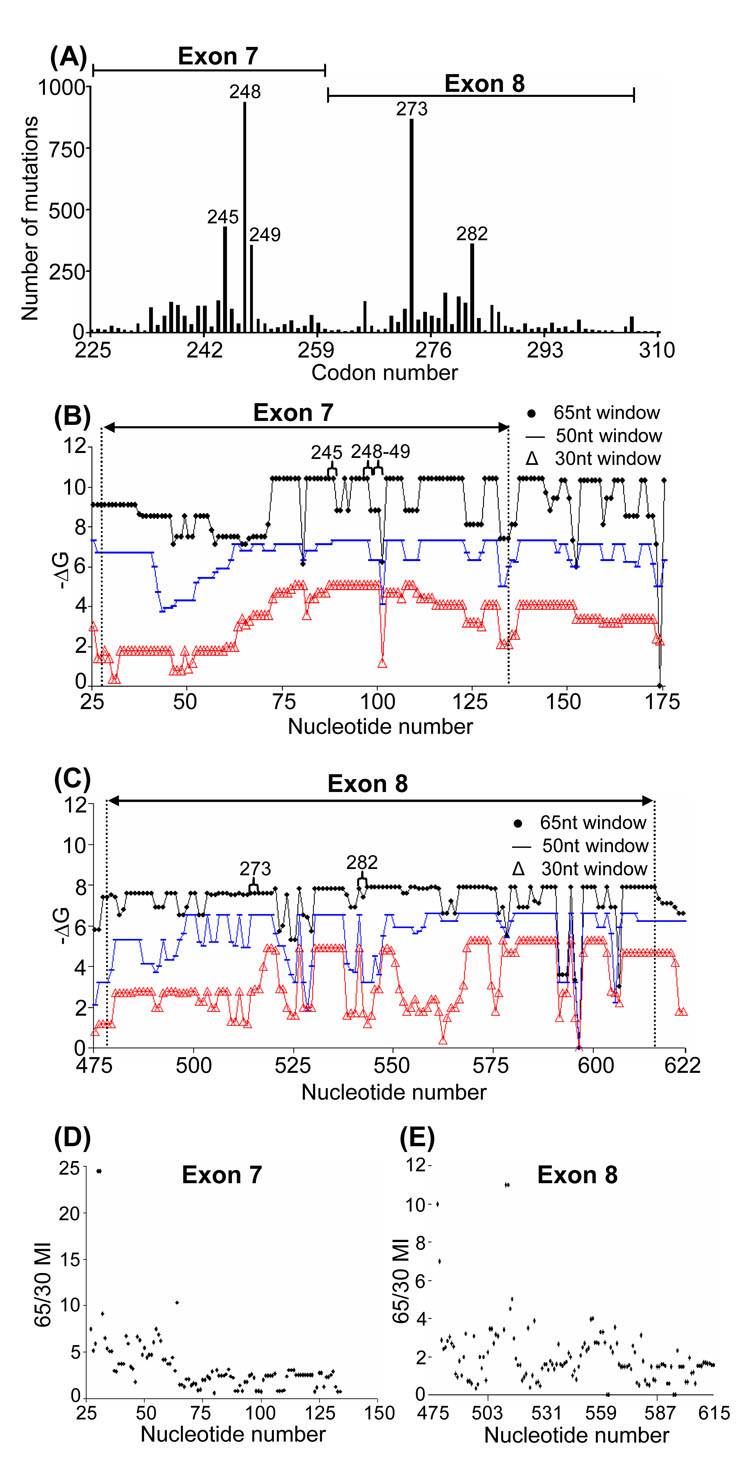
As a control in which coordinated mutagenesis does not occur, exons 7 and 8 of p53 were analyzed (Fig. 4), and no staggered profiles associated with the most mutable regions (codons 245, 248, 249, 273, and 282) were observed (Figs. 4B and C). Thus, there is no correlation between 65/30 nt −ΔG and the mutable sites (Fig. 4D, E). In this mutagenic system, mutation frequencies are directly correlated with base exposure (% unpaired) in SSs of p53 (Wright et al., 2002, 2006). Evidence suggests that genotoxins induce p53 transcription, which in turn increases the number of mutable Gs and Cs that determine the incidence of cancer (Wright et al., 2006).
Fig. 4. Stability profiles in the tumor suppressor gene p53.
(A) A mutability profile of p53 in Exons 7 and 8. (B) and (C) Stability profiles of SSs formed in Exons 7 and 8 during transcription using 65 (circles), 50 (lines), and 30 (triangles) nt window size. (D) and (E) The 65/30 predicted mutability (MI) ratio in Exons 7 and 8 during transcription. No correlation is seen.
Background mutations in the lacI gene of E. coli also serve as an excellent negative control, as they occur under circumstances in which all mutations have equal probabilities of being detected and sequenced (Schaaper and Dunn, 1991). This mutable sequence has been analyzed by mfg (Wright et al., 2003), and there is no correlation between SS stability and mutation frequency. Thus, staggered SS stability profiles in CDRs of V genes may be unique, and critical for defining the sequence of unpaired bases in CDRs that become highly mutable in response to increasing levels of transcription (see Discussion).
3.2. Localization of S-IB in variable region VH genes
Paper I presents an analysis of the mechanism of S-IB in VH5 (Paper I; Fig. 3). The present paper extends this analysis to include two more VH genes and compares the location of S-IB in VH5, VH94 and VH186.2. In VH5, SS14.9 pre (and its repetitive formation) is by far the most dominant SS that has evolved in this 300 nt sequence (Fig. 5A). The complexity of mutagenesis and S-IB in VH94 (Fig. 5B) is due to inter-conversions among four SSs, two of which (SS17.0 pre and SS11.9) are associated with mutagenesis in CDR1, while SS13.6 and SS12.5 contribute unpaired bases for mutagenesis in CDR2 (Fig. 2A and Fig. 5B). Because SSs 17.0 pre and 13.6 share nts in VH94, it is very difficult to follow the consequences of S-IB, especially in SS13.6. In VH186.2 (Fig. 5C), which has only one 5′ base preceding the stem, resulting in a series of folds in the vertical direction at each unpaired base of the structure. However, in the ~300 nt sequences of VH5, VH94, and VH186.2, the SSs described appear to be primary for regulating mutagenesis in CDRs of these genes. Note the gap in structure formations following CDR2 and the location of the dominant SSs.
4. Discussion
The endless variety of foreign antigens capable of initiating an immune response and the specificity of antibodies produced in response to antigen challenge attest to the extreme complexity of mechanisms that result, over time, in specific patterns of gain-of-function mutations creating higher affinity antibodies. It is fascinating to find that, in spite of the complex network of SS interactions in VH94 compared to VH5, both gene sequences show staggered SS stability profiles, inverse correlations between mutable sites and SS stabilities (Fig. 1G and Fig. 2G) and a linear order of mutable site appearances (Fig. 1H and Fig. 2H). This similarity suggests that the above relationships are of key importance to a successful outcome of coordinated mutagenesis, and that the evolution of such complex SS inter-conversions in VH94 was necessary for achieving relationships that result in high affinity antibodies.
The following mechanisms in VH genes have been observed and are considered to be essential to SHM and affinity maturation:
1) First and foremost, the DNA sequence of each VH gene, specifying the pattern and stability of SSs at all levels of transcription, which in turn determines which bases are unpaired, their associated intrinsic instability, and their location in SSs formed at each level of transcription. By encoded alterations in stem length and stability in small SSs at low levels of transcription, the DNA sequence of VH genes has evolved “staggered” SS stability profiles in CDRs. This results in the successive formation of mutable sites, 5′ to 3′, as transcription levels increase;
2) The enhancer-induced ~10,000-fold increase in transcription level following antigen challenge could increase supercoiling, SS formation, base exposure and result in the million-fold increase in mutation frequency observed in CDRs. Data indicate that this increased mutation frequency is not caused by enzyme catalysts, which are usually in great excess in vivo, and that mutation frequency is determined by substrate availability (Krebs, 1957). Moreover, there is a direct correlation between transcription levels and mutation frequency during SHM, and transcription-directed mutagenesis has been observed in a number of systems. Following the major increase in mutation frequency characterizing SHM, both intrinsic base mutability and superimposed enzyme-based mutagenesis would provide the variability essential to coordinated mutagenesis and affinity maturation;
3) The increase in SS stability and predicted mutability, 5′ to 3′ with increasing levels of transcription, localizes and directs mutagenesis to one mutable site at a time, thus limiting the difficult task of coordinating mutagenesis to a fraction of the dominant SS at successive points in time;
4) The mechanism of S-IB puts the folding process on hold, while repeating and increasing base exposure and mutability over time, 5′ to 3′. Most importantly, S-IB allows new explorations that maximize coordinated mutagenesis between multiple SSs, thus increasing variability and allowing refinements at each mutable site to achieve the optimal pattern of mutations.
As discussed earlier, evidence from many investigations cited in the literature indicate that higher levels of transcription increase mutation frequency in antibody genes, due to the enhanced availability of ssDNA and SSs containing mutable sites of unpaired bases. The work of Bachl et al. (2001) clearly demonstrates the enhancing effect that increasing (induced) levels of transcription have on mutation frequencies. Evidence has now been found for a new mechanism, perhaps unique to VH gene sequences, by which increased levels of transcription and base mutability become localized to CDRs. In VH5, for example, encoded differences in stem length and composition at low levels of transcription result in very low SS stabilities in CDR2 (Fig. 1). [In reality, lower levels of transcription and SS stability exist, but cannot be analyzed by mfg]. Thus, at nt 175 in this sequence, striking increases in SS stability and base mutability can occur as compared to nt 110, at which the increase is less than 2-fold. In VH94 and VH186.2, consistently low stability SSs are also found in CDR2 (Fig. 2 and Fig. 3). These circumstances result in the successive formation of mutable sites as transcription levels increase (Fig. 1H, Fig. 2H and Fig. 3E) and in the maintenance of a mutable site once it has been formed. For example, Site 1 is the first to form in VH5 and exists at all higher levels of transcription, while Site 6 is the last to form, and exists only at high levels of transcription. It follows that coordinated mutagenesis is localized to successive Sites as they appear at increasing levels of transcription during affinity maturation.
As transcription levels correlate directly with mutation frequencies, increased mutagenesis should occur over time, 5′ to 3′ from CDR1 to CDR2. The data of Ronai et al., (2007) and the mechanism of S-IB are both consistent with the first and repetitive appearance, 5′ to 3′, of Site 1 (12 times) during transcription, while Site 6 is available and mutable only 3 times (Paper I; Fig. 4) during affinity maturation. Taken together, our data suggest that, as transcription levels increase during affinity maturation, mutation frequencies would first increase in CDR1, followed by CDR2 and CDR3. This hypothesis is supported by data showing accumulated, site-specific light-chain V region mutations over the course of the immune response (Berek and Milstein, 1987). These data are also in keeping with the polarity of SHM mutagenesis, where the intrinsic mutability of CDR1 is roughly twice that of CDR3 (Rada and Milstein, 2001).
Gain-of-function mutations that occur during SHM in immunoglobulin genes are primarily regulated by the stability of SSs in which they are unpaired. However, this type of regulation can only occur because unpaired bases at mutable sites have evolved to be highly unpaired at all levels of transcription. In sharp contrast, mutations in the p53 tumor suppressor gene simply inactivate the gene, and hypermutable codons have been selected as the most intrinsically mutable bases (Gs and Cs) at sites in SSs most likely to inactivate the gene when mutated; mutation frequency is primarily regulated by base exposure rather that SS stability. However, mutagenesis in both systems is determined by the location and exposure of intrinsically mutable bases in SSs dictated by gene sequence, transcription and supercoiling.
Acknowledgments
This research was funded by NIH grant R01CA099242 and the Stella Duncan Memorial Research Institute.
Footnotes
Publisher's Disclaimer: This is a PDF file of an unedited manuscript that has been accepted for publication. As a service to our customers we are providing this early version of the manuscript. The manuscript will undergo copyediting, typesetting, and review of the resulting proof before it is published in its final citable form. Please note that during the production process errors may be discovered which could affect the content, and all legal disclaimers that apply to the journal pertain.
References
- Bachl J, Carlson C, Gray-Schopfer V, Dessing M, Olsson C. Increased transcription levels induce higher mutation rates in a hypermutating cell line. J Immunol. 2001;166:5051–5057. doi: 10.4049/jimmunol.166.8.5051. [DOI] [PubMed] [Google Scholar]
- Berek C, Milstein C. Mutation drift and repertoire shift in the maturation of the immune response. Immunol Rev. 1987;96:23–41. doi: 10.1111/j.1600-065x.1987.tb00507.x. [DOI] [PubMed] [Google Scholar]
- Krebs HA. Endeavour XVI. 1957:125. [Google Scholar]
- Rada C, Milstein C. The intrinsic hypermutability of antibody heavy and light chain genes decays exponentially. Embo J. 2001;20:4570–4576. doi: 10.1093/emboj/20.16.4570. [DOI] [PMC free article] [PubMed] [Google Scholar]
- Reimers JM, Schmidt KH, Longacre A, Reschke DK, Wright BE. Increased transcription rates correlate with increased reversion rates in leuB and argH Escherichia coli auxotrophs. Microbiology. 2004;150:1457–1466. doi: 10.1099/mic.0.26954-0. [DOI] [PubMed] [Google Scholar]
- Ronai D, Iglesias-Ussel MD, Fan M, Li Z, Martin A, Scharff MD. Detection of chromatin-associated single-stranded DNA in regions targeted for somatic hypermutation. J Exp Med. 2007;204:181–190. doi: 10.1084/jem.20062032. [DOI] [PMC free article] [PubMed] [Google Scholar]
- Schaaper RM, Dunn RL. Spontaneous mutation in the Escherichia coli lacI gene. Genetics. 1991;129:317–326. doi: 10.1093/genetics/129.2.317. [DOI] [PMC free article] [PubMed] [Google Scholar]
- Siekevitz M, Kocks C, Rajewsky K, Dildrop R. Analysis of somatic mutation and class switching in naive and memory B cells generating adoptive primary and secondary responses. Cell. 1987;48:757–770. doi: 10.1016/0092-8674(87)90073-0. [DOI] [PubMed] [Google Scholar]
- Wright B, Reimers J, Schmidt K, Burkala E, Davis N, Wei P. Mechanisms of genotoxin-induced transcription and hypermutation in p53. Cancer Cell Int. 2006;6:27. doi: 10.1186/1475-2867-6-27. [DOI] [PMC free article] [PubMed] [Google Scholar]
- Wright BE, Reimers JM, Schmidt KH, Reschke DK. Hypermutable bases in the p53 cancer gene are at vulnerable positions in DNA secondary structures. Cancer Res. 2002;62:5641–5644. [PubMed] [Google Scholar]
- Wright BE, Reschke DK, Schmidt KH, Reimers JM, Knight W. Predicting mutation frequencies in stem-loop structures of derepressed genes: implications for evolution. Mol Microbiol. 2003;48:429–441. doi: 10.1046/j.1365-2958.2003.t01-1-03436.x. [DOI] [PubMed] [Google Scholar]
- Wright BE, Schmidt KH, Minnick MF. Mechanisms by which transcription can regulate somatic hypermutation. Genes Immun. 2004;5:176–182. doi: 10.1038/sj.gene.6364053. [DOI] [PubMed] [Google Scholar]
- Zheng NY, Wilson K, Jared M, Wilson PC. Intricate targeting of immunoglobulin somatic hypermutation maximizes the efficiency of affinity maturation. J Exp Med. 2005;201:1467–1478. doi: 10.1084/jem.20042483. [DOI] [PMC free article] [PubMed] [Google Scholar]


