Abstract
The current gold standard for the diagnosis and staging of hand–arm vibration syndrome (HAVS) is the Stockholm workshop scale, which is subjective and relies on the patient’s recalling ability and honesty. Therefore, great potentials exist for diagnostic and staging errors. The purpose of this study is to determine if objective serum tests, such as levels of soluble thrombomodulin (sTM) and soluble intercellular adhesion molecule-1 (sICAM-1), may be used in the diagnosis and staging of HAVS. Twenty two nonsmokers were divided into a control group (n = 11) and a vibration group (n = 11). The control group included subjects without history of frequent vibrating tool use. The vibration group included construction workers with average vibrating tool use of 12.2 years. All were classified according to the Stockholm workshop scale (SN, sensorineural symptoms; V, vascular symptoms. SN0, no numbness; SN1, intermittent numbness; SN2, reduced sensory perception; SN3, reduced tactile discrimination; V0, no vasospasmic attacks; V1, intermittent vasospasm involving distal phalanges; V2, intermittent vasospasm extending to middle phalanges; V3, intermittent vasospasm extending to proximal phalanges; V4, skin atrophy/necrosis). All control subjects were SN0 V0. Seven out of 11 vibration subjects were SN1 V1, and 4 out of 11 were SN1 V2. A 10-cm3 sample of venous blood was collected from each subject. The sTM and sICAM-1 levels were determined by enzyme-linked immunosorbent assay. The mean plasma sTM levels were as follows: control group = 2.93 ± 0.47 ng/ml, and vibration group = 3.61 ± 0.24 ng/ml. The mean plasma sICAM-1 levels were as follows: control group = 218.8 ± 54.1 ng/ml, and vibration group = 300.3 ± 53.2 ng/ml. The sTM and sICAM-1 differences between control and vibration groups were statistically significant (p < 0.0002 and p < 0.001, respectively). When reference ranges provided by Hemostasis Reference Lab were used as cut-off values, all sTM and sICAM-1 levels were within range, except three vibration individuals (27%) who had sICAM-1 levels greater than the reference range. This was not statistically significant (p = 0.08). When subjects were compared based on the Stockholm workshop scale, mean plasma sTM levels were SN0 V0 group = 2.93 ± 0.47 ng/ml, SN1 V1 group = 3.59 ± 0.25 ng/ml, and SN1 V2 group = 3.65 ± 0.27 ng/ml, and mean plasma sICAM-1 levels were SN0 V0 = 219 ± 54.1 ng/ml, SN1 V1 = 275 ± 33.5 ng/ml, and SN1 V2 = 345 ± 54.6 ng/ml. The difference in sTM level among the three groups was statistically significant (p < 0.001). The difference in sICAM-1 level among the three groups was also statistically significant (p < 0.002). The sTM and sICAM-1 levels are statistically higher in subjects with HAVS, with levels proportional to the disease severity. However, large population studies are needed to determine the “real-life” standard reference ranges for sTM and sICAM-1.
Keywords: Diagnostic test, Hand–arm vibration syndrome (HAVS), Serology, Soluble intercellular adhesion molecule, Thrombomodulin
Introduction
Hand–arm vibration syndrome (HAVS) is a well documented condition resulting from chronic hand-held vibrating tool use. It is a progressive disease with three components: (1) circulatory disturbances (vasospasm resulting in finger blanching), (2) sensory and motor nerve damage (tingling, numbness, loss of finger coordination and hand dexterity), and (3) musculoskeletal disorders (muscle, bone, or joint changes). Epidemiological data presented at the 1986 Stockholm Workshop resulted in the formulation of the Stockholm workshop scale, which is the current “gold standard” for the diagnosis and staging of HAVS.
The Faculty of Occupational Medicine and the Health and Safety Executive in the United Kingdom have recommended that individuals should not be allowed to progress to stage 3 of the Stockholm scale. Occupational change is advised whenever progression into stage 3 is detected. Consequently, accurate diagnosis and staging are crucial. However, with the Stockholm workshop scale being heavily dependent on the patient’s ability to recall and willingness to be honest, there are great potentials for diagnostic and staging error. Even if accurate recall is possible, the medico-legal environment may encourage exaggeration by the claimant, whereas, in the occupational setting, the worker may choose to minimize symptoms to prevent job termination. Therefore, disease diagnosis and staging should be based on objective data. It would be ideal if there were serum markers that could be used for diagnosing and staging HAVS because they are objective and can be used to correlate or refute the history provided by the individual. Several serum markers, such as soluble thrombomodulin (sTM) and soluble intercellular adhesion molecule-1 (sICAM-1), have been investigated for potential use in the diagnosis of HAVS.
TM is a surface glycoprotein of vascular endothelial cells. It acts as a cell surface receptor for thrombin and converts thrombin from its procoagulant form into the activator of protein C. Once activated protein C is generated, TM acts as a major anticoagulant by inactivating factors Va, VIIIa, Xa, and XIIIa [2]. Soluble TM is thought to be a degradation product released from damaged or injured vascular endothelium, and an increase in its plasma level reflects increased endothelial damage [5]. Similarly, intercellular adhesion molecule-1 (ICAM-1) is a surface molecule basally expressed on endothelial cells and monocytes. ICAM-1 also exists in soluble forms in the circulation, known as sICAM-1. Increased level of sICAM-1 has not only been associated with increased endothelial injury but has also been reported in a variety of disorders, such as connective tissue disease [3].
Previous studies have separately evaluated the levels of sTM and sICAM-1 in HAVS patients and normal subjects. Studies by Kanazuka et al. and Toibana et al. have both found elevated levels of sTM in HAVS patients [6, 13]. Furthermore, a study by Kennedy et al. has shown higher sICAM-1 levels in HAVS patients [7]. However, in a later study, Kurozawa et al. reported no difference in sICAM-1 levels between normal and HAVS subjects [8]. The purpose of this study is to investigate the levels of both sTM and sICAM-1 in HAVS patients and to determine if they have any potential diagnostic and staging applications.
Materials and Methods
Subjects
A total of 22 nonsmoking volunteers were recruited and designated into two groups depending on history of vibrating tool use—control group (n = 11) and vibration group (n = 11). The research protocol was approved by the institutional review board. Informed consent and Health Insurance Portability and Accountability consent were obtained from each volunteer. The control group consists of six males and five females aged 20 to 50 years old (mean = 38.5 years). This group included students, nurses, secretaries, and physicians with no history of frequent vibrating tool use. The vibration group consists of construction workers, nine males and two females aged between 17 and 65 years (mean = 39 years) with a history of frequent vibrating tool use varying from 3.5 to 35 years (mean = 12.2 years). A pre-enrollment survey showed control subjects with no symptoms, whereas each vibration subject had at least four symptoms associated with vibrating tool use, including finger numbness, tingling, weakness, pain, coldness, and color changes. All subjects were classified according to the Stockholm workshop scale (SN, sensorineural, and V, vascular). All subjects in the control group were SN0 V0. In the vibration group, 7 out of 11 (64%) subjects were SN1 V1 and 4 out of 11 (36%) were SN1 V2. Based on patient interview and patient-completed questionnaire, none of the subjects reported family history or past medical history of connective tissue disease or primary Raynoud’s phenomena. All subjects also denied having history of hepatitis or liver or kidney failure.
Blood Samples
A 10-cm3 venous blood sample was collected from each subject by a licensed phlebotomist from the antecubital fossa using a 21-gauge needle. Light tourniquet pressure was applied in all subjects to assist venepuncture. Blood was collected into tubes containing clotting beads with no anticoagulant present and placed into a 37°C water bath for 1 h. The specimens were then centrifuged for 15 min at 3,500 rpm, after which, the serum was removed, aliquoted, and stored at −80°C until all the samples were collected. All blood samples were collected approximately at the same time of day to avoid the effects of circadian variations on sICAM-1 levels [9]. After completion of specimen collection from all subjects, the samples were sent to Hemostasis Reference Lab at Henderson Research Center (Ontario, Canada) for analysis of sTM and sICAM-1. The levels were determined by enzyme-linked immunosorbent assay. All reference levels were provided by the Hemostasis Reference Lab.
Statistical Analysis
The group average of each serum marker was calculated and reported as mean ± standard deviation (SD). Range for 95% confidence interval was included in parentheses following mean ± SD.
First, the subjects were divided into control and vibration groups. The group averages of sTM were compared using the Student’s t test to determine if any statistical significant difference existed. In addition, the percentages of subjects with sTM level outside the standard reference range for control and vibration groups were calculated and compared using the Student’s t test. Secondly, the subjects were divided into three groups based on their classification on the Stockholm workshop scale (SN0 V0, SN1 V1, or SN1 V2). The group averages of sTM were compared using the ANOVA test.
The levels of sICAM-1 were analyzed in the same fashion as sTM. All p values less than 0.05 were accepted as significant. Statistical analyses were performed using SPSS software (SPSS, Chicago, IL, USA).
Results
The levels of sTM and sICAM-1 for each individual, as well as their HAVS staging according the Stockholm Workshop Scale, are summarized in Table 1.
Table 1.
sICAM-1 and sTM levels (control vs. vibration).
| Patient | sICAM-1 (Reference: 132.5–344.1 ng/ml) | sTM (Reference: 3.01–4.11 ng/ml) | Stockholm Workshop Scale |
|---|---|---|---|
| Control 1 | 209.7 | 2.27 | SN0 V0 |
| Control 2 | 185.2 | 3.04 | SN0 V0 |
| Control 3 | 285.5 | 2.32 | SN0 V0 |
| Control 4 | 151.0 | 2.57 | SN0 V0 |
| Control 5 | 197.1 | 2.95 | SN0 V0 |
| Control 6 | 214.2 | 2.88 | SN0 V0 |
| Control 7 | 321.8 | 2.49 | SN0 V0 |
| Control 8 | 278.3 | 3.40 | SN0 V0 |
| Control 9 | 217.6 | 3.54 | SN0 V0 |
| Control 10 | 163.9 | 3.17 | SN0 V0 |
| Control 11 | 182.5 | 3.57 | SN0 V0 |
| Vibration 1 | 310.6 | 3.36 | SN1 V1 |
| Vibration 2 | 242.0 | 3.70 | SN1 V1 |
| Vibration 3 | 240.5 | 3.53 | SN1 V1 |
| Vibration 4 | 245.2 | 3.73 | SN1 V1 |
| Vibration 5 | 267.7 | 3.91 | SN1 V1 |
| Vibration 6 | 306.0 | 3.19 | SN1 V1 |
| Vibration 7 | 310.8 | 3.69 | SN1 V1 |
| Vibration 8 | 385.2 | 3.66 | SN1 V2 |
| Vibration 9 | 267.6 | 3.30 | SN1 V2 |
| Vibration 10 | 346.4 | 3.97 | SN1 V2 |
| Vibration 11 | 381.4 | 3.65 | SN1 V2 |
Stockholm Workshop Scale (SN = sensorineural, V = vascular). SN0, no symptoms; SN1, intermittent numbness or tingling; SN2, intermittent or persistent numbness, reduced sensory perception; SN3, intermittent or persistent numbness, reduced tactile discrimination; V0, no attacks; V1, occasional attacks affecting only finger tips; V2, occasional attacks affecting distal/middle phalanges; V3, frequent attacks affecting all phalanges; V4, stage 3 with skin changes in finger tips
Soluble Thrombomodulin
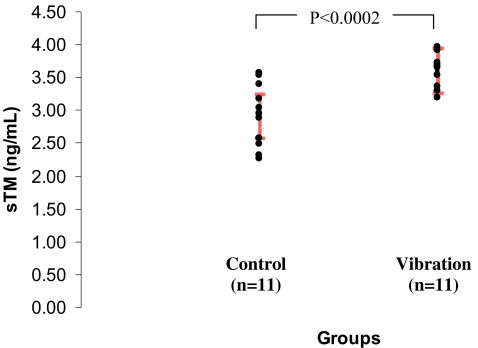
The standard reference range is 3.01–4.11 ng/ml. The mean plasma level was 2.93 ± 0.47 ng/ml (2.61–3.25 ng/ml) in the control group and 3.61 ± 0.24 ng/ml (3.45–3.77 ng/ml) in the vibration group. The difference between control and vibration groups was statistically significant (p < 0.0002, Fig. 1). However, despite the higher mean sTM level in the vibration group, all subjects in both control and vibration groups were within the reference range (3.01–4.11 ng/ml).
Figure 1.
Plasma concentration of sTM in control and vibration subjects. Red bars indicate group means ± 95% confidence intervals.
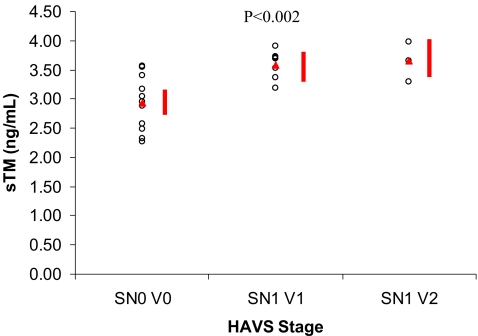
When the subjects were compared based on Stockholm workshop scale classification, the mean plasma level was 2.93 ± 0.47 ng/ml (2.69–3.17 ng/ml) for the SN0 V0 group, 3.59 ± 0.25 ng/ml (3.28–3.89 ng/ml) for the SN1 V1 group, and 3.65 ± 0.27 ng/ml (3.24–4.05 ng/ml) for the SN1 V2 group. The difference between the three groups was statistically significant (p < 0.002, Fig. 2).
Figure 2.
Plasma concentration of sTM in groups classified according to the Stockholm Workshop Scale. Red triangles indicate group means. Red bars indicate group means ± 95% confidence intervals.
Soluble Intercellular Adhesion Molecule-1
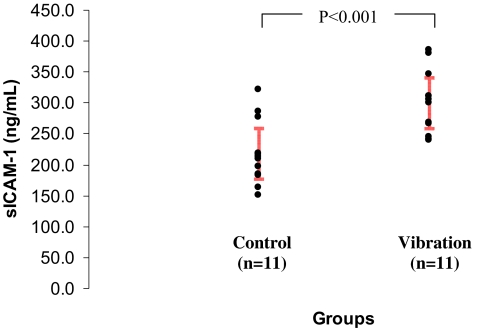
The standard reference range is 132.5–344.2 ng/ml. When the subjects were divided into control and vibration groups, the mean plasma level was 218.8 ± 54.1 ng/ml (182.5–255.1 ng/ml) in the control group and 300.3 ± 53.2 ng/ml (264.6–336.0 ng/ml) in the vibration group. The difference between control and vibration groups was statistically significant (p < 0.001, Fig. 3). All control subjects had levels within the reference range (132.5–344.2 ng/ml). In the vibration group, 27% (3 out of 11) of the subjects had sICAM-1 levels greater than the reference range (385.2, 346.4, and 381.4). However, this observed difference was not statistically significant (p = 0.08).
Figure 3.
Plasma concentration of sICAM-1 in control and vibration subjects. Red bars indicate group means ± 95% confidence intervals.
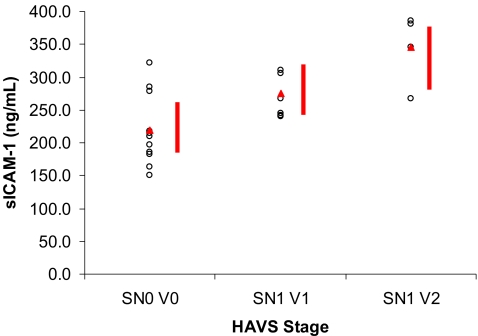
When the subjects were compared based on Stockholm workshop scale classification, the mean plasma level was 219 ± 54.1 ng/ml (188.1–249.5 ng/ml) for the SN0 V0 group, 275 ± 33.5 ng/ml (236.2–313.1 ng/ml) for the SN1 V1 group, and 345 ± 54.6 ng/ml (294.3–396.0 ng/ml) for the SN1 V2 group. The difference between the three groups was statistically significant (p < 0.001, Fig. 4).
Figure 4.
Plasma concentration of sICAM-1 in groups classified according to the Stockholm Workshop Scale. Red triangles indicate group means. Red bars indicate group means ± 95% confidence intervals.
Discussion
The main weakness of this study is its small sample size. Although some results showed statistical significance, the power of the study is limited. Additional studies involving larger sample size are needed to confirm our findings.
When comparing the group average of sTM and sICAM-1 levels in the control vs. the vibration group, each serum marker showed a difference with statistical significance. The vibration group had higher sTM and sICAM-1 group averages. However, when the values of sTM and sICAM-1 levels are compared on an individual basis, there is an overlap between the lower range of the vibration group and the upper range of the control group. For example, the highest sICAM-1 level in the control group (321.8 ng/ml) is higher than the lowest sICAM-1 level in the vibration group (240.2 ng/ml). This overlap zone creates a “gray area” when one attempts to determine whether or not a subject has HAVS, because the subject could be a “high normal” or a “low abnormal.” For this reason, we also evaluated the percentage of subjects that had sTM or sICAM-1 levels above the current reference range. With this approach, we observed a trend of higher percentage of vibration subjects (27% in vibration group vs. 0% in the control group) having sICAM-1 level above the reference range, although this was not statistically significant. No such trend was seen with sTM levels. These results raise the question of whether or not the reference ranges provided by the Hemostasis Reference Lab truly represent the population norm because neither sTM nor sICAM-1 are commonly ordered tests and the reference ranges are guidelines rather than population standards. The only way to determine the standard reference ranges for sTM and sICAM-1 that are reflective of the general population is through large population studies. For serum markers to be helpful in the diagnosis and staging of HAVS, standardized reference ranges are essential in order to provide “cut-off” values.
When subjects were grouped according to the Stockholm workshop scale, statistical significant differences in sTM and sICAM-1 levels were observed between groups. A trend of higher sTM and sICAM-1 levels in subjects with more severe HAVS staging was also seen. Yet again, due to the small sample size, this observed trend would need to be confirmed by additional studies with larger sample size. However, if such a trend is confirmed, it suggests the possibility of classifying a HAVS patient’s disease severity based on the plasma levels of sTM and sICAM-1, much like the Semmes–Weinstein monofilament test.
In interpreting the levels of sTM and sICAM-1, several points are worth remembering. First, although elevated sTM level has been widely associated with endothelial injury, compromised hepatic or renal function can also cause elevation in sTM levels due to decreased degradation and elimination. Diseases such as acute liver damage, chronic viral hepatitis, liver failure, and renal failure have all been documented to elevate sTM levels [1, 4, 10, 12, 14]. Therefore, high sTM levels do not always signify endothelial damage. Secondly, the levels of different serum markers may show circadian variations. In fact, sICAM-1 level peaks at noon and troughs at ∼4:00 a.m. [9]. Such finding stresses the importance of standardization of sample collection time.
The uncertainty of diagnosis and lack of uniformity in the examination of HAVS patients continue to be a challenge to physicians, employers, lawyers, and patients themselves. Numerous clinical and laboratory tests have been developed over the years to assist in evaluating the vascular, sensorineural, and musculoskeletal components of HAVS. These tests vary from very simple to highly sophisticated ones, and their use is dependent on many factors, such as cost, equipment availability, and the need for specialized personnel to administer the test. The initial screening examination may be limited to the use of a history questionnaire to determine symptoms and history of the vibration exposure, followed by a clinical examination of the upper torso and some simple subjective tests. However, questionnaires are susceptible to recall bias and intentional nondisclosure. Palmear et al. has found a very low rate of agreement between the history and the diagnostic Stockholm staging, ranging from 35 to 37% [11]. Hence, the patient’s history alone is not sufficient to stage disease severity, as patients may not disclose all their symptoms or may exaggerate some, especially when compensation is being sought. In addition, any test that requires a response from the subject (such as two-point discrimination test and Semmes–Weinstein monofilament test) will not be completely objective and will yield variable results depending on the subject’s concentration or honesty. Therefore, objective tests that are independent of subject voluntary response (e.g., nerve conduction study and serum tests) are more valuable in providing accurate and consistent diagnoses and disease staging. Serum tests are especially desirable because collection time, collection method, and laboratory analysis can easily be standardized without the need for specialized personnel (e.g., hand therapists) to perform the test.
Researchers have been looking for laboratory tests that are specific and sensitive for the diagnosis of HAVS. Yet, due to the multifactorial pathophysiology of HAVS and the multiple organ systems involved, a combination of multiple tests will likely be needed to capture the entire HAVS population. Both sTM and sICAM-1 are aimed to detect the vascular component of HAVS. As our understanding of the pathophysiology of HAVS evolves, other serum markers may be utilized to evaluate the sensorineural and musculoskeletal components of HAVS, as well as improve the diagnosis and staging accuracy of HAVS. Accurate diagnosis and staging of HAVS are not only useful in medico-legal cases and determining the timing of occupational change (when the disease progresses into stage 3), but they may also pave the way for early detection and eventual prevention of the disease.
Acknowledgement
This research is funded by NIOSH, grant # R01 OH03493.
References
- 1.Akiyama K, Kimura S, Makino I. Evaluation of plasma thrombomodulin levels in patients with liver disease. Nippon Shokakibyo Gakkai Zasshi 1992;89:2559–67. [PubMed]
- 2.Esmon CT. The roles of protein C and thrombomodulin in the regulation of blood coagulation. J Biol Chem 1989;264:4743–6. [PubMed]
- 3.Gearing AJH, Hemingway I, Pigott R. Soluble forms of vascular adhesion molecules, E-selectin, ICAM-1,VCAM-1: pathological significance. Ann N Y Acad Sci 1992;667:324–31. [DOI] [PubMed]
- 4.Hergesell O, Andrassy K, Geberth S, Nawroth P, Gabath S. Plasma thrombomodulin levels are dependent on renal function. Thromb Res 1993;72:455–8. [DOI] [PubMed]
- 5.Ishii H, Uchiyama H, Kazama M. Soluble thrombomodulin antigen in conditioned medium is increased by damage of endothelial cells. Thromb Haemost 1991;65:618–23. [PubMed]
- 6.Kanazuka M, Shigekiyo T, Toibana N, Saito S. Increase in plasma thrombomodulin level in patients with vibration syndrome. Thromb Res 1996;82:51–6. [DOI] [PubMed]
- 7.Kennedy G, Khan F, Mclaren M, Belch JJF. Endothelial activation and response in patients with hand arm vibration syndrome. Eur J Clin Invest 1999;29:577–81. [DOI] [PubMed]
- 8.Kurozawa Y, Nasu Y. Circulating adhesion molecules in patients with vibration-induced white finger. Angiology 2000;51:1003–6. [DOI] [PubMed]
- 9.Maple C, Kirk G, McLaren M, Belch JJF. A circadian variation exists for plasma levels on intercellular adhesion moledule-1 and E-selectin in healthy volunteers. Clin Sci 1998;94:537–40. [DOI] [PubMed]
- 10.Mezzano D, Tagle R, Pais E, Panes O, Perez M, Downey P, et al. Endothelial cell markers in chronic uremia: relationship with hemostatic defects and severity of renal failure. Thromb Res 1997;88:465–72. [DOI] [PubMed]
- 11.Pelmear PL, Kusiak R. Clinical assessment of hand–arm vibration syndrome. Nagoya J Med Sci 1994;57S:27–41. [PubMed]
- 12.Takatori M, Iwabuchi S, Ro S, Murayama M, Maeyama S, Uchikoshi T, et al. Increased serum levels and sinusoidal expression of thrombomodulin in acute liver damage. Thromb Res 1999;93:113–20. [DOI] [PubMed]
- 13.Toibana N, Kanazuka M, Shigekiyo T. High level of plasma thrombomodulin concentration and correlation with endothelin-1 in vibration-exposed patients. Cent Eur J Public Health 1995;3S:40–2. [PubMed]
- 14.Zeniya M, Fukata H, Toda G. Thrombomodulin expression of sinusoidal endothelial cells in chronic viral hepatitis. J Gastroenterol Hepatol 1995;10S:77–80. [DOI] [PubMed]


