Abstract
Reductive unfolding studies of proteins are designed to provide information about intramolecular interactions that govern the formation (and stabilization) of the native state and about folding/unfolding pathways. By mutating Tyr92 to G, A, or L in the model protein, bovine pancreatic ribonuclease A, and through analysis of temperature factors and molecular dynamics simulations of the crystal structures of these mutants, it is demonstrated that the markedly different reductive unfolding rates and pathways of ribonuclease A and its structural homologue onconase can be attributed to a single, localized, ring-stacking interaction between Tyr92 and Pro93 in the bovine variant. The fortuitous location of this specific stabilizing interaction in a disulfide-bond-containing loop region of ribonuclease A results in the localized modulation of protein dynamics which, in turn, enhances the susceptibility of the disulfide bond to reduction leading to an alteration in the reductive unfolding behavior of the homologues. These results have important implications for folding studies involving topological determinants to obtain folding/unfolding rates and pathways, for protein structure-function prediction through fold recognition, and for predicting proteolytic cleavage sites.
Introduction
Oxidative protein folding involves the concomitant formation of the native set of protein disulfide bonds through thiol-disulfide exchange reactions of its cysteines (and newly formed disulfide bonds) with an extrinsic redox reagent and conformational folding to yield a unique and stable three-dimensional structure.1–7 During this process, several folding intermediates, some with native-like structure, are found to populate the oxidative folding landscape.8 Understanding the intramolecular interactions that govern the formation of these intermediates would represent an important advance towards solving the protein-folding problem.9–12
Reductive unfolding, the converse of oxidative folding, is the process by which a disulfide-bond-containing protein loses its native structure (unfolds) through the (successive) reduction of its disulfide bonds.13–21 In reductive unfolding, protein disulfide bonds scattered throughout the macromolecular architecture can serve as reporter groups for probing local fluctuations within the folded polypeptide; these fluctuations eventually lead to the unfolding of the whole molecule.17 By assessing the relative susceptibilities of individual disulfide bonds to reduction by an extrinsic reducing agent such as dithiothreitol (DTTred), it is possible to determine whether a particular disulfide bond is preferentially reduced; the region in which the easily reducible disulfide bond resides is the most flexible one and, therefore, prone to unfolding. Furthermore, in a multi-disulfide-containing protein, if one or more disulfide bonds must be reduced before the protein unfolds, then the unfolding of those disulfide bonds is said to take place through local unfolding simply because the protein can still maintain a native-like structure in its absence; the free energy cost to unfold such disulfide bonds is usually much smaller than the global free energy to fully unfold the protein.17,20,21 Therefore, physiologically, reductive unfolding sites may represent locations in the protein susceptible to degradation by proteolytic enzymes. Finally, because reductive unfolding can sometimes be used to distinguish between essential disulfide bonds and non-essential ones (those disulfide bonds that only provide stability to the molecule),22 it is a useful tool in protein design. Examples of non-essential disulfides deduced through reductive unfolding studies include the (6–120) disulfide bond in α-lactalbumin which is easily reduced upon the application of mild reducing conditions to the native protein, resulting in the formation of a native-like three-disulfide-containing intermediate, des [6–120];14 the (6–127) disulfide bond in hen egg-white lysozyme;23 and the (40–95) and (65–72) disulfides in bovine pancreatic ribonuclease A (RNase A), the reduction of which lead to the formation of two three-disulfide-containing native-like intermediates, des [40–95] and des [65–72].17,24,25
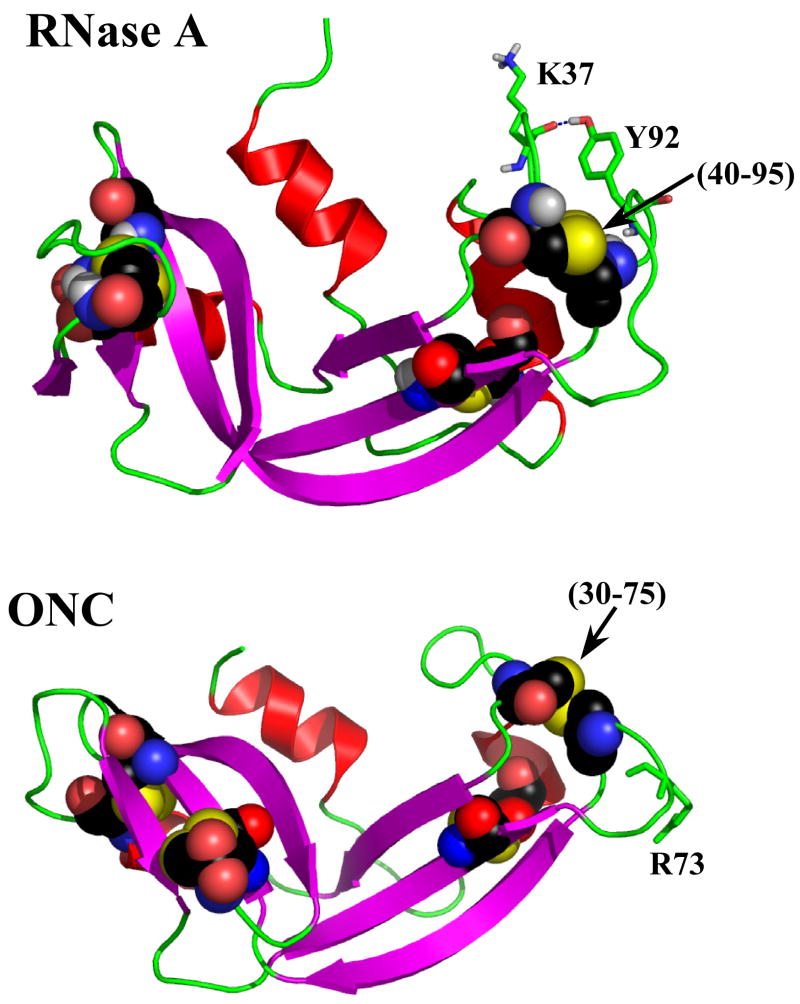
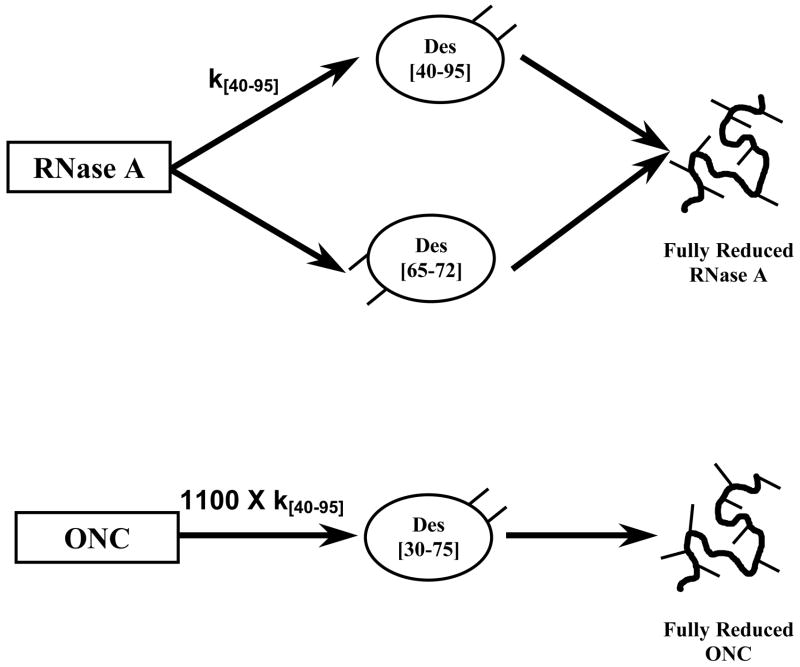
Interestingly, it has been noticed that the reductive unfolding pathways of two structurally homologous proteins can be very different as in wild-type (WT) RNase A and onconase (ONC), two structurally homologous members of the ribonuclease superfamily (Figure 1).20,21 Each homologue has four disulfide bonds, viz., (26–84), (40–95), (58–110) and (65–72) in RNase A, and (19–68), (30–75), (48–90) and (87–104) in ONC.26–30 Among the four pairs of disulfides, only (65–72) and (87–104) are not homologous. The reductive unfolding pathways of RNase A have been well-characterized in this laboratory (see scheme 1): the protein reductively unfolds through parallel pathways with the formation of two native-like three-disulfide-containing intermediates, des [40–95] and des [65–72], before forming the fully reduced species.17 On the other hand, ONC reductively unfolds through a single intermediate, des [30–75], before becoming fully reduced.20,21 Furthermore, the rate of reduction of the (30–75) disulfide bond in ONC is ~1100 times greater than the rate of reduction of the analogous (40–95) disulfide bond in RNase A.20
Figure 1.
Structures of WT RNase A (7RSA) and onconase (1ONC). All cysteines in each protein are depicted using the “space fill” representation in an element-based coloring format. Additionally, the (40–95) and (30–75) disulfide bonds which are homologous to each other are labeled. The Tyr92 and Lys37 in RNase A, and Arg73 in ONC are depicted using “stick” representation.
Scheme 1.
Schematic representation of the reductive unfolding pathways of RNase A and ONC. The thiols that are formed upon reduction of protein disulfides are shown as sticks.
An examination of the residues surrounding the homologous (40–95) and (30–75) disulfide bonds in RNase A and ONC reveals that Tyr92 in RNase A is fixed atop the (40–95) disulfide bond (through a ring-stacking interaction with the neighboring Pro93). The hydroxyl group of Tyr92 interacts with the carbonyl of Lys37 through a hydrogen bond (Figure 1). There is no moiety positioned over the (30–75) disulfide bond in ONC since Arg73, the sequence analogue of Tyr92, projects into the solvent (Figure 1). In this study, we have examined the reductive unfolding characteristics of Tyr92 to G, A, and L mutants of RNase A to assess the role of the ring-stacking interaction between Tyr92 and Pro93 in reductive unfolding of RNase A (and ONC). By further examination of the absence of this interaction in Y92G RNase A, we are able to account for the origin of the parallel reductive unfolding pathways of RNase A.
Our results demonstrate that the factor(s) responsible for the dissimilarity in the reductive unfolding pathways of familial proteins can hinge upon single, local anomalies irrespective of global structural similarities. In this case, an aromatic/non-aromatic interaction plays a pivotal role in stabilizing a disulfide-bond-containing region of a protein thereby dramatically influencing its dynamics and, through this, its unfolding behavior. While similar specific interactions are not uncommon features in structural biology,31,32 we believe that this is the first reported observation of an aromatic/non-aromatic interaction that profoundly impacts familial unfolding pathways. Our results have important implications for protein folding/unfolding rates and pathways predicted through topology analysis and for structure/function prediction through fold recognition.
Materials and Methods
Materials
Polymerase chain reaction (PCR) primers with designed mutation sites were ordered from Sigma-Genosys (Louis, MO). 2-aminoethylmethylthiosulfonate (AEMTS, greater than 99 % purity) was purchased from Anatrace (Maumee, OH). Reduced dithiothreitol (DTTred) was obtained from Sigma and used without further purification. All other chemicals were of the highest grade commercially available.
Construction of RNase A Mutants
The wild-type RNase A plasmid in a pET22b(+) vector was obtained from previous studies.33 Site-directed mutagenesis was carried out using PCR according to the procedure from the QuikChange® Site-Directed Mutagenesis Kit (Stratagene, La Jolla, CA). The sequences of all DNA expression vectors were determined by DNA sequencing at the Cornell Biotechnology Analytical Facility.
Protein Expression and Purification
The protein expression system and procedures used to produce RNase A mutants have been described previously.33 Proteins were purified on a C18 column using reversed-phase HPLC and then lyophilized to remove organic solvent and water. The molecular mass of each species was determined by mass spectroscopy.
Enzymatic Activity
The activities of WT RNase A and Y92G/A/L were determined as described previously.34,35 Briefly, the protein was added to a cuvette (1 cm path length) containing the substrate cCMP, and the change in extinction coefficient at 287 nm was monitored using a Cary-14 spectrophotometer. All measurements were made at 25 °C in a pH 5 buffer (50 mM sodium phosphate, 1 mM EDTA).
Thermal Transitions and GdnHCl Denaturation
The method used to monitor thermal denaturation has been described previously.33 All thermal transition curves were determined in 100 mM HEPES buffer with 1 mM EDTA at pH 8 using ~ 0.5 mg/ml protein. The GdnHCl denaturation experiments were carried out by sequential addition of a stock solution of GdnHCl (7.8 M) to the cuvette containing the protein solution (0.5 mg/ml protein in 100 mM Tris-HCl, 1 mM EDTA, pH 8). A water bath was used to maintain the temperature at 15 °C. Data were collected 5 mins after addition of the denaturant by averaging the absorbance recorded over a period of 1 min. The denaturation curves were plotted as the fractional concentration of protein versus denaturant concentration. The data were fitted to a sigmoidal function from which thermodynamic parameters could be estimated.36–38
All the absorbance measurements were made using 1.0 cm path-length quartz cells at a wavelength of 287 nm under sparging of highly pure nitrogen.
Crystallization of Native and Recombinant RNase’s and Data Collection
Recombinant RNase A was repurified on a MonoS cation-exchange column (Amersham Biosciences, Piscataway, NJ), extensively dialyzed against deionized water and filtered through a 0.1 micron filter prior to the crystallization setup. RNase A crystals were obtained from a concentrated RNase A solution (15–20 mg/ml in double distilled water) by the vapor diffusion method within two-three weeks using “hanging drop” experiments with 20–30 % saturated solution of (NH4)2SO4 and 2.5–3.5 M NaCl (50 mM sodium citrate buffer pH 4.6–5.2) at room temperature. For cryo-temperature data collection, the RNase A crystals were subject to flash cooling in liquid nitrogen.
The high-resolution data sets were collected at the Advanced Photon Source (APS) beamline 8 BM. The crystal to Quantum 315 CCD detector distance was 180 mm and the crystal was rotated around the spindle axis with images collected over 120° to a resolution of 1.6-1.3 Å. Data were integrated and scaled using the HKL2000 package.39 Unit cell parameters, details of data collection and refinement are presented in Table 1. The real resolution of the data, used for structure refinement, was estimated by taking into consideration the completeness of the last resolution shell, I/α ratio and R-merge values.
Table 1.
Details of data collection and refinement
| WT RNase A | Y92G | Y92A | Y92L | |
|---|---|---|---|---|
| space group | P3221 | P3221 | P42212 | P3221 |
|
| ||||
| unit (a) | 64.28 | 64.33 | 63.99 | 67.40 |
| cell (b) | 64.28 | 64.33 | 63.99 | 67.40 |
| (Å) (c) | 63.76 | 63.62 | 54.84 | 64.20 |
| γ | 120 | 120 | 90 | 120 |
|
| ||||
| R-merge (%)* | 4.2 (17.3) | 5.3 (36.0) | 6.2 (28.4) | 5.0 (15.3) |
|
| ||||
| % of reflections with I/σ > 2 in the highest resolution bin | 92.6 | 83.5 | 86.4 | 93.1 |
|
| ||||
| resolution limit for refinement | 1.3 | 1.5 | 1.5 | 1.45 |
|
| ||||
| completeness of data used for refinement (%) | 98.3 | 90.6 | 94.9 | 95.7 |
|
| ||||
| R-factor (%) | 20.6 | 21.6 | 21.6 | 19.3 |
|
| ||||
| number of water molecules | 185 | 144 | 181 | 209 |
|
| ||||
| protein B-factor (Å2) | 16.5 | 25.8 | 19.6 | 17.8 |
|
| ||||
| waters B-factor (Å2) | 27.8 | 31.1 | 34.7 | 28.9 |
The numbers in parentheses correspond to the data in the highest resolution bin that
were used for refinement.
Structure Model Refinement
Native and recombinant RNase A crystals (Y92G and Y92L) belong to the primitive hexagonal lattice with one molecule in the asymmetric unit cell; the Y92A RNase A mutant was crystallized in the tetragonal lattice. The atomic coordinates of the refined RNase A structure (PDB access code: 1JVU) were used for the initial crystallographic phasing by molecular replacement. All calculations were carried out using CNS (version 1.1).40 With the model given by molecular replacement, a rigid body refinement was carried out at 3.5 Å resolution. All data with I/α > 2 and a lowresolution limit of 10 Å were used for structure refinement. Once a satisfactory description of the protein electron density was complete, water molecules were added. A few cycles of slow-cooling annealing (5000 → 100 K) and positional and restrained isotropic temperature-factor refinements were followed by visual inspection of the electron density maps, including omit maps, coupled with manual model building (when necessary) using the graphics program O.41 The refined electron density clearly matched the amino acid sequence of the RNase A mutants.
The native RNase A structure was used as a starting point for the refinement of all RNase A mutants. Strong stereochemical restraints were imposed during the crystallographic refinement and all final RNase A structures possessed a similarly good stereochemistry with a root-mean-square deviation (RMSD) of ~0.009 Å for bond lengths and ~1.6° for angles. The RMSD between two molecules before and after the final round of refinement was less than 0.05 Å. The quality of the stereochemistry of the final protein structure was assessed with the PROCHECK package.42 The Ramachandran plot showed no residues in generously allowed or disallowed regions (data not shown).
All procedures during crystal growth, data collection, and processing, as well as structure refinement, were identical for each mutant, which simplified the comparison of the final structures and eliminated some of the systematic errors. As a better guide to the quality of the structure, the values of the free R-factor were monitored during the course of the crystallographic refinement. The final value of free R-factors did not exceed the overall R-factor by more than 5 %. The refined coordinates of the RNase A mutants have been deposited in the Protein Data Bank (access codes: 1YMW, Y92G; 1YMR, Y92A; 1YMN, Y92L).
Reductive Unfolding of RNase A Mutants
Reductive unfolding studies of RNase A mutants were carried out at pH 8 and 15 °C (100 mM Tris-HCl buffer containing 1 mM EDTA). Protein and DTTred concentrations were 1.0 mg/ml and 100 mM, respectively. Aliquots of 100 μ L were withdrawn at different times, and any free thiols were blocked with an excess amount of AEMTS. After 5 min, the pH of the AEMTS-blocked samples was reduced to 3 by the addition of 20 μ L glacial acetic acid to prevent deamidation.43 The samples were then desalted using a G25 column washed with dilute acetic acid (5 mM). All desalted samples were immediately analyzed on a strong cation-exchange column using HPLC.
Molecular Dynamics (MD) Simulations of WT and Y92G RNase A
Explicit solvent MD simulations was carried out for WT and Y92G RNase A using Amber 7.0.44,45 The crystal structures of WT (PDB ID: 7RSA) and Y92G (PDB ID: 1YMW) RNase A obtained from the X-ray measurements were used as the initial input for the MD simulations. An octahedron periodic water (TIP3P) box, having 10 Å thickness of water molecules surrounding each protein was used to solvate the protein (the WT and Y92G species were solvated by 5726 and 5111 water molecules, respectively). The force field used was the standard Amber 99 force field. The system was first energy minimized for 0.5 ps to remove any clashes. Then two independent runs of molecular dynamics simulations were carried out for each protein. The integration step was 1 fs and trajectories were recorded every 1 ps. The simulations were carried out for about 5 ns for each trajectory at 300 K. Solvent accessible areas of the sulfur atoms at the (40–95) disulfide bond were calculated by NACCESS46,47 using a probe molecule with a 1.4 Å radius. The RMSD of the entire protein from the initial structure was also calculated.
Results
Characterization of Y92G/A/L Mutants of RNase A
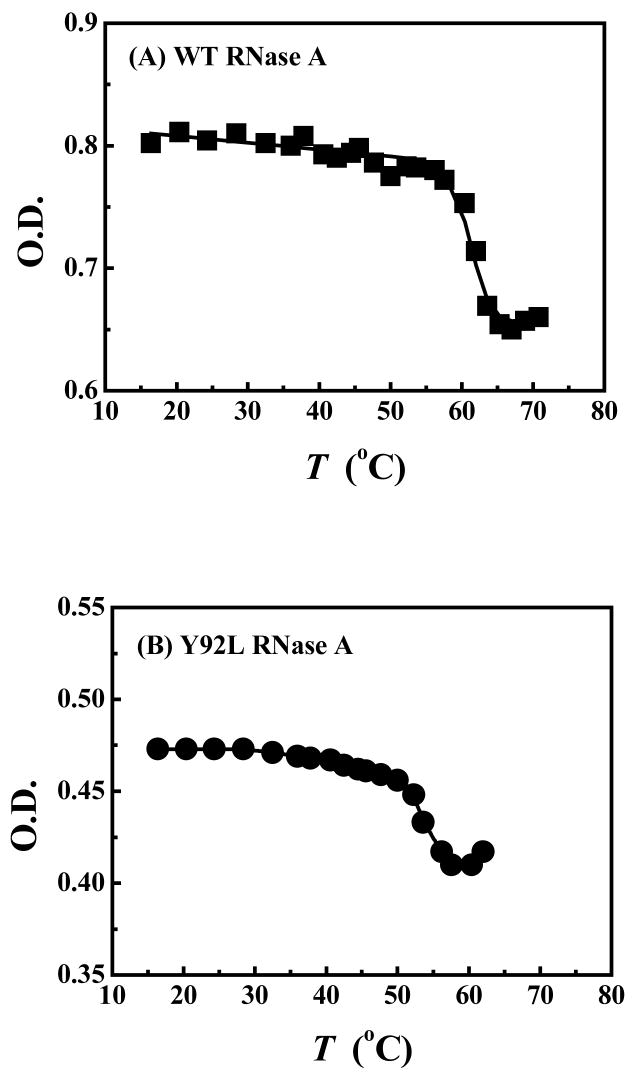
Figure 2 shows the thermal denaturation profiles of WT (panel A) and Y92L (panel B) RNase’s. Thermal and chemical denaturation curves were obtained for the three mutants (not shown), and the results are summarized in Table 2. All three mutant species are marginally destabilized upon removal of Tyr92 as indicated by the slight decrease in the midpoint of their thermal transitions and the small decrease in their free energies of unfolding relative to the WT protein. Activity measurements indicated that, although each mutant was catalytically active, the loss of the ring-stacking interaction perturbs the active-site of the mutant species resulting in slightly diminished enzymatic activities (Table 2).
Figure 2.
Thermal denaturation curves of (A) WT RNase A and (B) Y92L RNase A. Data were obtained at pH 8 (100 mM HEPES, 1 mM EDTA) and fitted to a six-parameter function as described previously.37
Table 2.
Thermodynamic parameters obtained from the thermal and chemical denaturant transition profilesa of WT RNase A and its Y92G/A/L mutants.
| Proteins | Tm (°C) | EquationO (15 °C)b (kcal/mol) | Enzymatic Activity (% of WT) |
|---|---|---|---|
| WT RNase A | 61.9 ± 0.7 | 8.7 ± 0.6 | 100 |
| Y92L | 54.0 ± 0.2 | 7.2 ± 0.3 | 68 |
| Y92A | 55.8 ± 0.4 | 8.1 ± 0.4 | 56 |
| Y92G | 54.8 ± 0.6 | 7.3 ± 0.4 | 61 |
Data were obtained from UV absorbance measurements at 287 nm and at pH 8.
Standard free energy of unfolding.
Structural Characterization of Y92G/A/L Mutants
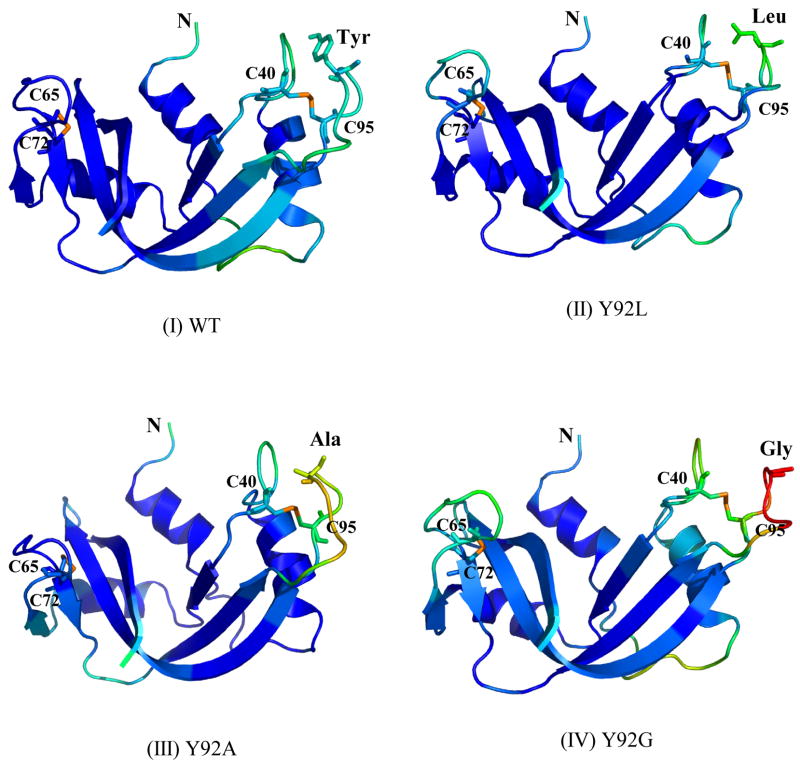
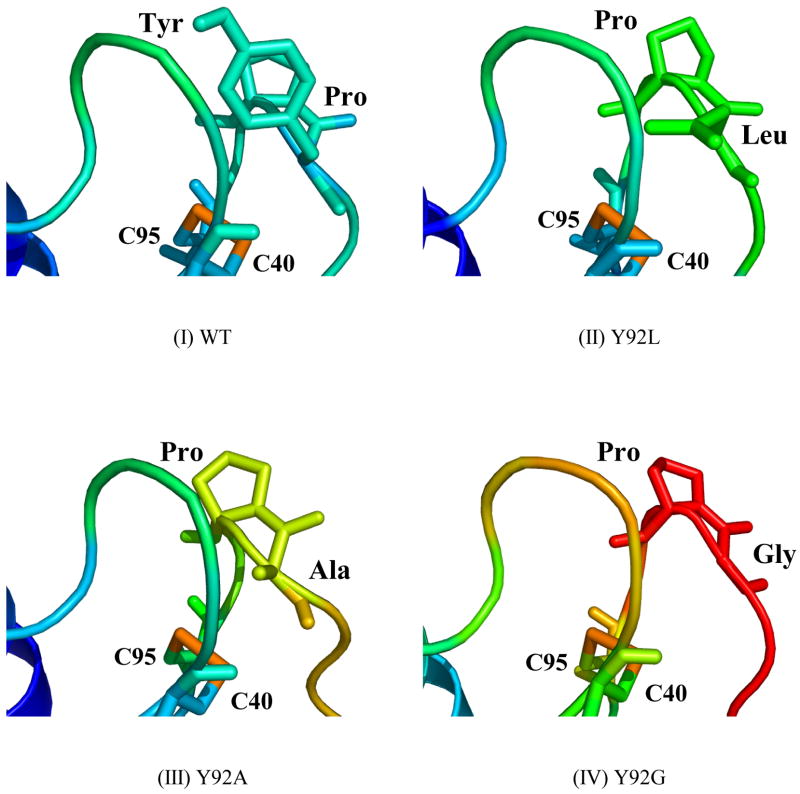
Figure 3A shows the structures of WT RNase A and its mutants, color-coded according to the temperature-factors (B-factors). The highest degree of flexibility with respect to the native protein is observed in the loops containing the (40–95) disulfide bond in the Y92G mutant. Between the scaffolds containing the (40–95) disulfide, the loop containing cysteine 40 and consisting of residues 33–41 is less destabilized compared to the loop (residues 87–96) containing cysteine 95 in every mutant (Figure 3B). The rest of the protein, and specifically the (65–72) disulfide region in each mutant, appears to be unaffected by the mutation (Figure 3A). Arg73 in ONC, which is analogous to Tyr92 in RNase A, can be seen extending into the solvent and away from the solvent-exposed (30–75) disulfide bond (Figure 1).
Figure 3.
Figure 3A. Crystal structures of (I) WT, (II) Y92L (1YMN), (III) Y92A (1YMR), and (IV) Y92G (1YMW) RNase’s. The residues at position 92, the (65–72) and (40–95) disulfide bonds in WT RNase A and its mutants are depicted using “sticks”. The structures are colored according to the values of the temperature factors (tf) using the equal-sized tf-value increments in the “BGR” (blue, green, and red) color code (10 < tf < 70).
3B. Enlargements of the loop regions containing the (40–95) disulfide bond in (I) WT, (II) Y92L (1YMN), (III) Y92A (1YMR), and (IV) Y92G (1YMW) RNase’s. Pro93 and the residue immediately preceding it are depicted using “sticks”. The structures are colored according to the values of the temperature factors (tf) using the equal-sized tf-value increments in the “BGR” (blue, green, and red) color code (10 < tf < 70).
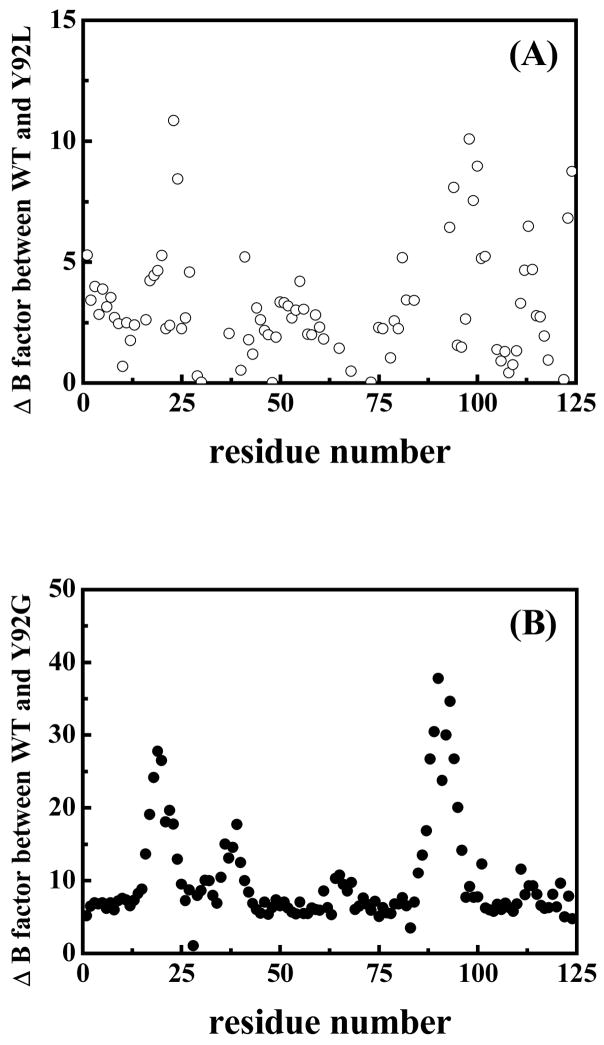
Figure 4 is a difference-plot between the (averaged full-residue) temperature-factors of the residues in WT and Y92L (A) and WT and Y92G (B) RNase. The largest variations in the difference-plot are clearly observed in the vicinity of the (40–95) disulfide bond in both mutants, with the magnitude of this change being large for the WT-Y92G pair. The residues comprising the loop containing Cys95 appear to be much more flexible than those neighboring Cys40, suggesting that the greatest stabilizing impact of the ring-stacking interaction between Tyr92 and Pro93 is found on the loop in which they occur. Additional fluctuations are seen in the 18–23 segment which may be due to the long-range propagation of the destabilization of the two loops.
Figure 4.
Plot showing the differences in the averaged temperature-factors (for the full-residue) (A) between WT and Y92L RNase A and (B) between WT and Y92G RNase A as a function of residue number.
Reductive Unfolding of WT RNase A, Y92G/A/L RNase’s and ONC
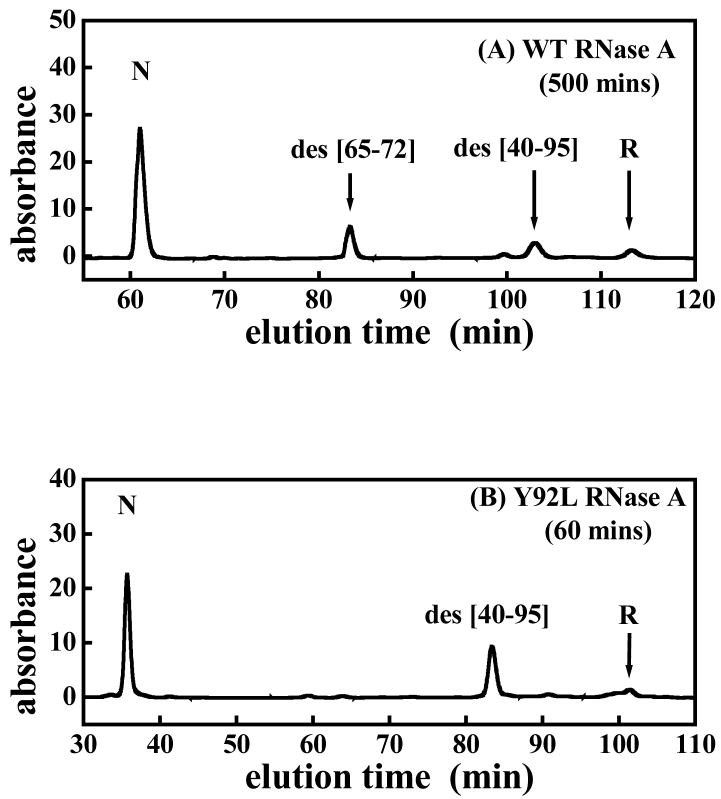
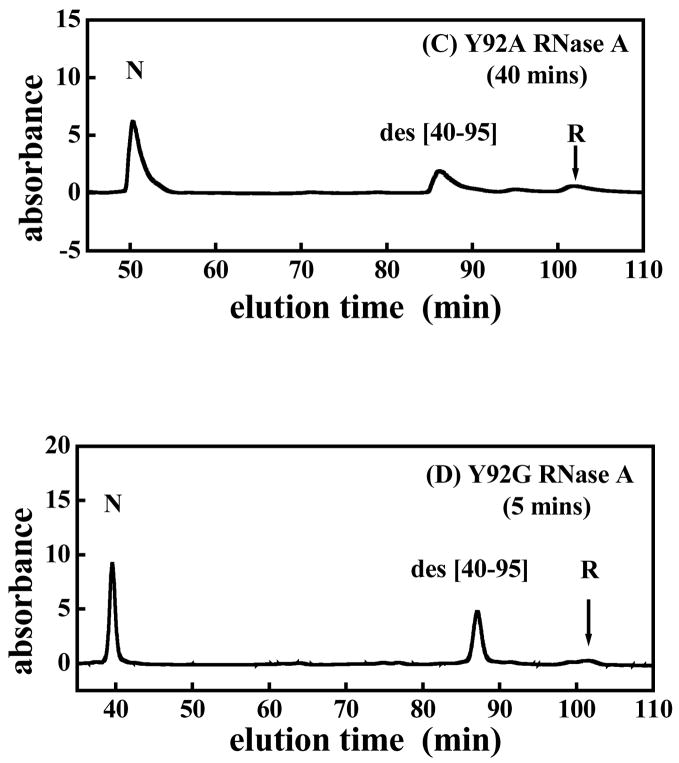
Figures 5 are the typical cation-exchange HPLC chromatograms showing the AEMTS-blocked intermediate(s) that are formed after initiation of ribonuclease reductive unfolding. Two intermediates, viz., des [40–95] and des [65–72], are seen 500 minutes after initiation of the reductive unfolding of WT RNase A (panel A) whereas only one intermediate, des [40–95], is seen 60, 40, and 5 minutes after initiation of the reductive unfolding of Y92L, Y92A, and Y92G (panels B, C, and D, respectively). Des [65–72] was not detected during the reductive unfolding of Y92L, Y92A, and Y92G, indicating that the unfolding pathways of the three mutants differ from that of the WT protein. Reductive unfolding of WT, Y92L, Y92A, and Y92G RNase eventually results in the formation of the fully reduced protein (chromatograms not shown).
Figure 5.
Typical HPLC chromatograms showing the elution of species found in the reductive unfolding of (A) WT RNase A, (B) Y92L RNase A, (C) Y92A RNase A and (D) Y92G RNase A, 500, 60, 40 and 5 minutes, respectively, after the initiation of reductive unfolding using 100 mM DTTred (pH 8, 100 mM Tris-HCl, 1 mM EDTA, 15 °C). “R” is the fully reduced protein. Any thiol-containing species has been blocked with AEMTS.
Table 3 lists the rate-constants for reduction of the (40–95) disulfide bond in WT and mutant RNase’s, and for the analogous (30–75) disulfide bond in ONC, by DTTred. The rate-constants were calculated by fitting of the reductive unfolding kinetic data as described elsewhere.20 The reduction rate-constant for the (30–75) disulfide bond in ONC is ~1100 times greater than that of the homologous (40–95) disulfide bond in WT RNase A. As compared to this value, the rate-constant for the reduction of the (40–95) disulfide in Y92G RNase A is ~700-fold that for the WT protein with the rate-constants for the Y92A and Y92L mutants in between those for WT and Y92G RNase’s. The rate- constants for the reduction of the (40–95) and (65–72) disulfide bonds in WT RNase A are comparable to each other.
Table 3.
Rate-constants for the reduction of disulfide bonds in WT and mutant RNase’s and in ONC (pH 8, 15 °C).
| Protein | Disulfide Bond | Reduction Rate Constant (min−1M−1) | Equation(kcal mol−1) |
|---|---|---|---|
| ONC | (30–75) | a2.3 ± 0.2 | 2.6 ± 0.1 |
| WT RNase A | (40–95) | b(2.1 ± 0.5) × 10−3 | 6.6 ± 0.1 |
| WT RNase A | (65–72) | b(2.3 ± 0.1) × 10−3 | 6.5 ± 0.1 |
| Y92G RNase A | (40–95) | 1.44 ± 0.07 | 2.8 ± 0.1 |
| Y92A RNase A | (40–95) | 0.133 ± 0.003 | 4.2 ± 0.1 |
| Y92L RNase A | (40–95) | 0.091 ± 0.002 | 4.4 ± 0.1 |
From Narayan, M. et al. (20).
From Li, Y. L. et al. (17).
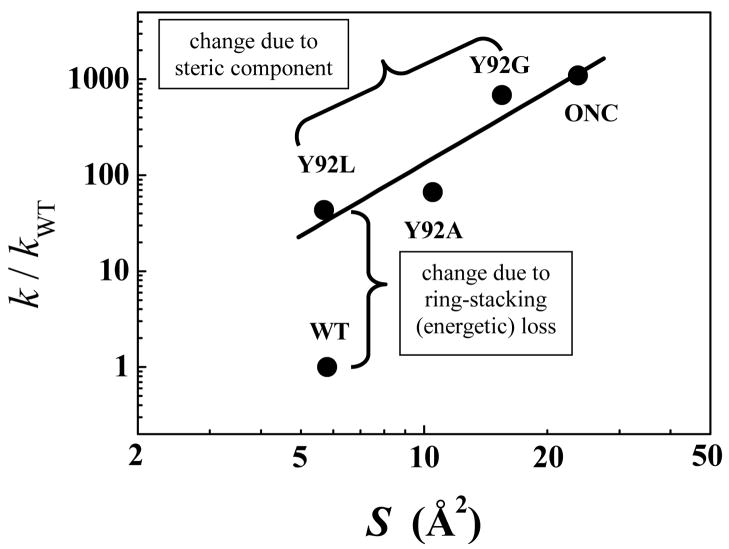
Figure 6 is a plot showing the dependence of the ratio of the rate-constants for the reduction of the (30–75) disulfide bond in ONC and the (40–95) disulfide bond in mutant RNase’s to that for the WT protein on the computed solvent-accessible surface area of the cystine sulfurs of the above disulfide bonds. The data indicate that there appears to be a large influence of the ring-stacking interaction on the rate-constant for the reduction of the (40–95) disulfide bond in RNase A (the magnitude depicted by the vertical brace in Figure 6). A smaller, nevertheless significant, influence of the side-chain size on the reduction-rate constant is also observed with the reduction rate-constants increasing with decreasing side-chain length (the magnitude depicted by the slanting brace in Figure 6). The overall trend suggests that the rate of reduction of the (40–95) disulfide bond in the mutant RNase’s approaches that of the (30–75) disulfide bond in ONC as the solvent-accessible surface areas of the (40–95) cystine sulfurs approach those of the (30–75) cystine sulfurs.
Figure 6.
Dependence of the ratio of the rate-constants for the reduction of the (30–75) disulfide bond in ONC and the (40–95) disulfide bond in mutant RNase’s to that for the (40–95) disulfide bond in the WT protein on the solvent-accessible surface area of the sulfurs in the (40–95) or (30–75) disulfide bond.
Molecular Dynamics (MD) Simulation Data for WT and Y92G RNase A
The RMSD of the MD simulated structures (simulated structures not shown) from the crystal structure was relatively small with average values of 1.4 ± 0.1 Å and 1.0 ± 0.1 Å for the mutant and for WT RNase A, respectively. This indicates that both proteins maintain native-like structures during the simulation, which was also confirmed by examining individual structures in each trajectory.
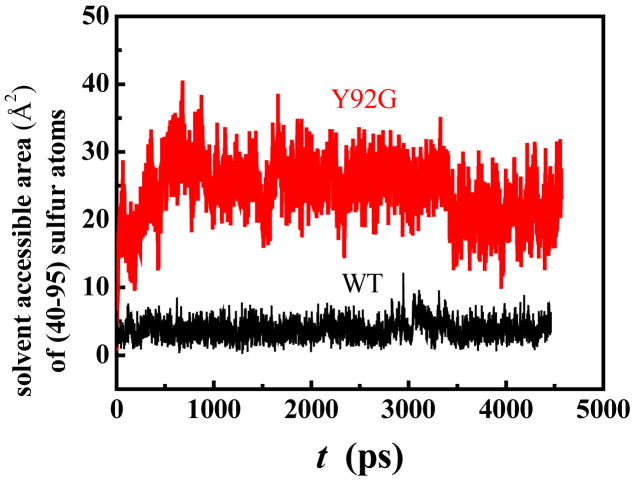
Figure 7 shows the results of MD runs carried out for WT and Y92G RNase A to assess the time-dependent changes in the solvent-accessibility of the (40–95) cystine sulfurs in each variant. The results indicate that the solvent-accessibility of the cystine sulfurs in the mutant increases within 1 ns of the run, whereas it is relatively unchanged in the WT protein. The initial increase in the solvent accessibility of the (40–95) sulfurs of Y92G results from the small conformational change in the loop region of the protein during the initial equilibration procedure. The data also show that the fluctuations for Y92G are larger than those for the WT protein, making it easier to expose the (40–95) disulfide bond of Y92G for reduction.
Figure 7.
Solvent-accessible surface area of the (40–95) disulfide sulfurs in WT RNase A (black) and Y92G RNase A (red) obtained from molecular dynamics simulations (300 K). The data are averaged from two independent runs with different initial seeds.
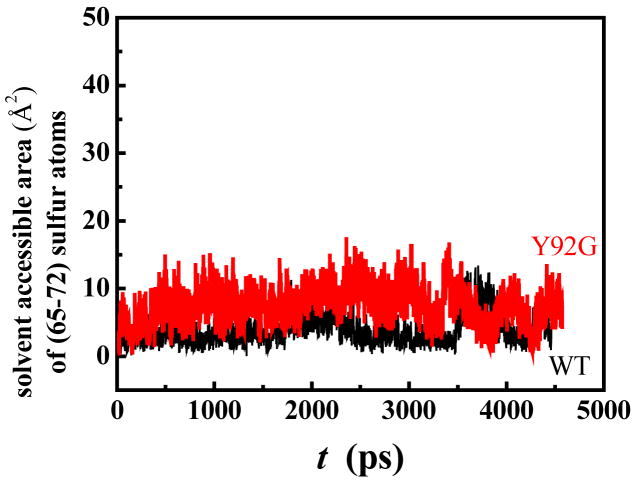
Figure 8 shows the results of similar MD runs focusing on the time-dependence of the solvent-accessibilities of the cystine sulfurs of the (65–72) disulfide bond in WT and Y92G RNase A. The solvent-accessibilities of the cystine sulfurs of the (65–72) disulfide bond in Y92G remain relatively unchanged, unlike those of its (40–95) disulfide bond (Figure 7), indicating that removal of the Tyr92-Pro93 ring-stacking interaction in RNase A primarily affects the flexibility of the loop region around the (40–95) disulfide bond, without perturbing the dynamics of the (65–72) disulfide bond.
Figure 8.
Solvent-accessible surface area of the (65–72) disulfide sulfurs in WT RNase A (black) and Y92G RNase A (red) obtained from molecular dynamics simulations (300 K). The data are averaged from two independent runs with different initial seeds.
Discussion
We have previously demonstrated that RNase A reductively unfolds through parallel pathways by the independent reduction of its (65–72) and (40–95) disulfide bonds,17 whereas its structural homologue onconase reductively unfolds through a single pathway involving the reduction of its (30–75) disulfide bond which takes place at a rate that is ~1100 times greater than that of the homologous (40–95) disulfide bond in RNase A20 (see scheme 1). These results demonstrate that the reductive unfolding pathways of two structurally similar proteins can be (are) very different and hence not necessarily dependent on only gross structural properties but on some other factor(s). Since reductive unfolding studies provide insights into intramolecular interactions governing structure-formation during protein folding and unfolding reactions, revelation of the origin(s) of heterogeneity in the reductive unfolding pathways of homologous proteins will advance our understanding of the protein folding (and unfolding) mechanism.
An examination of the residues around the (40–95) and (30–75) disulfide bonds of RNase A and ONC suggests that the reason for the striking difference in the reductive unfolding characteristics of RNase A and ONC resides in the greater degree of solvent-accessibility of the (30–75) disulfide in ONC compared with the relatively buried (40–95) disulfide in RNase A, making the (30–75) disulfide bond more prone to reduction.20 In the present study, we have attempted to identify, at the molecular level, the origin(s) of their very different solvent-accessibilities (resulting from steric and/or energetic constraints), by focusing on the role that the ring-stacking (aromatic/non-aromatic) interaction between Tyr92 and Pro93 plays in RNase A (and ONC) unfolding [the Tyr92 ring is in close proximity and nearly parallel to the Pro93 ring (Figure 3B, I)]. For this purpose, we constructed and characterized Y92G/A/L mutants of WT RNase A, each of which is devoid of the aromatic/non-aromatic interaction. Furthermore, while all the Tyr92 substituents lack the aromatic ring, their side-chains are of differing lengths, which results in a decrease in the solvent-accessibility of the (40–95) cystine sulfurs as function of increasing side-chain-length (G→A→L).
It has previously been shown that the reduction of the (40–95) disulfide bond in RNase A is initiated through a local unfolding process that leads to the exposure of the disulfide, making it prone to reduction.17 If the magnitude of the difference in the reductive unfolding rates between WT and mutant RNase A’s is much greater than the magnitude of the differences in their global stabilities, it is clear that the mutation has a greater local influence than a global one; i.e., our intent was to determine whether the removal of the aromatic/non-aromatic interaction in RNase A would impact a local reductive unfolding event without perturbing the rest of the protein.
Structural and thermodynamic studies of WT RNase A and its mutants were undertaken to evaluate the effect(s) of the mutation on the global integrity of RNase A. Examination of the temperature-factors of the crystal structures of WT RNase A and its mutants indicates that the highest degree of structural perturbation occurs in the vicinity of the mutation (around residues 40 and 95) whereas the rest of the molecule remains relatively undisturbed. In particular, the loop region (residues 87–96) containing Tyr92 becomes the most flexible in the mutants (see Figure 4) followed by the adjacent loop (residues 33–41) containing Cys40. The midpoint of thermal transitions of the mutants are slightly lower than that of the WT protein and there appears to be marginal destabilization of the protein upon removal of the ring-stacking interaction (Table 2).
By contrast to these modest changes in the global unfolding properties and structural characteristics of the mutants, their reductive unfolding kinetics differed markedly from that of the WT protein. The ratio of the rate-constants for reduction of the (40–95) disulfide bond in the mutants to that of WT RNase A varies from 43 for the Y92L-WT pair to ~700 for the Y92G-WT pair. Furthermore, we observed that the rate of reduction of the (40–95) disulfide bond in the mutants approached the rate of reduction of the (30–75) disulfide bond in ONC as the solvent-accessibility of the (40–95) disulfide approached the solvent-accessibility of the (30–75) disulfide [as function of decreasing side-chain length (L→A→G)] (Figure 6). Finally, and most importantly, the reductive unfolding pathway of RNase A was radically altered from a parallel pathway in the WT protein to a single, ONC-like pathway in each variant resulting from the reduction of the (40–95) disulfide bond. The origin of this behavior is discussed in the following sections.
Inspection of the computed solvent-accessibilities of the (40–95) cystine sulfurs in WT and mutant RNase’s and the rate-constants for the reduction of the (40–95) disulfide bond in each RNase A species (Figure 6) indicates that there are steric and energetic contributions to the protection of the (40–95) disulfide bond from reduction. In fact, the energetic (enthalpic) component arising as a result of the stabilizing aromatic/nonaromatic interaction has a larger effect on the reduction-rate of the (40–95) disulfide bond than the increase in solvent-accessibilities of the cystine sulfurs (resulting from a decrease in the side-chain length when considering the sequence Y→L→A→G). In ONC, Tyr92 is replaced by Arg73 which is solvent-exposed (Figure 1) and therefore fails to protect the homologous (30–75) disulfide bond from reduction. The rate of reduction of this highly exposed disulfide bond is probably so fast that the reduction of any of the three other disulfides cannot compete with it. This results in the accumulation of only one intermediate, des [30–75] during the reductive unfolding of ONC.20,21 The same argument explains the absence of des [65–72] during the reductive unfolding of Y92G/A/L (Fig. 5) since the rate of reduction of the (40–95) disulfide bond in the mutants is between ~ 40- and 630-fold faster than the rate of reduction of the (65–72) disulfide bond. In those molecules (of mutant RNase A) in which the (65–72) disulfide bond is first reduced (resulting in the formation of des [65–72]), the reduction of the (40–95) disulfide bond in des [65–72] is bound to take place rapidly, leading to the formation of an unstable two-disulfide-containing intermediate. Such an unstable two-disulfide-containing intermediate fails to protect its disulfides from reduction and is rapidly reduced to form the fully reduced protein. Therefore, des [65–72] does not accumulate in any mutant lacking the Tyr92-Pro93 interaction.
To obtain a better understanding of the impact of the Tyr92-Pro93 ring-stacking interaction on the dynamics of the loop region around the (40–95) disulfide bond in RNase A, we carried out molecular dynamics simulations that specifically focused on the time-dependent changes in solvent-accessibility of the (40–95) cystine sulfurs. It is clearly evident that the (40–95) cystine sulfurs of the Y92G mutant become exposed within a relatively short time, whereas those in the WT protein remain relatively unperturbed (Figure 7) indicating that the loop region around the (40–95) disulfide bond is very labile in the mutant compared to the WT protein. Similar MD simulations of Y92A and Y92L, albeit with shorter simulation times, revealed the larger fluctuations around the (40–95) disulfide bonds of these mutants (data not shown). These simulations reinforce the observation that the Tyr92-Pro93 interaction plays a crucial role in maintaining the rigidity of the loop region around the (40–95) disulfide bond in the WT protein.
We further decided to probe the effect of this interaction on the (65–72) disulfide bond of RNase A, the reduction of which is independent of the reduction of the (40–95) disulfide bond since each reduction is initiated through separate local unfolding events.17 A comparison of the solvent accessibilities of the (65–72) disulfide sulfurs in WT and Y92G using molecular dynamics simulation (Figure 8) shows that the loss of the Tyr92-Pro93 interaction does not significantly affect the flexibility of the protein chains in that region [which would have otherwise resulted in a higher solvent-accessibility of (65–72) cystine sulfurs]. Therefore, by suppressing the flexibility of the (40–95) loop region in the WT protein, the aromatic/non-aromatic interaction hinders the local unfolding processes that lead to the exposure of the (40–95) disulfide bond to an extent that is sufficient to make it commensurate with the separate local unfolding processes that lead to the exposure of the (65–72) disulfide. The difference between the free energies (~ 2.2 kcal/mol) for the reduction of the (40–95) disulfide bond in WT and Y92L RNase A (Table 3) probably approximates the Tyr92-Pro93 interaction energy. The presence of such an interaction in WT RNase A is the cause of the energetic cost to expose the (40–95) disulfide bond to increase it to 6.6 kcal/mol, thereby becoming approximately equal to that required for exposing the (65–72) disulfide bond (6.5 kcal/mol).17 The result is a dichotomy in the unfolding pathway of RNase A (see scheme 1).
Summary and Conclusion
Characterization of the structural, thermodynamic, and reductive unfolding properties of Y92G/A/L in conjunction with MD simulations indicates that the ring-stacking interaction between Tyr92 and Pro93, appears to be responsible for orienting the aromatic moiety over the (40–95) disulfide bond and more importantly for stabilizing the dynamic motions of the two loops containing the disulfide bond; the hydrogen bond between the hydroxyl of Tyr92 and the carbonyl of Lys37 (Figure 1) does not alter the effect that the ring-stacking interaction has on the reductive unfolding kinetics of RNase A as evidenced by the similar reductive unfolding rates and pathways of Y92F and WT RNase’s.20 It is the loss of the aromatic/non-aromatic interaction that hastens the exposure of the (40–95) disulfide bond through local unfolding processes and therefore makes it amenable to rapid reduction. The (65–72) disulfide bond is not affected by the loss of the aromatic/non-aromatic interaction, with its reduction-rate perhaps remaining unchanged. The drastic increase in the rate-constant for the reduction of the (40–95) disulfide bond in the mutants results in a shift from two independent reductive unfolding pathways in the WT protein to a single pathway in each mutant, making them ONC-like in their reductive-unfolding behavior (in ONC such an interaction is not present because Tyr92 is replaced by Arg73 which is solvent-exposed). In WT RNase A, the presence of the Tyr92-Pro93 ring-stacking interaction suppresses the dynamic motions of the loops containing the (40–95) disulfide to such an extent that the reduction rate of the (40–95) disulfide bond becomes comparable to the reduction rate of the (65–72) disulfide bond leading to independent and parallel reductive unfolding pathways.
During protein folding (and unfolding), the formation (or loss) of stable intramolecular interactions is essential for successful regeneration (loss) of the native fold. These interactions include: a) sequestration of disulfide bonds within stable structural elements during oxidative folding (thereby preventing their reshuffling or reduction), b) the formation of internal hydrogen bonds among backbone carbonyl and amide groups which can lead to helix formation, c) the formation of hydrophobic contacts, d) intramolecular van der Waals and electrostatic interactions which eventually result in the formation of a unique, stable native structure, etc. Side-chain/side-chain interactions such as of the cation-π and π-π type are also known to play vital roles in biopolymer function, dynamics, and stabilization. Examples include: π-π stacking interactions leading to the stabilization of the 310-helix conformation in dehydroalanine oligopeptides;48 the thermostabilization of cytochrome P450 49 and of CYP119 from Sulfolobus solfataricus50 resulting from aromatic stacking interactions; the Pro-Tyr dipeptide in the active site of glutaredoxin (Cys-Pro-Tyr-Cys) which appears to be the main determinant of its redox properties;51 cation-π interactions resulting in the stabilization of thermophiles52 and α-helical structures;53 Lys-Trp, Arg-Phe, Arg-Tyr, and Lys-Phe interactions in the folding of transmembrane strands and transmembrane helical proteins;54 and the stability of protein-DNA complexes through cation-π interactions.55 Stacking between an aromatic ring (Tyr or Phe) and a Pro residue is known to stabilize type VI reverse turns in linear peptides as demonstrated in the short linear peptides SYPFDV and AYPYD.56,57 While it is not surprising that the energetic requirements required to maintain a compact conformation seen in the small peptides is provided through the aromatic/non-aromatic interaction, it is remarkable that the same type of interaction, by virtue of its chance location in an important loop region of a comparatively much larger “peptide” (RNase A), plays such a critical role in its unfolding process suggesting that this may be the first documented case in which an aromatic/non-aromatic interaction is solely responsible for the bifurcation in the reductive unfolding pathway of RNase A and the resulting difference in the unfolding pathways of structural homologues.
Our finding has an important implication for some of the efforts directed towards solving the protein-folding problem as outlined below.
Recent studies have focused on topological determinants of protein unfolding rates (such as contact-order, clustering coefficients, edge removal per residue, long-range order and total contact distance),58,59 on long-range interactions in determining folding rates of two-state proteins,60 on the identification of spatially interacting conserved regions that are critical for structure and/or function,61 and, average hydrophobicity of a protein sequence which is considered to be an important determinant of its folding rate,62 among others. Other work has focused on the assessment of conformational parameters as predictors of limited proteolytic sites in native protein structures.63,64 In the light of our results, which demonstrate that a single local structural difference between structurally homologous proteins can be causative agents for very different (un)folding kinetics and pathways through modulation of loop flexibility, caution must be exercised when applying the above methods to predict folding/unfolding rates and pathways and to deduce protein structure-function relationships.
Supplementary Material
A full author list for references (20), (40), and (45). This material is available free of charge via the Internet at http://pubs.acs.org.
Acknowledgments
This work was supported by the National Institute of General Medical Sciences of the National Institutes of Health (Grant Nos. GM-24893 and RR-15301). Part of this research was carried out with the resources of the Cornell Theory Center, which receives funding from Cornell University, the State of New York, Federal agencies, Foundations, and Corporate partners.
Part of this work is based on research conducted at the Northeastern Collaborative Access Team beamlines of the Advanced Photon Source, supported by award RR-15301 from the National Center for Research Resources at the National Institutes of Health. Use of the Advanced Photon Source is supported by the U.S. Department of Energy, Office of Basic Energy Sciences, under contract No. W-31-109-ENG-38.
References
- 1.Rothwarf DM, Scheraga HA. Biochemistry. 1993;32:2671–2679. doi: 10.1021/bi00061a027. [DOI] [PubMed] [Google Scholar]
- 2.Creighton TE. Biol Chem. 1997;378:731–744. doi: 10.1515/bchm.1997.378.8.731. [DOI] [PubMed] [Google Scholar]
- 3.Altamirano MM, Garcia C, Possani LD, Fersht AR. Nat Biotechnol. 1999;17:187–191. doi: 10.1038/6192. [DOI] [PubMed] [Google Scholar]
- 4.van den Berg B, Chung EW, Robinson CV, Mateo PL, Dobson CM. EMBO J. 1999;18:4794–4803. doi: 10.1093/emboj/18.17.4794. [DOI] [PMC free article] [PubMed] [Google Scholar]
- 5.Wedemeyer WJ, Welker E, Narayan M, Scheraga HA. Biochemistry. 2000;39:4207–4216. doi: 10.1021/bi992922o. [DOI] [PubMed] [Google Scholar]
- 6.Welker E, Narayan M, Wedemeyer WJ, Scheraga HA. Proc Natl Acad Sci USA. 2001;98:2312–2316. doi: 10.1073/pnas.041615798. [DOI] [PMC free article] [PubMed] [Google Scholar]
- 7.Cemazar M, Zahariev S, Pongor S, Hore PJ. J Biol Chem. 2004;279:16697–16705. doi: 10.1074/jbc.M312328200. [DOI] [PubMed] [Google Scholar]
- 8.Narayan M, Welker E, Wedemeyer WJ, Scheraga HA. Acc Chem Res. 2000;33:805–812. doi: 10.1021/ar000063m. [DOI] [PubMed] [Google Scholar]
- 9.Matheson RR, Scheraga HA. Macromolecules. 1978;11:819–829. [Google Scholar]
- 10.Wörn A, Plückthun A. J Mol Biol. 2001;305:989–1010. doi: 10.1006/jmbi.2000.4265. [DOI] [PubMed] [Google Scholar]
- 11.Phelan P, Gorfe AA, Jelesarov I, Marti DN, Warwicker J, Bosshard HR. Biochemistry. 2002;41:2998–3008. doi: 10.1021/bi011920c. [DOI] [PubMed] [Google Scholar]
- 12.Devi VS, Binz HK, Stumpp MT, Plückthun A, Bosshard HR, Jelesarov I. Protein Sci. 2004;13:2864–2870. doi: 10.1110/ps.04935704. [DOI] [PMC free article] [PubMed] [Google Scholar]
- 13.Goldenberg DP. Biochemistry. 1988;27:2481–2489. doi: 10.1021/bi00407a034. [DOI] [PubMed] [Google Scholar]
- 14.Kuwajima K, Ikeguchi M, Sugawara T, Hiraoka Y, Sugai S. Biochemistry. 1990;29:8240–8249. doi: 10.1021/bi00488a007. [DOI] [PubMed] [Google Scholar]
- 15.Ewbank JJ, Creighton TE. Biochemistry. 1993;32:3677–3693. doi: 10.1021/bi00065a022. [DOI] [PubMed] [Google Scholar]
- 16.Mendoza JA, Jarstfer MB, Goldenberg DP. Biochemistry. 1994;33:1143–1148. doi: 10.1021/bi00171a013. [DOI] [PubMed] [Google Scholar]
- 17.Li YJ, Rothwarf DM, Scheraga HA. Nat Struct Biol. 1995;2:489–494. doi: 10.1038/nsb0695-489. [DOI] [PubMed] [Google Scholar]
- 18.Ma LC, Anderson S. Biochemistry. 1997;36:3728–3736. doi: 10.1021/bi962310t. [DOI] [PubMed] [Google Scholar]
- 19.Chang JY. J Biol Chem. 1997;272:69–75. [PubMed] [Google Scholar]
- 20.Narayan M, et al. J Mol Biol. 2004;338:795–809. doi: 10.1016/j.jmb.2004.03.014. [DOI] [PubMed] [Google Scholar]
- 21.Xu G, Narayan M, Welker E, Scheraga HA. Biochemistry. 2004;43:3246–3254. doi: 10.1021/bi036215d. [DOI] [PubMed] [Google Scholar]
- 22.Chang JY, Li L, Bulychev A. J Biol Chem. 2000;275:8287–8289. doi: 10.1074/jbc.275.12.8287. [DOI] [PubMed] [Google Scholar]
- 23.Denton ME, Scheraga HA. J Protein Chem. 1991;10:213–232. doi: 10.1007/BF01024786. [DOI] [PubMed] [Google Scholar]
- 24.Shimotakahara S, Rios CB, Laity JH, Zimmerman DE, Scheraga HA, Montelione GT. Biochemistry. 1997;36:6915–6929. doi: 10.1021/bi963024k. [DOI] [PubMed] [Google Scholar]
- 25.Laity JH, Lester CC, Shimotakahara S, Zimmerman DE, Montelione GT, Scheraga HA. Biochemistry. 1997;36:12683–12699. doi: 10.1021/bi970878b. [DOI] [PubMed] [Google Scholar]
- 26.Wlodawer A, Svensson LA, Sjölin L, Gilliland GL. Biochemistry. 1988;27:2705–2717. doi: 10.1021/bi00408a010. [DOI] [PubMed] [Google Scholar]
- 27.Ardelt W, Mikulski SM, Shogen K. J Biol Chem. 1991;266:245–251. [PubMed] [Google Scholar]
- 28.Mosimann SC, Ardelt W, James MNG. J Mol Biol. 1994;236:1141–1153. doi: 10.1016/0022-2836(94)90017-5. [DOI] [PubMed] [Google Scholar]
- 29.Leland PA, Staniszewski KE, Kim BM, Raines RT. FEBS Lett. 2000;477:203–207. doi: 10.1016/s0014-5793(00)01804-4. [DOI] [PubMed] [Google Scholar]
- 30.Notomista E, Catanzano F, Graziano G, Dal Piaz F, Barone G, D’Alessio G, Di Donato A. Biochemistry. 2000;39:8711–8718. doi: 10.1021/bi000415x. [DOI] [PubMed] [Google Scholar]
- 31.Dougherty DA. Science. 1996;271:163–168. doi: 10.1126/science.271.5246.163. [DOI] [PubMed] [Google Scholar]
- 32.Gallivan JP, Dougherty DA. Proc Natl Acad Sci USA. 1999;96:9459–9464. doi: 10.1073/pnas.96.17.9459. [DOI] [PMC free article] [PubMed] [Google Scholar]
- 33.Laity JH, Shimotakahara S, Scheraga HA. Proc Natl Acad Sci USA. 1993;90:615–619. doi: 10.1073/pnas.90.2.615. [DOI] [PMC free article] [PubMed] [Google Scholar]
- 34.Crook EM, Mathias AP, Rabin BR. Biochem J. 1960;74:230–233. doi: 10.1042/bj0740230. [DOI] [PMC free article] [PubMed] [Google Scholar]
- 35.Konishi Y, Scheraga HA. Biochemistry. 1980;19:1308–1316. doi: 10.1021/bi00548a008. [DOI] [PubMed] [Google Scholar]
- 36.Santoro MM, Bolen DW. Biochemistry. 1988;27:8063–8068. doi: 10.1021/bi00421a014. [DOI] [PubMed] [Google Scholar]
- 37.Pace CN. Trends Biotechnol. 1990;8:93–98. doi: 10.1016/0167-7799(90)90146-o. [DOI] [PubMed] [Google Scholar]
- 38.Pace CN, Laurents DV, Thomson JA. Biochemistry. 1990;29:2564–2572. doi: 10.1021/bi00462a019. [DOI] [PubMed] [Google Scholar]
- 39.Otwinowski Z, Minor W. Methods Enzym. 1998;276:307–325. doi: 10.1016/S0076-6879(97)76066-X. [DOI] [PubMed] [Google Scholar]
- 40.Brunger AT, et al. Acta Cryst. 1998;D54:905–921. [Google Scholar]
- 41.Kleywegt GJ, Zou JY, Kjeldgaard M, Jones TA. Chapter 17.1. In: Rossmann MG, Arnold E, editors. International Tables for Crystallography. Volume F. Crystallography of Biological Macromolecules. Kluwer Academic Publishers; Dordrecht, The Netherlands: 2001. pp. 353–356.pp. 366–367. [Google Scholar]
- 42.Laskowski RA, MacArthur MW, Moss DS, Thornton JM. J Appl Crystallogr. 1993;26:283–291. [Google Scholar]
- 43.Thannhauser TW, Scheraga HA. Biochemistry. 1985;24:7681–7688. doi: 10.1021/bi00347a027. [DOI] [PubMed] [Google Scholar]
- 44.Pearlman DA, Case DA, Caldwell JW, Ross WS, Cheatham TE, III, DeBolt S, Ferguson D, Seibel G, Kollman P. Comp Phys Commun. 1995;91:1–41. [Google Scholar]
- 45.Case DA, et al. AMBER 7. University of California; San Francisco: 2002. [Google Scholar]
- 46.Hubbard SJ, Campbell SF, Thornton JM. J Mol Biol. 1991;220:507–530. doi: 10.1016/0022-2836(91)90027-4. [DOI] [PubMed] [Google Scholar]
- 47.Hubbard SJ, Thornton JM. NACCESS, Computer Program, Department of Biochemistry and Molecular Biology. University College London; 1993. [Google Scholar]
- 48.Aleman C. Int J Pept Protein Res. 1995;46:408–418. [PubMed] [Google Scholar]
- 49.Maves SA, Sligar SG. Protein Sci. 2001;10:161–168. doi: 10.1110/ps.17601. [DOI] [PMC free article] [PubMed] [Google Scholar]
- 50.Puchkaev AV, Koo LS, Ortiz de Montellano PR. Arch Biochem Biophys. 2003;409:52–58. doi: 10.1016/s0003-9861(02)00402-2. [DOI] [PubMed] [Google Scholar]
- 51.Huber-Wunderlich M, Glockshuber R. Fold Des. 1998;3:161–171. doi: 10.1016/S1359-0278(98)00024-8. [DOI] [PubMed] [Google Scholar]
- 52.Chakravarty S, Varadarajan R. Biochemistry. 2002;41:8152–8161. doi: 10.1021/bi025523t. [DOI] [PubMed] [Google Scholar]
- 53.Shi Z, Olson CA, Bell AJ, Jr, Kallenbach NR. Biopolymers. 2001;60:366–380. doi: 10.1002/1097-0282(2001)60:5<366::AID-BIP10177>3.0.CO;2-5. [DOI] [PubMed] [Google Scholar]
- 54.Gromiha MM. Biophys Chem. 2003;103:251–258. doi: 10.1016/s0301-4622(02)00318-6. [DOI] [PubMed] [Google Scholar]
- 55.Wintjens R, Lievin J, Rooman M, Buisine E. J Mol Biol. 2000;302:395–410. doi: 10.1006/jmbi.2000.4040. [DOI] [PubMed] [Google Scholar]
- 56.Yao J, Dyson HJ, Wright PE. J Mol Biol. 1994;243:754–766. doi: 10.1016/0022-2836(94)90045-0. [DOI] [PubMed] [Google Scholar]
- 57.Demchuk E, Bashford D, Case DA. Fold Des. 1997;2:35–46. doi: 10.1016/S1359-0278(97)00004-7. [DOI] [PubMed] [Google Scholar]
- 58.Jung J, Lee J, Moon HT. Proteins. 2005;58:389–395. doi: 10.1002/prot.20324. [DOI] [PubMed] [Google Scholar]
- 59.Gromiha MM, Saraboji K, Ahmad S, Ponnuswamy MN, Suwa M. Biophys Chem. 2004;107:263–272. doi: 10.1016/j.bpc.2003.09.008. [DOI] [PubMed] [Google Scholar]
- 60.Gromiha MM, Selvaraj S. J Mol Biol. 2001;310:27–32. doi: 10.1006/jmbi.2001.4775. [DOI] [PubMed] [Google Scholar]
- 61.Bhaduri A, Ravishankar R, Sowdhamini R. Proteins. 2004;54:657–670. doi: 10.1002/prot.10638. [DOI] [PubMed] [Google Scholar]
- 62.Calloni G, Taddei N, Plaxco KW, Ramponi G, Stefani M, Chiti F. J Mol Biol. 2003;330:577–591. doi: 10.1016/s0022-2836(03)00627-2. [DOI] [PubMed] [Google Scholar]
- 63.Burgess AW, Scheraga HA. J Theor Biol. 1975;53:403–420. doi: 10.1016/s0022-5193(75)80012-9. [DOI] [PubMed] [Google Scholar]
- 64.Hubbard SJ, Beynon RJ, Thornton JM. Protein Eng. 1998;11:349–359. doi: 10.1093/protein/11.5.349. [DOI] [PubMed] [Google Scholar]
Associated Data
This section collects any data citations, data availability statements, or supplementary materials included in this article.
Supplementary Materials
A full author list for references (20), (40), and (45). This material is available free of charge via the Internet at http://pubs.acs.org.


