Abstract
Toxic heavy metals emitted by industrial activities in the midlatitudes are transported through the atmosphere and deposited in the polar regions; bioconcentration and biomagnification in the food chain mean that even low levels of atmospheric deposition may threaten human health and Arctic ecosystems. Little is known about sources and long-term trends of most heavy metals before ≈1980, when modern measurements began, although heavy-metal pollution in the Arctic was widespread during recent decades. Lacking detailed, long-term measurements until now, ecologists, health researchers, and policy makers generally have assumed that contamination was highest during the 1960s and 1970s peak of industrial activity in North America and Europe. We present continuous 1772–2003 monthly and annually averaged deposition records for highly toxic thallium, cadmium, and lead from a Greenland ice core showing that atmospheric deposition was much higher than expected in the early 20th century, with tenfold increases from preindustrial levels by the early 1900s that were two to five times higher than during recent decades. Tracer measurements indicate that coal burning in North America and Europe was the likely source of these metals in the Arctic after 1860. Although these results show that heavy-metal pollution in the North Atlantic sector of the Arctic is substantially lower today than a century ago, contamination of other sectors may be increasing because of the rapid coal-driven growth of Asian economies.
Keywords: cadmium, glaciochemistry, Greenland, lead, thallium
Global distillation in which toxic heavy metals and other contaminants are emitted at lower latitudes, travel through the atmosphere, and then are deposited through condensation in the cold polar regions provides a means for transfer of these pollutants from high-emission regions to regions of low or no emissions (1). Bioconcentration in marine and terrestrial organisms and biomagnification through different trophic levels in the food chain mean that even low levels of atmospheric deposition may result in significant heavy-metal concentrations in Arctic plants and animals (2–4). Biomagnification produces a powerful multiplier effect: Contaminants including many heavy metals pass up each level in the food chain from prey to predator. Traditional human diets in the Arctic are generally rich in long-lived land and marine animals from the higher trophic levels of the food chain and often include large quantities of liver and kidney (e.g., in caribou, seals, whale), where bioconcentration and biomagnification of these heavy metals are particularly pronounced, leading to potentially hazardous human exposure (2). For example, measurements in human blood and tissue from some Arctic aboriginal populations show elevated cadmium levels which may be related to high consumption of organ meats, particularly those from ungulates and marine mammals (2, 3).
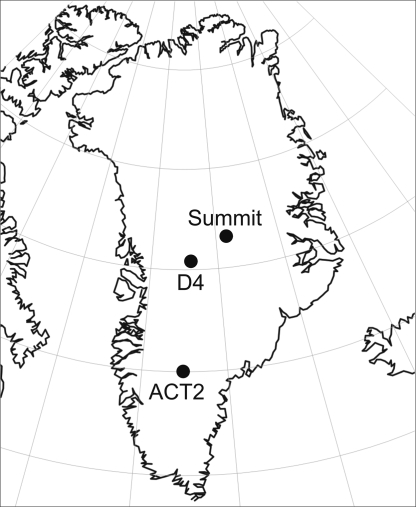
Although toxic heavy-metal pollution in the Arctic was widespread during recent decades (1–5), little is known about sources and long-term trends of most heavy metals before ≈1980, when modern atmospheric and precipitation chemistry measurements began (1, 2). Atmospheric lifetimes of most heavy-metal contaminants are short (1), but persistence in the Arctic environment and availability for bioaccumulation after deposition are not known. This paucity of data resulted both from analytical difficulties in measuring certain heavy metals (e.g., thallium) and cumbersome sample-handling and decontamination methods that limited the extent of these records. Source attribution (e.g., industrial pollution, wildfire, volcanic emissions, and continental dust) was even more difficult. Lacking detailed, long-term measurements, ecologists, health researchers, and policy makers generally have assumed that contamination was highest during the 1960s and 1970s at the peak of industrial activity in North America and Europe (1, 2). We present monthly resolved records of thallium (Tl), cadmium (Cd), and lead (Pb) concentration and deposition from 1772 to 2003 developed from a Greenland ice core (ACT2) using a continuous analytical system (Fig. 1). We used tracer measurements and comparisons with ice core records from the D4 and Summit sites in Greenland (Fig. 1) to investigate sources of Tl, Cd, and Pb, which are among the most toxic heavy-metal pollutants (2, 5, 6).
Fig. 1.
Map of Greenland showing the locations of the ACT2 and other ice cores described in Results and Discussion and Methods. The ACT2 ice core was collected ≈55 km west of the ice divide.
Results and Discussion
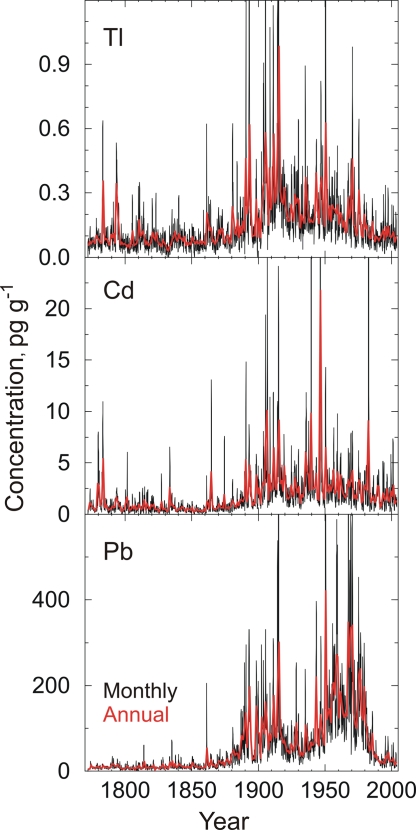
Our continuous, high-depth-resolution ice core measurements in the ACT2 ice core show that Tl, Cd, and Pb concentrations in south-central Greenland precipitation varied widely during the past two centuries (Fig. 2). Mean concentrations from 1772 to 2003 were 0.155, 1.870, and 51.00 pg g−1, respectively; and average deposition rates for Tl, Cd, and Pb were 0.057, 0.700, and 22.0 μg m−2 y−1, respectively. All three toxic metals are highly enriched over crustal and seawater abundances, with enrichment factors throughout the 232-year period of >5 for Tl, >340 for Cd, and >98 for Pb, indicating sources other than continental dust and sea salts such as volcanic, forest fire, and industrial emissions (5, 7). We used similar measurements of cerium (Ce), sea-salt sodium (ssNa), black carbon (BC), and non-sea-salt sulfur (nssS) as source tracers to determine changes in contributions from continental dust, sea salt, and volcanic, forest fire, and industrial emissions during the 232-year record.
Fig. 2.
Monthly (black) and annually (red) averaged concentrations of Tl, Cd, and Pb in central Greenland precipitation from 1772 through 2003.
Few studies of Tl in the Arctic have been reported (8), although historical records of Tl deposition in central Europe have been developed from peat bogs (9). Tl is highly toxic and listed by the U.S. Environmental Protection Agency as a priority pollutant (5). Because of low concentrations and measurement difficulties, Tl has been overlooked in many past environmental studies even though it is more toxic to mammals than mercury and orders of magnitude more toxic than Cd (5). A net bioconcentration factor of 10,000 has been reported for trout in the Great Lakes (10), indicating that even low concentrations of Tl in the environment may pose a risk to Arctic biota. From 1772 to ≈1860, monthly averaged Tl concentrations in the ice core showed no trend (Fig. 2). Annual average concentrations during this period were 0.084 pg g−1. Concentrations slowly began to rise after 1860 and then accelerated in 1889. Monthly averaged Tl concentrations reached a peak in 1915 of >2.5 pg g−1, whereas annually averaged Tl concentration that same year reached ≈1.0 pg g−1, ≈11 times the average concentration before 1860. At its maximum from 1911 to 1915, the 5-year averaged Tl concentration was >0.530 pg g−1, a sixfold increase above pre-1860 levels (Fig. 3). Although erratic, Tl concentrations declined for the remainder of the 20th century, with especially low concentrations during the Great Depression and a significant decline beginning in 1972. The lowest concentrations were measured after ≈1982, when Tl averaged ≈0.100 pg g−1, only slightly higher than the average concentration before 1860.
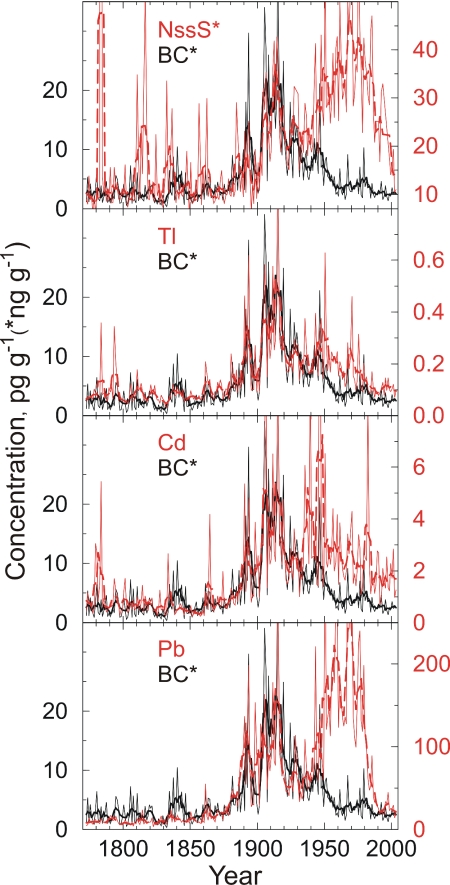
Fig. 3.
Annual average concentrations of nssS, Tl, Cd, and Pb compared to BC from 1872 to 2003. Heavy lines show 5-year running means.
Cd levels have been studied in many components of the Arctic environment and ecosystems because high levels of Cd have been measured in human tissues and Arctic biota and because Cd bioaccumulates in the livers and kidneys of animals used as traditional foods and biomagnifies in the food chain (2–4). Few historical records of Cd concentrations in the atmosphere or in precipitation extend before 1980, however (1, 11).
As with Tl, monthly averaged Cd concentrations in the ice core showed no trend from 1772 to ≈1860. Annual average concentrations during this period were 0.771 pg g−1. In parallel with Tl, Cd concentrations slowly began to rise after 1860 and then accelerated in 1889. After reaching a peak in 1906 of >28.0 pg g−1, monthly averaged Cd concentrations declined to 0.480 pg g−1 in early winter 1932 corresponding to the Great Depression and then increased again, reaching a peak in 1946 of >73.0 pg g−1. At the maxima in 1906 and 1946, annually averaged concentrations of Cd were 10.1 and 21.6 pg g−1, respectively, or 13 and 28 times the mean annually averaged concentration before 1860. Maxima in the 5-year averaged Cd concentrations occurred in 1913 and 1948, when concentrations were seven and nine times pre-1860 levels. Concentrations declined after the late 1940s and averaged ≈1.8 pg g−1 during recent decades.
An estimated 80–90% of human exposure to Pb is through food, and the majority of Pb in food originates from atmospheric deposition (2). There is little evidence for bioaccumulation of Pb in Arctic ecosystems (2, 3). Elevated blood Pb levels in Arctic aboriginal populations have been reported and linked to consumption of marine mammals (2). Measurements of Pb in the ACT2 ice core are in general agreement with previous measurements in Greenland ice cores (see Methods) (11–16) and show an average concentration from 1772 to 1860 of 10.20 pg g−1 and no temporal trend. Concentrations began to increase soon after 1860, accelerating sharply in 1887 to reach a peak in annually averaged Pb concentration in 1893 of ≈197.0 pg g−1, ≈20 times the pre-1860 average. This was followed by a second, even higher monthly average in 1915 of nearly 900.0 pg g−1 and 300.0 pg g−1 in the annual average. Pb concentrations were highly variable between the 1893 and 1915 peaks and declined sharply after 1915, reaching a minimum in 1931 of ≈34.0 pg g−1 during the Great Depression. Concentrations were generally low but increasing until 1949, when Pb concentration increased sharply resulting from widespread use of leaded gasoline (17). Concentrations generally remained high until 1970, with passage of the U.S. Clean Air Act and similar legislation in other countries (16). From 1970 to 1991, annually averaged concentrations dropped by 85% from 335.0 to 19.0 pg g−1. Pb concentrations in precipitation at the ice core site were generally low after 1991, averaging ≈25.3 pg g−1 or 2.5 times pre-1860 levels.
To investigate sources of Tl, Cd, and Pb deposited in south-central Greenland snow during the last 2 centuries, we used ice core measurements of four tracers: Ce, ssNa, BC, and nssS. The rare earth element Ce was used as an indicator of continental dust and ssNa as a tracer of sea salt. The primary natural sources of nssS are marine biogenic and volcanic emissions; anthropogenic sources are industrial emissions (mainly fossil fuel burning) (18). BC results from incomplete combustion, and BC is a tracer of forest fire emissions in central Greenland before industrialization and both forest fires and fossil fuel (primarily coal) burning after industrialization (18). For comparisons with the source tracers, we divided the 232-year record into three periods based on examination of the toxic heavy-metal concentrations and source tracers in the ACT2 ice core and previously published results from the D4 core site (18), which were in broad agreement with independent BC emissions estimates (20, 21): Preindustrial (1772–1860), coal-dominated industrial (1860–1940), and oil-dominated industrial (1940–2003). Correlations (Pearson's r) between annually averaged Tl, Cd, and Pb concentrations and the source tracers for each period are shown in Table 1. No significant correlations (P < 0.01) were found during any period between the ssNa and Tl, Cd, and Pb—confirming predictions based on sea salt elemental ratios that sea salts are not a significant source of toxic heavy metals in the ice core.
Table 1.
Correlations to source tracers
| Cd | Ce | ssNa | nssS | Pb | Tl | |
|---|---|---|---|---|---|---|
| Preindustrial: 1772 to 1860 (n = 89) | ||||||
| BC | 0.299 | 0.116 | −0.18 | 0.102 | 0.115 | 0.274 |
| Cd | 0.236 | 0.062 | 0.677 | 0.275 | 0.567 | |
| Ce | 0.096 | 0.207 | 0.240 | 0.441 | ||
| ssNa | 0.111 | 0.121 | 0.211 | |||
| nssS | 0.124 | 0.606 | ||||
| Pb | 0.285 | |||||
| Coal-dominated industrial: 1860–1940 (n = 81) | ||||||
| BC | 0.689 | 0.142 | 0.038 | 0.638 | 0.755 | 0.855 |
| Cd | 0.243 | 0.162 | 0.660 | 0.743 | 0.770 | |
| Ce | 0.267 | 0.296 | 0.216 | 0.233 | ||
| ssNa | 0.243 | 0.111 | 0.092 | |||
| nssS | 0.616 | 0.718 | ||||
| Pb | 0.907 | |||||
| Oil-dominated industrial: 1940–2003 (n = 64) | ||||||
| BC | 0.661 | 0.107 | 0.263 | 0.071 | 0.224 | 0.495 |
| Cd | 0.084 | 0.292 | 0.177 | 0.265 | 0.439 | |
| Ce | 0.137 | 0.578 | 0.513 | 0.505 | ||
| ssNa | 0.114 | 0.018 | 0.208 | |||
| nssS | 0.789 | 0.611 | ||||
| Pb | 0.746 | |||||
Correlations are between annually averaged concentrations. P < 0.01 shown in bold; P < 0.0001 shown in bold italics.
Most of the variability in nssS during the preindustrial period is associated with fallout from volcanic emissions. These include quiescent degassing (7) and explosive eruptions (e.g., Tambora in 1817 and Krakatoa in 1883), which are clearly visible in the ACT2 record (Fig. 3). BC variability is associated with boreal forest fire emissions during the preindustrial period (18). Comparisons in our ice core record (Fig. 3) yield highly significant correlations (P < 0.0001) between Tl and both nssS and Ce, and significant correlations (P < 0.01) with BC (Table 1). These results indicate that early sources of Tl were volcanic emissions, continental dust, and forest fire emissions to a lesser degree. Similar comparisons suggest that primary sources of Cd were volcanic and forest fire emissions, with minor contributions from continental dust. Pb is mostly attributed to forest fires and dust during this period. These findings are generally consistent with studies indicating that quiescent volcanic emissions are major sources of Tl, Cd, and Pb released to the atmosphere (7) and linking forest fires to mobilization of heavy metals accumulated in soil and emission to the atmosphere (19).
During the coal-dominated industrial period (18, 20, 21), BC concentrations in the ice core were high, and BC and nssS concentrations closely covaried (Fig. 3). Correlations were not significant (P < 0.01) between the three toxic heavy metals and source tracers for continental dust during this period (Table 1). Conversely, comparisons between Tl, Cd, and Pb and coal-burning tracers BC and nssS yielded highly significant correlations (P < 0.0001) and highly significant correlations with each other, strongly suggesting that sources for all three toxic heavy metals were the same as for BC and nssS and were dominated by coal-burning emissions. Although emissions factors vary from region to region and with changing combustion technology, the linkage between coal burning and heavy-metal emissions a century ago is consistent with findings of studies of recent power plant emissions (5).
After ≈1940, correspondence between BC and nssS diminished when BC concentrations declined, particularly after 1950 as observed in the D4 ice core (18); and nssS concentrations rapidly increased in response to growing economic activities and the shift from coal to oil and gas as primary fuel sources in North America and Europe (20, 21). Correspondence between toxic heavy metals and BC and nssS concentrations also changed in ≈1940. Comparisons yielded highly significant correlations (P < 0.0001) between Tl and BC, and between Cd and BC, suggesting similar sources for these two toxic heavy metals and BC. The proportions of Tl and Cd to BC changed after 1940, however, from shifts in fuel types, changes in burning technology, or both. Coal burning and smelting processes have evolved, leading to significant changes in emissions factors since the Industrial Revolution (20). During the coal-dominated era from 1860 to 1940, 0.039 mg of Tl were deposited in south-central Greenland for every gram of BC; but this increased to 0.111 mg of Tl from 1940 to 2003. Similarly, 0.671 mg of Cd were deposited for every gram of BC during the coal-dominated era, increasing to 2.29 mg of Cd after 1940.
Conclusions
No long-term changes in net snowfall occurred during the past two centuries at the ACT2 ice core site (22), so we assume in our interpretation that removal (e.g., scavenging efficiency) and deposition processes (e.g., wet versus dry deposition) for the toxic heavy metals and source tracers have remained approximately constant. Moreover, our source attribution approach is based on covariance of concentrations in time, but concentrations at the ice core site reflect both changes in source strength and atmospheric transport. It is difficult to distinguish emissions from two collocated sources (e.g., lead smelter, coal-fired power plant) because their emissions will be transported to the ice core site together. The near-constant proportionalities and highly significant (P < 0.0001) correlations ranging from 0.689 to 0.855 between annual averaged BC and Tl, Cd, and Pb concentrations during the 1860–1940 coal-dominated industrial era (Table 1) implicate coal burning in North America and Europe as the dominant source of toxic heavy-metal contamination in Greenland at that time. It is clear from the ice core record that during the late 19th and early 20th centuries, Tl and Cd concentrations in the Greenland Arctic were 5–10 times higher than those in the preindustrial period and 2 to 5 times higher than during recent decades. Moreover, Pb concentrations in south-central Greenland were only a factor of two higher at the peak of the leaded gasoline era in the late 1960s compared with the early 20th century, indicating that midlatitude coal burning was likely a major source of Pb deposited in the Arctic during the earlier period.
Impacts of this coal-derived, toxic heavy-metal pollution on Arctic and subArctic human health and ecosystems almost a century ago have not yet been determined. These findings from the Atlantic sector of the Arctic reflect markedly decreased coal burning emissions in North America and Europe during the last half of the 20th century that resulted from both combustion technology improvements and a shift from coal to oil and gas as the primary fuel source (20, 21). Although not yet confirmed by long-term measurements of deposition from that region, we hypothesize that inputs of Tl, Cd, and Pb are currently increasing in the Pacific sector of the Arctic (23) because of trans-Pacific pollution from rapidly growing Asian economies predominantly fueled by coal combustion (20, 21). These results have implications for future coal use and its potential impact on human health and the environment both close to the emissions sources and after transport to remote regions.
Methods
Ice Cores.
A 115-m-long ice core (ACT2) was collected by using an electromechanical, 0.10-m-diameter drill from the Greenland ice sheet in 2004 (66.0°N, 45.2°W, elevation 2,410 m). The coring site was located in an area of high net snowfall (369 kg m−2 y−1) (22). Following standard procedures, the core was measured and weighed in the field and packed in plastic layflat tubing and insulated boxes for shipment to the trace element analysis laboratory at the Desert Research Institute in Reno, Nevada.
Glaciochemical Analyses.
The cylindrical ice core was cut into five parallel longitudinal samples, each with ≈3.3 × ≈3.3-cm cross-section (24, 25). We used two high-resolution inductively coupled plasma mass spectrometers (HR-ICP-MS) connected in parallel to a continuous ice core-melter system to make repeat measurements of the isotopes 23Na, 140Ce, 111Cd, 205Tl, and 208Pb, with only the innermost 10% of the longitudinal samples used for elemental and BC analyses (18, 24, 25). BC was measured by using a laser-based atmospheric analyzer (18). 32S measurements were made in a parallel sample of the ACT2 core by using HR-ICP-MS (18). We dated the ice core record using a spectrum of ≈30 elements and chemical species, each exhibiting an annual cycle in concentration (22).
Replicate HR-ICP-MS Measurements.
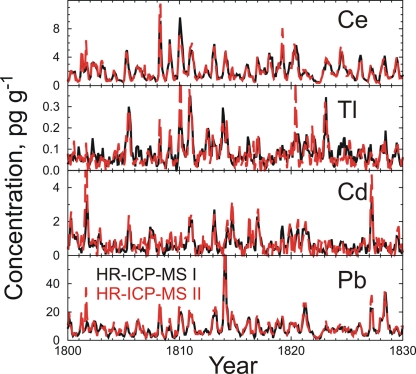
Detailed comparisons between parallel HR-ICP-MS analyses confirm that measurements are highly repeatable. More than 15,000 HR-ICP-MS measurements each of Na, Ce, Cd, Tl, and Pb were combined to yield a continuous record of monthly and annually averaged concentrations for the period 1772 through 2003, with an average of 5.4 measurements per month. Because our ice core analytical system includes two HR-ICP-MS instruments, we used both to measure the same suite of elements in the ACT2 ice core. Detailed comparisons (Fig. 4) between the parallel HR-ICP-MS analyses confirm that the ultra-trace-level measurements are highly repeatable. Listed in Table 2 are mean concentrations of Ce, Tl, Cd, and Pb measured by the two instruments and correlation coefficients between monthly (n = 5,473) and annually (n = 232) averaged measurements. All correlations are highly significant (P < 0.0001).
Fig. 4.
Comparison of monthly averaged Ce, Tl, Cd, and Pb measured in the ACT2 ice core by using two HR-ICP-MS instruments operating in parallel and in real time.
Table 2.
HR-ICP-MS comparisons
| Element | Mean Concentration (pg g−1) |
Correlation |
||
|---|---|---|---|---|
| HR-ICP-MS I | HR-ICP-MS II | Monthly | Annual | |
| Ce | 2.627 | 2.661 | 0.929 | 0.956 |
| Cd | 1.881 | 1.887 | 0.977 | 0.995 |
| Tl | 0.158 | 0.153 | 0.946 | 0.990 |
| Pb | 59.582 | 58.720 | 0.989 | 0.999 |
Monthly and annually averaged measurements from two HR-ICP-MS instruments were averaged to obtain the final concentration time series. Mean concentrations from 1772 to 2003 in the ACT2 ice core were 0.155, 1.87, 51.0, and 2.63 pg g−1 for Tl, Cd, Pb, and Ce, respectively. Average concentrations for ssNa, nssS, and BC were 7.84, 20.55, and 5.51 ng g−1, respectively.
Comparisons with Previously Published Cd and Pb Concentrations.
Heavy metal measurements in polar ice cores are relatively few, and our continuous ACT2 measurements of Pb and Cd are in general agreement with these other measurements. To our knowledge, no measurements of Tl in Arctic ice cores have been published previously, although snow pit samples from the Agassiz Ice Cap in northeastern Canada have been reported (8).
Pb is the most extensively studied, with results reported from Camp Century in northwestern Greenland (12) and Summit in central Greenland (11, 13–16). A total of 36 discrete ice core measurements of Cd spanning the last 230 years has been reported from Greenland ice cores—specifically from Summit in central Greenland (11, 15)—as well as surface snow concentrations from the DYE 3 area in southern Greenland (26, 27). Because ice core chemistry reflects emissions from specific source regions and different transport and deposition processes, historical changes recorded in one ice core may be different from those recorded in an ice core collected elsewhere. Thus, some differences in the glaciochemical record are expected when comparing ice core records from different areas.
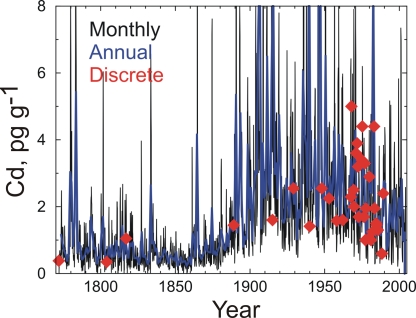
We compared our continuous measurements of Pb and Cd from the ACT2 site with previously published values from Summit and, despite the >600-km separation between them (Fig. 1), found excellent agreement (Figs. 5 and 6). Although few details are available on the dating uncertainties and temporal extent of the 36 previously published discrete Cd measurements spanning the last 230 years (11, 15), comparisons with the ACT2 continuous record show similar concentrations and temporal variability for all but the discrete sample from ≈1915 (Fig. 5). The continuity and high resolution from the ACT2 record, however, support a much different interpretation of Cd concentration, sources, and deposition in Arctic Greenland since the Industrial Revolution. Interpretation of the 36 discrete ice core samples and other measurements led to the conclusion that Cd contamination in the Arctic was highest after World War II (1, 2). The ACT2 record clearly shows that Cd contamination already was pronounced at the end of the 19th century and was substantially higher during the first half of the 20th century than the second half. Comparisons with source tracers indicate that emissions from coal combustion were the likely source of Tl, Cd, and Pb in this earlier period (Table 1).
Fig. 5.
Comparison of monthly and annually averaged continuous measurements of Cd in the ACT2 ice core with all 36 previously published discrete measurements of Cd for this time period (filled diamonds) in Greenland ice cores (11, 15). The discrete samples were measured in a core from Summit ≈600 km north of ACT2.
Fig. 6.
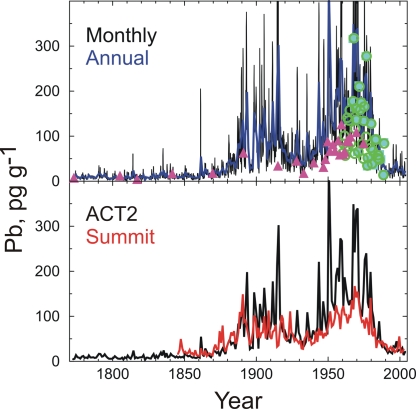
Comparisons to other Greenland ice core measurements of Pb. (Upper) Comparison of monthly and annually averaged Pb measurements from ACT2 with previously published discrete measurements [filled circle (11), filled triangle (13), open circle (14)] at Summit ≈600 km north of ACT2. (Lower) Comparison of annually averaged continuous Pb measurements from ACT2 and Summit. Concentrations of Pb at ACT2 are higher than at Summit after industrialization, particularly in the second half of the 20th century.
Comparisons of previously published discrete and continuous Pb measurements from Summit with the continuous ACT2 record show that Pb concentrations were generally higher after industrialization at the more southerly ACT2 site but that temporal variability was remarkably similar (Fig. 6). The higher concentrations are likely because the ACT2 site is closer to midlatitude sources of emissions in North America and Europe.
Acknowledgments.
We acknowledge B. Bergeron, J. Kyne, and C. McConnell for help collecting the ice core; R. Banta, T. Cox, A. Ellis, and D. Pasteris for assistance in the laboratory; and R. Kreidberg for help in editing the manuscript. Collection and analysis of the ACT2 ice core were supported by the National Aeronautics and Space Administration's Cryospheric Processes and Program (J.R.M.), with additional support from the National Science Foundation (NSF) Arctic Natural Sciences (J.R.M. and R.E.). The NSF Major Research Instrumentation program supported development of the continuous ice core analytical method and acquisition of the laboratory instruments (J.R.M.).
Footnotes
The authors declare no conflict of interest.
This article is a PNAS Direct Submission. F.M. is a guest editor invited by the Editorial Board.
References
- 1.MacDonald RW, et al. Contaminants in the Canadian Arctic: 5 years of progress in understanding sources, occurrence, and pathways. Sci Total Environ. 2000;254:93–234. doi: 10.1016/s0048-9697(00)00434-4. [DOI] [PubMed] [Google Scholar]
- 2.Van Oostdam J, et al. Human health implications of environmental contaminants in Arctic Canada: a review. Sci Total Environ. 1999;230:1–82. doi: 10.1016/s0048-9697(99)00036-4. [DOI] [PubMed] [Google Scholar]
- 3.Dietz R, et al. Comparison of contaminants from different trophic levels and ecosystems. Sci Total Environ. 2000;245:221–231. doi: 10.1016/s0048-9697(99)00447-7. [DOI] [PubMed] [Google Scholar]
- 4.Dietz R, Riget F, Born EW. Geographical differences of zinc, cadmium, mercury, and selenium in polar bears (Ursus maritimus) from Greenland. Sci Total Environ. 2000;245:25–47. doi: 10.1016/s0048-9697(99)00431-3. [DOI] [PubMed] [Google Scholar]
- 5.Cheam V. Thallium contamination of water in Canada. Water Qual Res J Can. 2001;36:851–877. [Google Scholar]
- 6.Li C, Cornett J, Ungar K. Long-term decrease in cadmium concentrations in the Canadian Arctic air. Geophys Res Lett. 2003;30 doi: 10.1029/2002GL016723. [DOI] [Google Scholar]
- 7.Hinkley TK, Lamothe PJ, Wilson SA, Finnegan DL, Gerlach TM. Metal emissions from Kilauea, and a suggested revision of the estimated worldwide output by quiescent degassing of volcanoes. Earth Planet Sci Lett. 1999;170:315–325. [Google Scholar]
- 8.Cheam V, Lawson G, Lechner J, Desrosiers R, Nriagu J. Thallium and cadmium in recent snow and firn layers in the Canadian Arctic by atomic fluorescence and absorption spectrometries. Fres J Anal Chem. 1996;355:332–335. doi: 10.1007/s0021663550332. [DOI] [PubMed] [Google Scholar]
- 9.Shotyk W, Krachler M. Atmospheric deposition of silver and thallium since 12370 14C years BP recorded by a Swiss peat bog profile, and comparison with lead and cadmium. J Environ Monit. 2004;6:427–433. doi: 10.1039/b315084b. [DOI] [PubMed] [Google Scholar]
- 10.Lin T-S, Nriagu J, Wang X-Q. Thallium concentration in lake trout from Lake Michigan. Bull Environ Contam Toxicol. 2001;67:921–925. doi: 10.1007/s001280209. [DOI] [PubMed] [Google Scholar]
- 11.Boutron CF, Gorlach U, Candelone JP, Bolshov MA, Delmas RJ. Decrease in anthropogenic lead, cadmium, and zinc in Greenland snows since the late 1960s. Nature. 1991;353:153–155. [Google Scholar]
- 12.Murozumi M, Chow TJ, Patterson CC. Chemical concentrations of pollutant lead aerosols, terrestrial dusts and sea salts in Greenland and Antarctic snow strata. Geochim Cosmochim Acta. 1969;33:1247–1294. [Google Scholar]
- 13.Candelone JP, Hong SM, Boutron CF. An improved method for decontaminating polar snow or ice cores for heavy metal analysis. Anal Chim Acta. 1994;299:9–16. [Google Scholar]
- 14.Rosman KJR, Chisholm W, Boutron CF, Candelone JP, Hong S. Isotopic evidence to account for changes in concentration of lead in Greenland snow between 1960 and 1988. Geochim Cosmochim Acta. 1994;58:3265–3269. [Google Scholar]
- 15.Boutron CF, Candelone JP, Hong SM. Greenland snow and ice cores: unique archives of large-scale pollution of the troposphere of the Northern Hemisphere by lead and other heavy metals. Sci Total Environ. 1995;161:233–251. [Google Scholar]
- 16.McConnell JR, Lamorey GW, Hutterli MA. A 250-year high-resolution record of Pb flux and crustal enrichment in central Greenland. Geophys Res Lett. 2002;29 doi: 10.1039/2002GL016016. [DOI] [Google Scholar]
- 17.Nriagu JO, Pacyna JM. Quantitative assessment of worldwide contamination of air, water, and soils by trace metals. Nature. 1988;323:134–139. doi: 10.1038/333134a0. [DOI] [PubMed] [Google Scholar]
- 18.McConnell JR, et al. 20th Century industrial black carbon emissions altered arctic climate forcing. Science. 2007;317:1381. doi: 10.1126/science.1144856. [DOI] [PubMed] [Google Scholar]
- 19.Wiedinmyer C, Friedli H. Mercury emission estimates from fires : An initial inventory for the United States. Environ Sci Technol. 2007;41:8092–8098. doi: 10.1021/es071289o. [DOI] [PubMed] [Google Scholar]
- 20.Bond TC, et al. Historical emissions of black and organic carbon aerosol from energy-related combustion, 1850–2000. Global Biogeochem Cycles. 2007;21 doi: 10.1029/2006GB002840. [DOI] [Google Scholar]
- 21.Novakov T, et al. Large historical changes of fossil-fuel black carbon aerosols. Geophys Res Lett. 2003;30 doi: 10.1029/2002GL016345. [DOI] [Google Scholar]
- 22.Banta JR, McConnell JR. Annual accumulation over recent centuries at four sites in central Greenland. J Geophys Res. 2007;112 doi: 10.1029/2006JD007887. [DOI] [Google Scholar]
- 23.Osterberg E, et al. Ice core record of rising lead pollution in the North Pacific atmosphere. Geophys Res Lett. 2008;35 doi: 10.1029/2007GL032680. [DOI] [Google Scholar]
- 24.McConnell JR, Lamorey GW, Lambert SW, Taylor KC. Continuous ice-core chemical analyses using inductively coupled plasma mass spectrometry. Environ Sci Technol. 2002;36:7–11. doi: 10.1021/es011088z. [DOI] [PubMed] [Google Scholar]
- 25.McConnell JR, Aristarain AJ, Banta JR, Edwards PR, Simões JC. 20th century doubling in dust archived in an Antarctic Peninsula ice core parallels climate change and desertification in South America. Proc Natl Acad Sci USA. 2007;104:5732–5748. doi: 10.1073/pnas.0607657104. [DOI] [PMC free article] [PubMed] [Google Scholar]
- 26.Boutron CF, et al. Variations in heavy metal concentrations in fresh Greenland snow from January to August 1989. Atmos Environ. 1993;27:2773–2779. [Google Scholar]
- 27.Wolff EW, Peel DA. Concentrations of cadmium, copper, lead, and zinc from snow near Dye 3 in South Greenland. Ann Glaciol. 1998;27:193–197. [Google Scholar]


