

Abstract
Objective
To establish reliable procedures and normative values to quantify brainstem encoding of speech sounds.
Methods
Auditory brainstem responses to speech syllables presented in quiet and in background noise were obtained from 38 normal children. Brainstem responses consist of transient and sustained, periodic components—much like the speech signal itself. Transient peak responses were analyzed with measures of latency, amplitude, area, and slope. Magnitude of sustained, periodic frequency-following responses was assessed with root mean square, fundamental frequency, and first formant amplitudes; timing was assessed by stimulus-to-response and quiet-to-noise inter-response correlations.
Results
Measures of transient and sustained components of the brainstem response to speech syllables were reliably obtained with high test–retest stability and low variability across subjects. All components of the brainstem response were robust in quiet. Background noise disrupted the transient responses whereas the sustained response was more resistant to the deleterious effects of noise.
Conclusions
The speech-evoked brainstem response faithfully reflects many acoustic properties of the speech signal. Procedures to quantitatively describe it have been developed.
Significance
Accurate and precise manifestation of stimulus timing at the auditory brainstem is a hallmark of the normal perceptual system. The brainstem response to speech sounds provides a mechanism for understanding the neural bases of normal and deficient attention-independent auditory function.
Keywords: Speech syllable response, Brainstem response, Auditory brainstem response, Frequency-following response, Effects of noise
1. Introduction
The neural encoding of sound begins in the auditory nerve and travels to the auditory brainstem. Brainstem responses to simple stimuli (e.g., clicks, tones) are widely used in clinical practice in the evaluation of auditory pathway integrity (Møller, 1999; Starr and Don, 1988). Less well-defined is how the brainstem responds to complex stimuli. Describing auditory encoding of speech sounds provides insight into some of the central auditory processes involved in normal communication. Furthermore, this knowledge may be applied to understanding effects of the aging process on hearing, as well as to a broad range of other circumstances, including hearing and communication in individuals with learning problems, peripheral hearing impairments, cochlear implants, or auditory neuropathies.
1.1. Background and significance
Some people have normal peripheral hearing, but still cannot perceive speech well. Previous studies have shown that the disruption of neural timing at the cortex is linked to auditory perceptual deficits (Kraus et al., 1996; Nagarajan et al., 1999; Tonnquist-Uhlen, 1996; Wible et al., 2002). In addition, abnormal electrophysiological responses to speech syllables at the brainstem level have been associated with a wide spectrum of diagnosed learning problems (King et al., 2002; Wible et al., in press). These abnormalities include a temporally delayed response to the onset of a consonant and deficient spectral representation of harmonic aspects of the speech signal. Disruptions of neural encoding in both the brainstem and cortex were exacerbated when speech was presented in background noise (Cunningham et al., 2001).
Part of the difficulty in perceiving consonants in noisy situations is that they are rapid, relatively low-amplitude transient features of speech. Stop consonants, such as /d/, are known to be particularly vulnerable to disruption by background noise in normal and clinical populations (Brandt and Rosen, 1980). The perception of vowels, however, is more resistant to the effects of noise because they are periodic, sustained signals, and generally louder than consonants.
Brainstem responses provide direct information about how the sound structure of a speech syllable is encoded by the auditory system. It is particularly compelling to consider that specific aspects of the sound structure of the acoustic signal are maintained and reflected in the neural code. Similar to the speech syllable itself, the brainstem response to a speech syllable can be divided into transient and sustained portions, namely the onset response and the frequency-following response (FFR) (Boston and Møller, 1985). Onset responses are transient, with peak durations lasting tenths of milliseconds, thus we will refer to these rapid deflections as transient responses. Within the FFR are discrete peaks corresponding to the periodic peaks in the stimulus waveform. However, this region can be considered as a whole, as it contains a periodic signal sustained for tens or hundreds of milliseconds. Although peaks within the FFR may be thought of as successive onsets, for descriptive purposes, we will use the term FFR to refer to the later portion of the response evoked by the harmonic vowel structure of the stimulus. There is a parallel effect of noise on the brainstem response, similar to the disruption of speech perception, in that transient onsets were more affected by the noise, sometimes even eliminated, while the sustained portion remained intact (Cunningham et al., 2001).
1.2. Specific aims
The specific aims of this study were: (1) to delineate measures of the timing and magnitude of the brainstem response to the speech syllable /da/in quiet and background noise; (2) to establish normative values for these features; and (3) to determine the test–retest reliability of these measures.
2. Methods
2.1. Subjects
Thirty-eight children, ages 8–12 years (21 male, 17 female) participated in the primary focus of this study, which established normative values for the brainstem response to speech syllables. Eight children (four male, four female) were part of the retest reliability portion of the study. None of the children had a history of medical or learning problems and all performed within normal limits on laboratory-internal standardized measures of learning and academic achievement. These measures consisted of selected subtests of Woodcock Johnson, Woodcock Johnson—Revised, and Wide Range Achievement Tests that have been described in detail elsewhere (Kraus et al., 1996). All of the subjects had normal click-evoked auditory brainstem response latencies and normal hearing thresholds at or below 20 dB HL for octaves from 500 to 4000 Hz. Consent and assent were obtained from the parents (or legal guardians) and the children involved in the study. The Institutional Review Board of Northwestern University approved all research.
2.2. Stimulus and recording parameters
Because stop consonants provide considerable phonetic information and their perception is particularly vulnerable to background noise in both normal and clinical populations, a five-formant synthesized /da/was chosen for the stimulus (Klatt, 1980). The stimulus duration was 40 milliseconds (ms). The consonant contained an initial 10 ms burst; the frequencies of which were centered around the beginning frequencies of formants 3–5, thus in the range of 2580–4500 Hz. Additional details of the speech synthesis parameters can be found in King et al. (2002). The syllable /da/ was presented monaurally, in alternating polarities, at 80 dB SPL to the right ear via insert earphones (ER-3, Etymotic Research, Elk Grove Village, IL), with an inter-stimulus interval of 51 ms.
During testing, children watched a videotape with the sound level set at <40 dB SPL in the non-test ear. Responses were collected with Ag–AgCl scalp electrodes, differentially recorded from Cz (active) to ipsilateral earlobe (reference), with the forehead as ground. Three blocks of 1000 sweeps per block were collected at each polarity and in each of two different signal-to-noise conditions, quiet and ipsilateral white Gaussian noise (+5 dB SNR). Waveforms were averaged online in Neuroscan (Compumedics, El Paso, TX) with a recording time window spanning 10 ms prior to the onset and 20 ms after the offset of the stimulus. The sampling rate was 20,000 Hz and responses were online bandpass filtered from 100–2000 Hz, 6 dB/octave. Trials with eye-blinks greater than 35 μV were rejected online. Responses of alternating polarity were then added together to isolate the neural response by minimizing stimulus artifact and cochlear microphonic (Gorga et al., 1985).
2.3. Description of the brainstem response to speech syllables
The electrophysiological brainstem response to a speech sound is a complex waveform (Fig. 1). This waveform includes transient peaks as well as sustained elements that comprise the FFR. The response to the onset of the speech stimulus /da/ includes a positive peak (wave V), likely analogous to the wave V elicited by click stimuli, followed immediately by a negative trough (wave A). In most subjects, positive peaks corresponding to click-evoked auditory brainstem response waves I and III are also visible. Following the onset response, peaks C and F are present in the FFR. While other peaks are discernable in this region, a previous study (King et al., 2002) determined that peaks C and F were the most stable for this stimulus across individuals, having latencies with standard deviations (SDs) less than 0.5 ms across a normal population. The defining feature of the sustained portion of the response is its periodicity, which follows the frequency information contained in the stimulus (Marsh et al., 1974; Smith et al., 1975). The timing and magnitude of both the transient and sustained aspects of the response waveform were evaluated with the measures described below and summarized in Table 1.
Fig. 1.
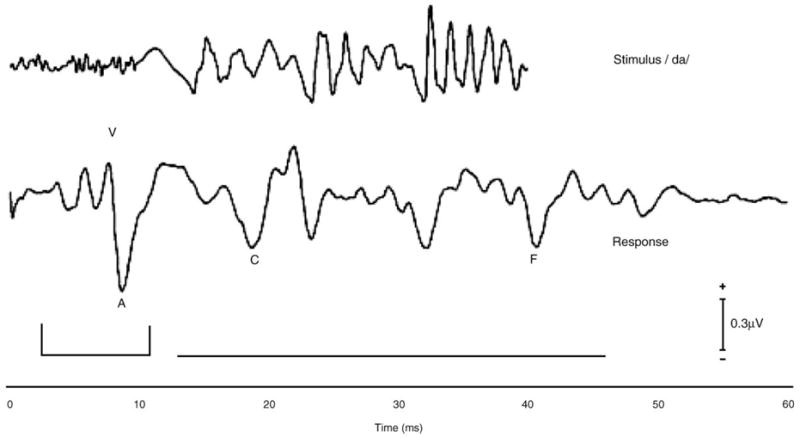
Stimulus waveform (top) and grand average brainstem response in quiet (bottom; n = 38). Three reliable negative peaks, waves A, C, and F, follow wave V. The onset response is bracketed, while the region containing the frequency-following response is indicated with a horizontal line.
Table 1.
Brainstem response measures
| Timing | Magnitude | |
|---|---|---|
| Transient responses | Peak latency (V, A, C, F) | Peak amplitude (V, A, C, F) |
| VA inter-peak interval | VA inter-peak amplitude | |
| VA inter-peak slope | VA inter-peak area | |
| Sustained responses | Correlations | RMS amplitude |
| Stimulus-to-response | F0 amplitude | |
| Inter-response | F1 amplitude |
The response measures indicated either timing or magnitude of the response. Slope is a composite component of timing and magnitude. RMS, root mean square; F0, fundamental frequency; F1, first formant frequencies.
2.4. Discrete peak measures
Measures of both timing and magnitude were utilized to assess the discrete peaks. The onset response waves V and A occur at latencies before 10 ms, while peaks C and F occur at latencies of about 18 and 40 ms, respectively. Three experienced raters picked peaks V, A, C, and F and their latencies and amplitudes were measured. The VA complex was further investigated by measuring its inter-peak interval, amplitude, slope, and area. These measures were taken from the raw waveforms of the responses collected in quiet. When background noise was introduced with the syllable, peaks were often obscured in the raw waveform. Therefore, a wavelet-denoising technique adapted from Quian Quiroga and Garcia (2003) was applied to the waveforms collected in noise before obtaining transient response measures. Nevertheless, some peaks were still imperceptible after the denoising procedure. These peaks were designated as having 0 μV for amplitude and area and were omitted from latency, slope, and inter-peak interval analyses. Additionally, some peaks were not eliminated completely, but if there was not a consensus among peak pickers regarding the actual presence and location of the peak, it was omitted from statistical analyses. These omissions are reflected in the subject numbers listed in Tables 2–4.
Table 2.
Normative values for discrete peak responses collected in both quiet (A) and background noise (B)
| Latency (ms)
|
Amplitude (μV)
|
|||||
|---|---|---|---|---|---|---|
| n | Mean | SD | n | Mean | SD | |
| A. Quiet | ||||||
| Wave V | 38 | 6.61 | 0.25 | 38 | 0.31 | 0.15 |
| Wave A | 38 | 7.51 | 0.34 | 38 | −0.65 | 0.19 |
| Peak C | 38 | 17.69 | 0.48 | 38 | −0.36 | 0.09 |
| Peak F | 36 | 39.73 | 0.61 | 36 | −0.43 | 0.19 |
| VA complex | 38 | 0.89 | 0.19 | 38 | 0.97 | 0.28 |
| VA complex area (μV × ms) | 38 | 6.60 | 2.42 | |||
| VA complex slope (μV/ms) | 38 | −1.21 | 0.37 | |||
| B. Noise | ||||||
| Wave V | 23 | 7.14 | 0.70 | 29 | 0.08 | 0.07 |
| Wave A | 22 | 8.38 | 0.78 | 28 | −0.05 | 0.06 |
| Peak C | 36 | 18.00 | 0.88 | 36 | −0.15 | 0.08 |
| Peak F | 31 | 40.01 | 1.04 | 32 | −0.22 | 0.14 |
| VA complex | 22 | 1.26 | 0.47 | 28 | 0.13 | 0.10 |
| VA complex area (μV × ms) | 22 | 1.70 | 1.23 | |||
| VA complex slope (μV/ms) | 22 | −0.13 | 0.05 | |||
Due to the absence of certain peaks in individual waveforms, the number of subjects differs among measures.
Table 4.
Normative values for measures of the magnitude of the frequency-following response
| n | Mean | SD | |
|---|---|---|---|
| A. Quiet | |||
| F0 amp | 37 | 19.73 | 7.89 |
| F1 amp | 36 | 8.46 | 2.23 |
| RMS amp | 38 | 2.32 | 0.72 |
| B. Noise | |||
| F0 amp | 26 | 13.56 | 6.89 |
| F1 amp | 29 | 5.32 | 1.42 |
| RMS amp | 36 | 1.47 | 0.42 |
RMS, root mean square; F0, fundamental frequency; F1, first formant frequencies; amp, amplitude.
2.5. Frequency-following response measures
The region following the onset response was defined as the FFR. The FFR analysis window was chosen to incorporate as much of the sustained response as possible, while avoiding the refractory period of the onset response and any offset transients. Five analysis techniques were employed to analyze the FFR: (1) root mean square amplitude (RMS amp); (2) amplitude of the spectral component corresponding to the stimulus fundamental frequency (F0 amp); (3) amplitude of the spectral component corresponding to first formant frequencies of the stimulus (F1 amp); (4) stimulus-to-response (S–R) correlations, and (5) inter-response (I–R) correlations between the responses collected in the quiet and noise conditions. These composite FFR measures describe the sustained portion of the response as whole.
2.5.1. Root mean square amplitude
This measure reflects the averaged magnitude of activation of the neural population over an 11.5–46.5 ms epoch of the sustained response. Responses were de-meaned and, to correct for varying amounts of internal (e.g., myogenic) noise among subjects, the RMS amplitude of the response was divided by the RMS amplitude of the pre-stimulus period.
2.5.2. Amplitudes of the fundamental frequency and first formant
The FFR consists of energy at the fundamental frequency of the stimulus and its harmonics (Worden and Marsh, 1968). Fourier analysis was performed on the 11.5–46.5 ms epoch of the FFR in order to assess the amount of activity occurring over two frequency ranges. Activity occurring in the frequency range of the response corresponding to the fundamental frequency of the speech stimulus (103–121 Hz) was calculated for each subject. The response activity corresponding to the first formant frequencies of the stimulus (220–720 Hz) was also measured. The F0 amp provides a gauge of the specific portion of the sustained response devoted to encoding the fundamental frequency of the speech sound, while the F1 amp is devoted to encoding the first formant (Fig. 2). A 2 ms on–2 ms off Hanning ramp was applied to the waveform. Zero-padding was employed to increase the number of frequency points where spectral estimates were obtained. A subject’s response was required to be above the noise floor in order to be included in the analyses. This calculation was performed by comparing the spectral magnitude of the pre-stimulus period to that of the response.1 If the quotient of the magnitude of the F0 or F1 frequency component of the FFR divided by that of the pre-stimulus period was greater than or equal to one, the response was deemed above the noise floor. The raw amplitude value of the F0 or F1 frequency component of the response FFR was then measured. Only the F0 and F1 frequencies of the response were above the noise floor. Response frequencies corresponding to higher stimulus formants were not significantly above the noise floor in either quiet or background noise.
Fig. 2.
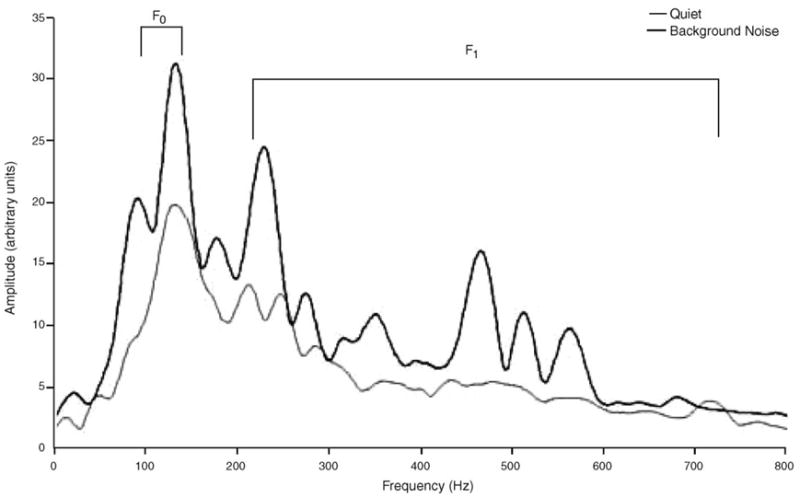
Grand average frequency content in responses collected in quiet (n = 36) and background noise (n = 22). Analysis of the responses indicated that only the fundamental frequency and first formant (F0 = 103–121 Hz, F1 = 220–720 Hz) were measurable, whereas the higher frequency formants were not above the noise floor.
2.5.3. Stimulus-to-response correlation
The stimulus-to-response (S–R) correlation reflects how faithfully the response waveform mimics the stimulus waveform, and provides a measure of phase locking that excludes the non-periodic activity inherent in the RMS amp measure. Each response was cross-correlated to the 10–40 ms portion of the stimulus that includes the harmonic segment of the syllable. Due to the time it takes for neural impulses to propagate through the nervous system, the response lagged behind the stimulus by approximately 7–10 ms. Thus, maximal correlation within this range was recorded.
2.5.4. Quiet-to-noise inter-response correlation
The inter-response (I–R) correlation reflects the fidelity of the response morphology recorded in noise to that of the response recorded in quiet, providing a way to quantify the effects of background noise on the timing of the sustained response. The I–R correlation was calculated similarly to the S–R correlation measure. However, because the addition of noise can delay the brainstem response by a couple of milliseconds, a cross-correlation was performed and the quiet response was allowed to lead the noise response by up to 2 ms.
Mean Pearson’s r-values were reported for normative descriptive purposes of S–R and I–R correlations, although Fisher’s transformation was used to convert r-values to z′-scores for all statistical computations.
3. Results
Based on our evaluation of 38 subjects’ responses recorded in quiet and 36 subjects’ responses recorded in background noise, normative values for the aforementioned brainstem measures were established. Table 2 shows means and SDs for discrete peak measures obtained in quiet and background noise. Tables 3 and 4 provide timing and magnitude values, respectively, for the FFR.
Table 3.
Normative values for correlations of frequency-following responses collected in both quiet (A) and background noise (B)
| n | Mean | SD | |
|---|---|---|---|
| A. Quiet correlations | |||
| Stimulus-to-response (7–10 ms lead) | 38 | 0.28 | 0.10 |
| B. Noise correlations | |||
| Stimulus-to-response (7–10 ms lead) | 36 | 0.16 | 0.09 |
| Inter-response (0–2 ms lead) | 36 | 0.34 | 0.15 |
Correlations were conducted between the stimulus and response, as well as between responses collected in quiet and background noise.
3.1. The normal response in quiet
Responses were highly replicable both within and across subjects. Fig. 3 shows three 1000-sweep blocks obtained from a representative subject (top), as well as responses obtained from another subject on two separate test sessions (bottom). Peaks V, A, and C were detectable in all subjects, and peak F was detectable in all but two subjects. The onset response waves V and A were largest in magnitude, followed by FFR peak F and then peak C. Consistent with other neurophysiological responses, as latency increases, so does its variability. The SD of latency was smallest for the early onset response waves V and A (0.25 and 0.34 ms, respectively), and increased with latency (up to 0.61 ms).
Fig. 3.
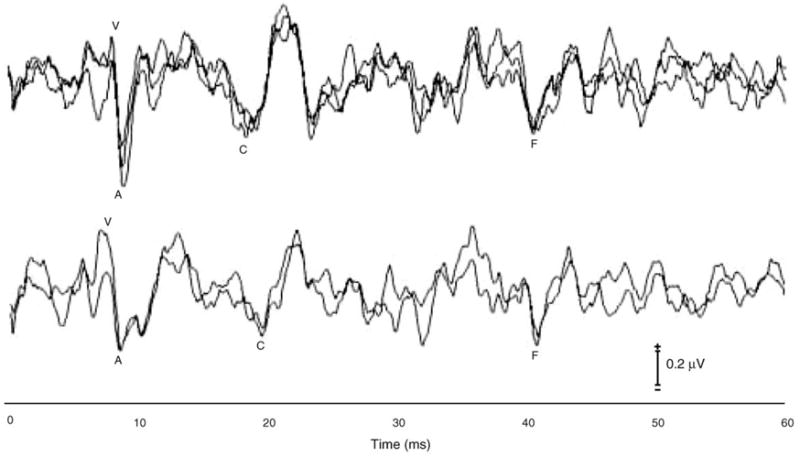
Top: intra-subject, intra-test session reliability. Illustrated are three 1000-sweep subaverages that contributed to the final 3000-sweep response obtained for a representative subject. Bottom: intra-subject, inter-test session reliability. In another subject, two 3000-sweep averages were obtained on different test dates.
The FFR was evident in all subjects. Timing of the FFR was indicated by S–R and I–R correlations. The magnitude of the response was evaluated with RMS, F0 and F1 amplitudes. As shown in Fig. 2, the greatest amount of energy is present in the F0 region.
3.1.1. Relationships among brainstem response measures
Relationships among brainstem response measures recorded in quiet were explored using Pearson’s correlations. Correlations among measures exceeding ±0.30 and P < 0.05 criterion were considered significant. Tables 5–7 show the relationships among and between transient and sustained measures. Transient measures, especially those describing the VA complex and wave C, were largely related to each other (Table 5), while the timing of peak F was relatively independent of the timing of other peaks. Composite sustained measures did not exhibit strong relationships with each other, indicating that each measure described a unique quality of the FFR (Table 6). Transient onset responses were largely independent of sustained measures, with the exception that a number of wave V and A measures were related to F1 amplitude. Discrete peaks within the FFR were related to almost all of the composite FFR measures (Table 7).
Table 5.
Pearson’s correlations among transient discrete peak measures
| Latency
|
Amplitude
|
|||||||||||
|---|---|---|---|---|---|---|---|---|---|---|---|---|
| WAVE | A | C | F | VA | V | A | C | F | VA | Area VA | Slope VA | |
| Latency | V | **0.89 | **0.44 | 0.19 | 0.05 | −0.25 | 0.18 | 0.17 | 0.17 | −0.28 | −0.26 | −0.31 |
| A | 0.30 | 0.24 | **0.49 | −0.27 | 0.04 | 0.26 | 0.21 | −0.20 | −0.01 | ** − 0.47 | ||
| C | 0.01 | −0.14 | −0.25 | 0.15 | −0.10 | 0.00 | −0.25 | −0.30 | −0.12 | |||
| F | 0.20 | 0.28 | 0.06 | *0.40 | 0.23 | 0.11 | 0.14 | −0.02 | ||||
| VA | −0.14 | −0.27 | 0.23 | 0.16 | 0.10 | **0.51 | ** − 0.45 | |||||
| Amplitude | V | −0.15 | −0.13 | **− 0.44 | **0.70 | **0.45 | **0.67 | |||||
| A | −0.02 | 0.28 | ** − 0.81 | ** − 0.82 | ** − 0.58 | |||||||
| C | −0.01 | −0.06 | 0.01 | −0.17 | ||||||||
| F | ** − 0.47 | −0.31 | **0.48 | |||||||||
| VA | **0.85 | **0.83 | ||||||||||
| Area | VA | **0.46 | ||||||||||
A relationship was considered strong if r = ±0.30 and P ≤ 0.05. Transient measures were highly correlated.
P ≤ 0.01;
P ≤ 0.05.
Table 7.
Pearson’s correlations between transient and sustained measures
| Latency
|
Amplitude
|
|||||||||||
|---|---|---|---|---|---|---|---|---|---|---|---|---|
| V | A | C | F | VA | V | A | C | F | VA | Area VA | Slope VA | |
| S–R corr | −0.06 | −0.06 | −0.06 | 0.33 | 0.02 | 0.02 | −0.12 | 0.31 | − 0.20 | 0.11 | 0.14 | 0.12 |
| RMS amp | 0.30 | 0.15 | **0.51 | 0.02 | −0.23 | −0.23 | 0.13 | 0.07 | 0.06 | −0.22 | −0.31 | −0.06 |
| F0 amp | −0.01 | −0.08 | 0.16 | 0.13 | −0.16 | 0.17 | 0.19 | −0.07 | *− 0.39 | 0.25 | 0.08 | 0.32 |
| F1 amp | ** − 0.45 | **− 0.50 | −0.05 | 0.11 | −0.25 | **0.59 | −0.23 | 0.01 | **− 0.53 | **0.53 | 0.29 | **0.61 |
Although some relationships exist between these measures, they are also largely independent response measures.
P ≤ 0.01;
P ≤ 0.05; RMS, root mean square; F0, fundamental frequency; F1, first formant frequencies; amp, amplitude.
Table 6.
Pearson’s correlations among sustained measures
| RMS amp | F0 amp | F1 amp | |
|---|---|---|---|
| S–R corr | 0.04 | 0.33 | 0.33 |
| RMS amp | 0.25 | −0.03 | |
| F0 amp | 0.32 |
Relationships among sustained measures were less prevalent. S–R corr, stimulus-to-response correlation; RMS, root mean square; F0, fundamental frequency; F1, first formant frequencies; amp, amplitude.
3.2. The normal response in noise
The addition of background noise interfered with normal brainstem encoding of the speech stimulus /da/. Fig. 4 shows the effects of noise. Table 2B shows normative values for the transient response measures in noise. Most affected were the onset responses V and A, which were severely degraded and completely obscured in more than 40% of the subjects. Peaks C and F, however, remained present in noise in most subjects (100 and 86%, respectively). Peak amplitudes also were affected by the presence of noise; all peaks were reduced in size (P < 0.001, all tests).
Fig. 4.
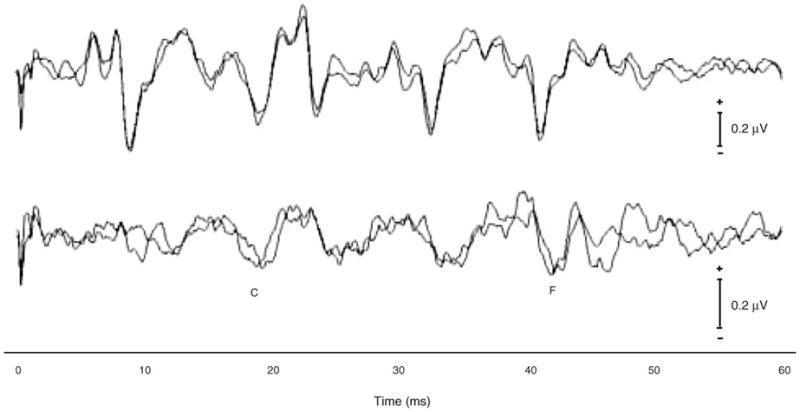
Test–retest reliability. Grand average response waveforms collected in quiet (top) and background noise (bottom) at two different test sessions (n = 8). Background noise effectively disrupts the onset response, while the frequency-following response remains intact.
When not eliminated, latencies of onset peaks V and A, and FFR peak C were delayed in comparison to quiet (P < 0.01, all tests). In contrast, peak F showed resilience to background noise in that its latency did not change with the addition of the noise (P > 0.12) and remained easily identifiable in most subjects. As expected, the introduction of background noise increased the variability in the latencies of all peaks.
Although reduced, the composite FFR remained relatively intact and was discernible in noise. RMS amp and S–R correlations showed significant reductions in noise (P < 0.002, both tests). F0 and F1 amp were also significantly affected by the presence of background noise (P < 0.002, both tests). The addition of noise obscured onset peaks in the responses of many subjects, thus it was not possible to calculate the relationships between onset and FFR measures in noise.
3.3. Test–retest stability
In order to determine whether the variables described here are stable over time, eight of the children were retested after a 2–10-month interval. Test–retest reliability is illustrated in the waveforms shown in a representative subject in Fig. 3 (bottom) and at the group level in Fig. 4. Two-tailed, paired t tests were calculated for all brainstem response measures. A significance criterion of P < 0.05 was used. Most brainstem measures did not change significantly over the test–retest time interval (P > 0.09), exceptions included the amplitude and slope of the VA complex in quiet and wave C latency in noise (P < 0.02, all). Sustained measures were stable from test to retest (P > 0.30, all tests).
4. Discussion
The ability to quantify a brainstem response elicited by speech sounds provides a powerful tool for research and clinical use. The speech-evoked brainstem response faithfully reflects many acoustic properties of the speech signal. In the normally perceiving auditory system, stimulus timing, on the order of fractions of milliseconds, is accurately and precisely represented at the level of the brainstem. Overall, the brainstem response provides a mechanism for understanding the neural bases of normal and deficient auditory function, by providing a quantifiable measure of an individual’s attention-independent neural encoding of speech sounds.
This study described explicit methods to record and quantify the brainstem response to /da/ in quiet and in background noise and provided a normative data set which can be used to assess the integrity of speech signal encoding in normal and clinical populations. Measures of timing and magnitude were identified for both transient and sustained aspects of the responses. Transient response measures included latency and amplitudes of peaks V, A, C, and F, as well as inter-peak interval, slope, area and amplitude of the VA complex as a unit. Sustained measures included RMS amplitude, F0 and F1 amplitudes, S–R correlations, and I–R correlations. In quiet, these brainstem encoding parameters can be obtained nearly 100% of the time; variability is low and test–retest stability is high.
The addition of background noise often eliminated the onset response (waves V and A) or resulted in non-uniform latency delays. Because robust responses are necessary for accurate encoding, this disruption could underlie perceptual difficulties. Although the latencies of waves V, A, and C were delayed in noise, peak F remained stable. Thus, while it appeared that background noise induced a delay in responding to the onset of a sound, compensatory mechanisms may correct for this lag throughout the neural pathway. F0 remained robust in background noise, while other sustained measures, despite often being reduced in magnitude, also showed more resilience to the effects of noise.
Overall, test–retest stability was high for responses obtained in both quiet and background noise. Although minimal variability may exist due to placement of electrodes or the insert earphone, the test–retest measures described in this study showed considerable stability over time.
4.1. Interpreting the brainstem response: transient versus sustained
In as much as it may be an oversimplification to equate features of speech, such as consonants and vowels, with transient and sustained evoked responses, there are certain parallels. The transient portions of the brainstem response reflect the encoding of rapid temporal changes inherent in consonants. The sustained FFR encodes the harmonic and periodic sound structure of vowels. In quiet conditions, both the transient and sustained components of the speech syllable /da/ are robustly encoded. In noise, just as vowels are less affected than consonants, the FFR is less degraded than the onset response.
A major difference between the onset and FFRs measured here was that under a stressed circumstance—background noise—neural encoding of onset features was severely degraded, whereas the sustained FFR features remained relatively unaltered. Onset waves V and A were eliminated in almost half of the subjects, while peaks C and F, and the FFR region as a whole, remained stable. Consequently, the perceptual problems associated with consonant identification in background noise could be attributed to the decreased neural synchrony reflected in the onset, while the intact encoding reflected in the sustained region enabled accurate vowel perception.
F0 amplitude remained robust in noise. Encoding of the fundamental frequency is important for identifying the speaker and emotional tone of voice. Meanwhile, the degradation of F1, which provides phonetic information, coupled with the loss of the onset burst, further degrades perception of the speech signal in noise. These data provide evidence to support the observation that speaker identity and speaker tone of voice is more resistant to noise than the phonetic content of what is being said.
However, another possible explanation is that the /da/ stimulus is smaller in amplitude at its onset than towards the end. Thus, the elimination of waves V and A, and the maintenance of the FFR, may be due to the relative differences in which aspects of the stimulus did or did not exceed the level of the acoustic masking noise. Future studies incorporating different types of background noise, such as pink noise or multi-speaker babble maskers (which more closely resemble naturally occurring noise and the spectrum of speech itself) likely will contribute to further understanding the encoding of speech in background noise.
The overall resistance of the FFR versus the disruption of the onset response in noise suggests a relative independence of brainstem encoding processes. Furthermore, the independence of the transient versus sustained responses was apparent in the relationships among measures. That is, correlations were strong within transient and sustained measures separately, whereas fewer, weaker relationships existed between these classes of measures. Although transient measures within the FFR (e.g., waves C and F) showed relationships to the composite sustained response measures, transient onset and composite FFR measures demonstrated few relationships, reinforcing that they are neither wholly separate nor wholly related measures. It is interesting to note that brainstem responses that reflect prosodic aspects of speech (F0 and RMS amplitude) are largely independent from the internally related measures (waves V, A, and C latency and F1 amplitude), which represent phonetic information of the stimulus.
4.2. Practical applications
4.2.1. Individual versus group data
Most physiological and imaging approaches for assessing the functional integrity of sensory systems require group data and can be time-intensive. Collecting the brainstem response to a speech sound can be done in a few minutes, requires few electrodes, and is passively acquired. Normal variability of response attributes is low. Furthermore, the brainstem response is stable over time. Consequently, the measures reported here lend themselves to the assessment of the encoding of sound structure in individual subjects.
4.2.2. Identification of auditory-based learning disabilities
The data provided here serve as a metric for determining normal brainstem function in response to speech sounds. Deficits in neural timing and magnitude in response to speech syllables at the brainstem level have been previously found to occur in certain children with auditory-based learning problems (Cunningham et al., 2001; King et al., 2002). Timing abnormalities in waves V, A, and C have been identified (King et al., 2002). Decreases in S–R correlations and the reduced magnitude of the FFR, specifically in the frequency composition of F1, have also been found in children with learning problems (Cunningham et al., 2001).
4.2.3. Predictors of future language impairment
A recent publication by Benasich and Tallal (2002) reported that behavioral measures of central auditory function, obtained in children under 1 year of age (mean age = 7.5 months), can serve as predictors for subsequent specific language impairments (SLI) and other developmental language delays. Due to the early maturation of the brainstem response, the brainstem measures described in this paper, might provide a biological marker for early detection of central auditory deficits that may dovetail with these behavioral findings. Further research is needed to determine which specific manifestations of brainstem abnormalities may facilitate the early prediction of SLI. The normative data provided here can serve as an objective index for early diagnosis and identification of deficits in the neural encoding of sound structure in the brainstem. Intervention could be applied before the behavioral aspects of their impairment impact a child.
4.2.4. Predictors for success with auditory training
Neural encoding of sound structure in the auditory brainstem may provide a predictive index for success with auditory training regimens. Children with learning problems and brainstem-encoding deficits have been shown to benefit from auditory training (Hayes et al., 2003). Specifically, trained children with a delayed brainstem onset latency (wave A) in quiet showed greater improvements in the timing and magnitude of cortical responses. Additionally, behavioral improvements were seen in tests of phoneme decoding (Sound Blending and Auditory Processing) in these children. Thus, children with brainstem encoding deficits particularly appeared to benefit from auditory training. These data support the idea that early analysis of the brainstem response could predict which children would benefit from auditory training.
5. Conclusions
Brainstem response timing and magnitude measures provide reliable information about the neural encoding of speech sounds. This study outlined specific measures of brainstem function that may be used to characterize neural encoding of speech sounds for clinical and research applications. Transient and sustained measures provide information regarding auditory pathway encoding of brief and periodic aspects of the stimulus. Some of the data suggest that transient and sustained responses represent independent mechanisms. A better understanding of brainstem encoding may assist in early diagnosis and intervention of auditory disorders, as well as in measuring the success of training programs.
The current study is a springboard for further examination of brainstem activity to complex speech stimuli, as well as for identifying abnormalities in clinical populations such as aging, peripheral hearing impairment, cochlear implant, auditory neuropathy, and non-native listener populations, in which the assessment of auditory function is relevant. Future parametric studies (e.g., of the effects of different speech stimuli, methods of presentation or types of background noise) may enhance the potential clinical use of the brainstem response to speech sounds.
Acknowledgments
The National Institute of Health NIDCD R01-01510 supported this research. We thank the children and their families who participated in this study. We also thank Steven Zecker, for statistical consultation; Erika Skoe, for the development of programs to analyze the data; and also members of the Kraus laboratory who tested subjects and gave their support throughout the study.
Footnotes
The FFR period is 3.5 times longer than the pre-stimulus period, so in order to make an accurate comparison, the spectral magnitude of the 10 ms pre-stimulus period was compared against the average of three 10 ms ranges (12.5–22.5, 22.5–32.5, and 32.5–42.5 ms) within the FFR. This ensured that the same number of points and therefore the same frequency ranges were compared. The pre-stimulus period and each of the 10 ms ranges were demeaned to zero before performing spectral analyses.
References
- Benasich AA, Tallal P. Infant discrimination of rapid auditory cues predicts later language impairment. Behav Brain Res. 2002;136:31–49. doi: 10.1016/s0166-4328(02)00098-0. [DOI] [PubMed] [Google Scholar]
- Boston JR, Møller AR. Brainstem auditory-evoked potentials. Crit Rev Biomed Eng. 1985;13:97–123. [PubMed] [Google Scholar]
- Brandt J, Rosen JJ. Auditory phonemic perception in dyslexia: categorical identification and discrimination of stop consonants. Brain Lang. 1980;9:324–37. doi: 10.1016/0093-934x(80)90152-2. [DOI] [PubMed] [Google Scholar]
- Cunningham J, Nicol T, Zecker SG, Bradlow A, Kraus N. Neurobiologic responses to speech in noise in children with learning problems: deficits and strategies for improvement. Clin Neurophysiol. 2001;112:758–67. doi: 10.1016/s1388-2457(01)00465-5. [DOI] [PubMed] [Google Scholar]
- Gorga M, Abbas P, Worthington D. Stimulus calibration in ABR measurements. In: Jacobsen J, editor. The auditory brainstem response. San Diego: College-Hill Press; 1985. pp. 49–62. [Google Scholar]
- Hayes EH, Warrier CM, Nicol TG, Zecker SG, Kraus N. Neural plasticity following auditory training in children with learning problems. Clin Neurophysiol. 2003;114:673–84. doi: 10.1016/s1388-2457(02)00414-5. [DOI] [PubMed] [Google Scholar]
- King C, Warrier C, Hayes E. Deficits in auditory brainstem pathway encoding of speech sounds in children with learning problems. Neurosci Lett. 2002;319:111–5. doi: 10.1016/s0304-3940(01)02556-3. [DOI] [PubMed] [Google Scholar]
- Klatt D. Software for cascade/parallel formant synthesizer. J Acoust Soc Am. 1980;67:971–5. [Google Scholar]
- Kraus N, McGee TJ, Carrell TD, King C. Auditory neurophysiologic responses and discrimination deficits in children with learning problems. Science. 1996;273:971–3. doi: 10.1126/science.273.5277.971. [DOI] [PubMed] [Google Scholar]
- Marsh JT, Brown WS, Smith JC. Differential brainstem pathways for the conduction of auditory frequency-following responses. Electroencephalogr Clin Neurophysiol. 1974;36:415–24. doi: 10.1016/0013-4694(74)90192-8. [DOI] [PubMed] [Google Scholar]
- Møller A. Neural mechanisms of BAEP. Electroencephalogr Clin Neurophysiol Suppl. 1999;49:27–35. [PubMed] [Google Scholar]
- Nagarajan S, Mahncke H, Salz T, Tallal P, Roberts T, Merzenich MM. Cortical auditory signal processing in poor readers. Proc Natl Acad Sci USA. 1999;96:6483–8. doi: 10.1073/pnas.96.11.6483. [DOI] [PMC free article] [PubMed] [Google Scholar]
- Quian Quiroga R, Garcia H. Single-trial event-related potentials with wavelet-denoising. Clin Neurophysiol. 2003;114:376–90. doi: 10.1016/s1388-2457(02)00365-6. [DOI] [PubMed] [Google Scholar]
- Smith JC, Marsh JT, Brown WS. Far-field recorded frequency-following responses: evidence for the locus of brainstem sources. Electroencephalogr Clin Neurophysiol. 1975;39:465–72. doi: 10.1016/0013-4694(75)90047-4. [DOI] [PubMed] [Google Scholar]
- Starr A, Don M. Brain potentials evoked by acoustic stimuli. In: Picton TW, editor. Handbook of electroencephalography and clinical neurophysiology. Amsterdam: Elsevier; 1988. pp. 97–150. [Google Scholar]
- Tonnquist-Uhlen I. Topography of auditory evoked long-latency potentials in children with severe language impairment: the P2 and N2 components. Ear Hear. 1996;17:314–26. doi: 10.1097/00003446-199608000-00003. [DOI] [PubMed] [Google Scholar]
- Wible B, Nicol T, Kraus N. Abnormal neural encoding of repeated speech stimuli in noise in children with learning problems. Clin Neurophysiol. 2002;113:484–94. doi: 10.1016/s1388-2457(02)00017-2. [DOI] [PubMed] [Google Scholar]
- Wible B, Nicol T, Kraus N. Atypical brainstem representation of onset and formant structure of speech sounds in children with language-based learning problems. Biol Psychiatry. doi: 10.1016/j.biopsycho.2004.02.002. in press. [DOI] [PubMed] [Google Scholar]
- Worden FG, Marsh JT. Frequency-following (microphonic-like) neural responses evoked by sound. Electroencephalogr Clin Neurophysiol. 1968;25:42–52. doi: 10.1016/0013-4694(68)90085-0. [DOI] [PubMed] [Google Scholar]