

Abstract
A new and simple method permits control of the electrochemically active area of a carbon fiber microelectrode. An electrophoretic photoresist insulates the 10 μm diameter carbon fiber microelectrodes. Photolysis of the photoresist followed by immersion of the exposed area into a developing solution reveals electroactive carbon fiber surface. The electroactive surface area exposed can be controlled with a good degree of reproducibility.
Introduction
The use of microelectrodes over the past few decades has become common in many research laboratories. This is due to several advantages over “normal” sized electrodes. The small size of microelectrodes allows for a short diffusion time scale and low double-layer capacitance. These two properties of microelectrodes allow for increased spatial and temporal resolution when compared to their larger counterparts in voltammetry1, 2, scanning electrochemical microscopy3-6 and electroporation7.
Carbon fibers are commonly used for the construction of microelectrodes because of their low cost, commercial availability in small diameters, ease in modification of the carbon surface, and versatility in the detection of electrochemically active species 8-15. There are many different methods of carbon fiber microelectrode fabrication, each with their advantages and disadvantages 16-22. Unfortunately, other than physically cutting the microelectrode shaft emanating from its glass insulating shroud, no method permits control over the electroactive area of the carbon fiber. Further, no method allows for the ability to increase this area without making a new microelectrode. This paper describes a fabrication process that allows one to coat a carbon fiber microelectrode with an insulating layer23. This insulating layer can then be selectively removed from the microelectrode allowing one to control area of the carbon fiber that will be electrochemically active. Furthermore, the simplicity and flexibility of the procedure may allow for new possibilities in creating multiple electrode devices.
Experimental
Chemicals and Materials
The 10 μm carbon fibers were provided by Amoco Performance Products Inc. (Thornell Carbon Fiber, P-55 3K, Greenville, SC) and the electrophoretic photoresist was donated by PPG (Photoimage™, Pittsburgh, PA). All chemicals were of analytical reagent grade purity and were used as received. The reagents used were: KCl (Mallinkrodt AR 7447−40−7, Paris, KT), K4Fe(CN)6· 3H2O (Fisher Scientific 14459−95−1, Fair Lawn, NJ), 2-butoxyethanol (Aldrich 111−76−2, Milwaukee, WI), DL-lactic acid (85.9% solution, Sigma-Aldrich 50−21−5, St. Louis, MO), HCl (J.T. Baker 7647−01−0, Phillipsburgh, NJ), isopropanol (EM Science 67−63−0, Darmstadt, Germany), K3Fe(CN)6 (Fisher Scientific 13746−66−2, Fair Lawn, NJ), ruthenium hexamine trichloride (RH) (Polysicences, Inc. 14282−91−8, Warrington, PA), hydroquinone (H2Q) (Aldrich 123−31−9, Milwaukee, WI), and NaOH (J.T. Baker 1310−73−2, Phillipsburgh, NJ). All solutions were prepared with Milli-Q A-10 water.
Apparatus
Cyclic voltammetric (CV) measurements were performed using a computer controlled BASi Epsilon-EC (Bioanalytical Systems, Inc., West Lafayette, IN). Optical images were taken with a Hamamatsu 1394 ORCA-285 camera (Japan) connected to an Olympus IX71 inverted microscope (Olympus America Inc., Melville, NY) with the help of imaging software SimplePCI (Compix Inc., Imaging Systems, Cranberry Township, PA). Plasma cleaning was done with a Plasma Cleaner PDC-3XG (Harrick, Ossining, NY).
The two electrode cells consisted of a carbon fiber working microelectrode and a Ag/AgCl (3 M NaCl) counter electrode. All CV measurements were performed at room temperature (22°C ± 3 °C) with a scan rate of 150 mV and a 5 second quiet time in a 1 mM electroactive species (ferrocyanide, ferricyanide, RH, or H2Q) with a 0.1 M KCl supporting electrolyte solution. The RH solutions were deaerateded with argon.
Fabrication of Carbon Fiber Microelectrodes
Carbon fibers, 10 μm in diameter and 5 cm or greater in length, are attached to a copper wire (Goodfellow Cambridge Limited, Huntingdon, England) 0.5 mm in diameter and 12 cm or greater in length, using a silver conducting paint (SPI Supplies, West Chester, PA). After the silver paint is allowed to dry, 10 minutes or longer, the copper wire/carbon fiber is threaded into a borosilicate glass capillary (Sutter Instruments, Co., Novato, CA) with a 0.75 mm inner diameter, 1 mm outer diameter, and a length of 10 cm, copper end first. Once the copper wire/carbon fiber junction is pulled slightly over half way into the capillary, it is fixed in place using Epoxi-Patch (The Dexter Corporation, Seabrook, NH) to seal the copper connector wire to the glass. The epoxy is allowed to cure overnight before the capillaries are pulled using a standard vertical micropipette puller (Narishige, Tokyo, Japan). The capillary must be positioned so that the carbon fiber/copper wire junction is above the heating coil of the puller. The carbon fiber protruding from the tip of the pulled capillary is cut to the desired length, ∼1 mm in our case, using a microscope with an ocular micrometer and a scalpel. The seal of the glass/carbon fiber junction is reinforced by placing the glass/carbon fiber junction in a resistively heated metal loop for ∼3 minutes. The carbon fiber microelectrode is now immersed in acetone for 5 minutes. This removes the sizing compound from the carbon fiber and can be used as a preliminary indicator of a good or bad seal between the glass capillary and carbon fiber. The appearance of acetone on the inside of the glass capillary indicates a bad seal. If a bad seal is indicated, the acetone inside the capillary is allowed to evaporate before the electrode is resealed in the resistively heated metal loop. If a good seal is indicated, the electrode is then sonicated for 10 minutes in isopropanol with activated carbon, before being tested using CV. After the CV, the electrode is then rinsed in Milli-Q water and allowed to dry before application of the photoresist.
Application and Removal of Photoresist
The Photoimage™ is diluted as recommended by the manufacture and stored in a non-transparent container at room temperature. A stainless steel cylinder, 3 cm in length and 0.75 cm in diameter, closed at one end acts as both the electrochemical cell and counter electrode in the electrochemical setup. The photoresist is electrodeposited for 60s at −3.25 V onto the carbon fiber microelectrode using Controlled Potential Electrolysis (CPE with a BASi Epsilon-EC). The photoresist is then cured at 120 °C for 1 hour. A second application of the photoresist at the same potential for 30 seconds is administered to fill any defects in the insulating coating, and is cured identically to the first coating. The insulation is tested for defects using cyclic voltammetry. A peak current > 50 pA indicates a defective coating. The electrodes with a defective coating are coated and cured for a third time, using the identical treatment as the second, and retested. Electrodes appearing defective after this third coating are discarded. Insulated and tested carbon fiber microelectrodes are rinsed with Mill-Q water and allowed to dry prior to light exposure.
A mercury-doped xenon arc lamp (Oriel, Stratford, CT) was used as the light source due to its high output in the UV wavelength range, 320 nm – 380 nm, that is required to remove the photoresist. The directions of the photon flux and the long axis of the electrode are aligned parallel to each other, as shown in Fig. 1. This arrangement was used so that only the tip of the electrode is exposed. Exposure times varied. Following the exposure of the electrode to light, it is placed in the developing solution, an aqueous solution of 2-butoxyethanol and lactic acid, for 30 seconds. Unless otherwise stated, the respective concentrations were 8 vol% and 10 vol%. Electrodes are rinsed in two different baths of Milli-Q water and allowed to dry before repeating the exposure and development steps if desired. After the carbon fiber microelectrodes dry from their final rinse in the Milli-Q water, the amount of the carbon fiber exposed is estimated using CV and optical images.
Figure 1.

The alignment of the light source and the tip of the coated microelectrode.
Results
Electrodeposition of Photoresist
There is a correlation between the shape of the current-time transient during deposition for the first coating and the appearance of the coating. Fig. 2a shows a sample current versus time plot. This type of curve is correlated with an even coating on the electrode, like that shown in Fig. 2b. A current versus time plot, like the example in Fig. 3a, produces an irregular electrode coating, which is shown in Fig. 3b. The electrode coating shown in Fig. 3b is characteristic of a carbon fiber microelectrode that was not soaked in acetone to remove the sizing.
Figure 2.
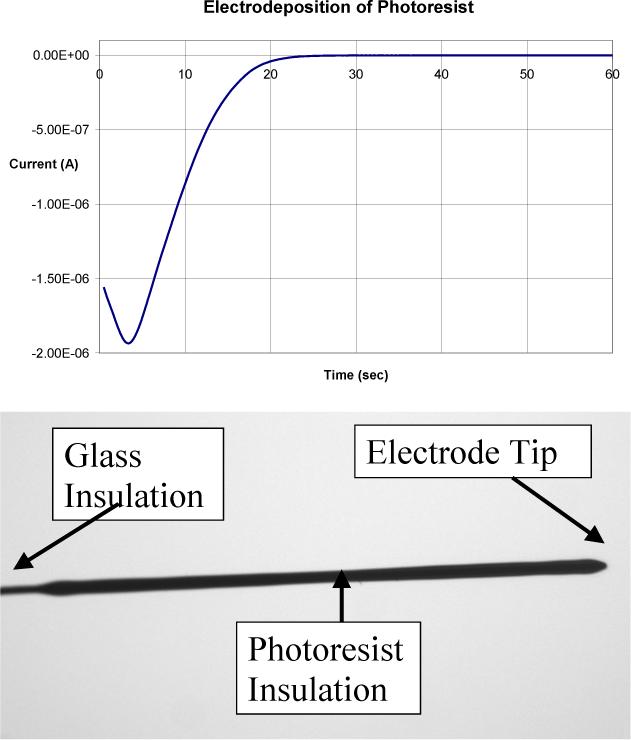
a) Current vs. time for the electrodeposition of the photoresist. b) An optical photograph of the coated microelectrode produced. Both are data from same microelectrode.
Figure 3.
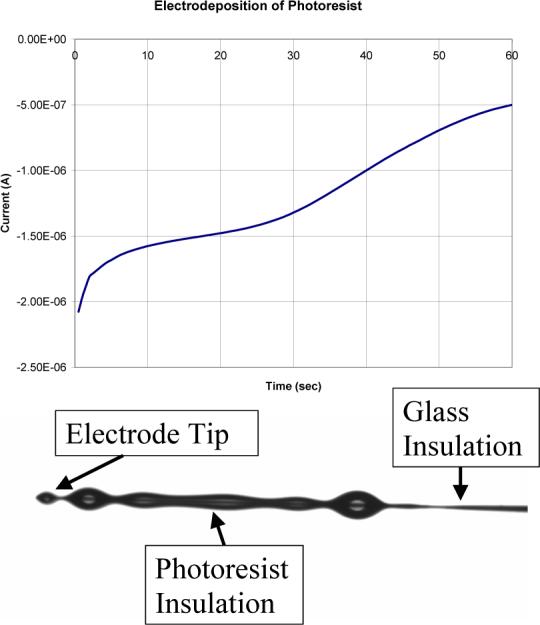
a) Current vs. time for the electrodeposition of the photoresist coating. b) An optical photograph of the coated microelectrode produced. Both are data from microelectrode.
The thickness of the coating put on the carbon fiber microelectrode can be controlled by varying the temperature of the photoresist solution during the electrodeposition process. Though only two different temperatures have been probed, these results coincide with what the photoresist's manufacture has observed with a metal substrate. Electrodeposition of the photoresist solution at room temperature, 22° C ±2°, and 35° C ±1°, create coatings of two visually different thicknesses, Fig. 4. The coating thickness when electrodeposited at room temperature is approximately 5 μm, while it is approximately 2 μm at 35° C. Both of these microelectrodes underwent four 7.5 minute exposure/development trials before the photographs were taken. This trend was also evident when metals were used as the substrate for the photoresist in our laboratory.
Figure 4.

a) A 10 μm carbon fiber microelectrode that was coated at room temperature, 22°C ±2°. b) A 10 μm carbon fiber microelectrode that was coated at 35°C ±1°. The 10 μm carbon fiber which can be seen in each image, acts as a scale marker.
Development of Exposed Electrodes
After the coated carbon fiber microelectrode is exposed to light it has to be immersed in an aqueous solution of 2-butoxyethanol and lactic acid, known as the developing solution, to remove the photoresist from the electrode. The manufacture's suggested concentrations, 2% 2-butoxyethanol and 1% lactic acid, were tried first, but these conditions were not “strong” enough to remove the photoresist. This could have been due to the difference in substrate, metal versus carbon, or the difference in curing time, 5 versus 60 minutes. After these initial trials, higher concentrations, up to 12 %, of the two components were tested. High concentrations of the two components cause removal of the non-exposed photoresist. We assessed the developing solution's nature using voltammetry. Following exposure and development of microelectrodes, they were photographed and subjected to CV in 1 mM K4Fe(CN)6 /0.1 M KCl. Theoretical steady state currents could be estimated from the dimensions of the exposed electroactive area based on the optical images. Results from CV were compared to these theoretical currents. The developing conditions were classified as being “too weak” if the experimental current was less than half of the corresponding theoretical current. They were classified as “too aggressive” if the experimental current was more than twice the theoretical current. Microelectrodes that had an experimental current that was more than half but less than twice the theoretical current were classified as having had “normal” developing conditions (the Goldilocks conditions). Results for various developers are compared in Table 1. A developing solution of 8% 2-butoxyethanol and 10% lactic acid was chosen because it gave the highest percentage of electrodes that fell into the “normal” classification.
Table 1.
Determination of optimal etching conditions
| % 2-Butoxyethanol/% Lactic Acid (number of electrodes) | Conditions too Weak | Conditions Normal | Conditions too Aggressive |
|---|---|---|---|
| 4/6 (6) | 100% | 0% | 0% |
| 5/5 (6) | 100% | 0% | 0% |
| 6/4 (6) | 75% | 25% | 0% |
| 6/8 (8) | 75% | 25% | 0% |
| 8/6 (6) | 66.7% | 33.3% | 0% |
| 6/10 (14) | 85.7% | 14.3% | 0% |
| 8/10 (15) | 13.3% | 80% | 6.7% |
| 8/8 (8) | 37.5% | 50% | 12.5% |
| 10/10 (8) | 0% | 50% | 50% |
| 10/6 (6) | 33.3% | 33.3% | 33.3% |
| 10/8 (8) | 12.5% | 37.5% | 50% |
| 12/10 (6) | 0% | 33.3% | 66.7% |
Summary of several different developing solution concentrations tested on electrodes. Microelectrodes were exposed for 7.5 minutes, immersed in the developing solution for 30 seconds, and then exposed and developed for a second time. Conditions too weak indicates little or no photoresist was removed (signal from 1 mM ferrocyanide is < 0.5 nA). Conditions normal indicates exposed photoresist was removed, signal 0.5 − 2 nA. Conditions too aggressive indicates exposed and non-exposed photoresist was removed, signal > 2 nA. Optical microscopy was used to confirm removal of non-exposed photoresist.
Light Exposure
The photoresist used is a negative photoresist. Light exposure in the 320 nm – 380 nm range causes the coating to be susceptible to etching in the exposed area. Carbon fiber microelectrodes were exposed to the light for several different lengths of time. The relationship between the time the electrode is exposed to the light source and the area of the coating removed from the carbon fiber is not linear. This is attributed to the fact that the coating is not removed as it is exposed to light, but it is removed when immersed in the developing solution after light exposure. Many different exposure times were tested, ranging from 5 to 45 minutes per trial. Through trial and error type experiments on over 300 different carbon fiber microelectrodes a light exposure regimen was established. Two light exposures of 7.5 minutes each (followed by immersion in the developing solution) produced electrodes that reproducibly gave a CV signal slightly below what is theoretically predicted for a hemispherical carbon fiber microelectrode (r = 5 μm).
Discussion
This new method of carbon fiber microelectrode production is fairly reproducible. Fig. 5 shows the average ferrocyanide CV of 48 microelectrodes that have all undergone two 7.5 minute light exposures each followed by immersion in a 10% 2-butoxyethanol/8% lactic acid aqueous solution. Unfortunately, the production of two identical electrodes would be quite difficult because of slight electrode to electrode variations throughout this process. The ferrocyanide wave shape is not ideal. We return to this subject below. Waves for H2Q and RH (Figs. 6 and 7) are more well formed.
Figure 5.
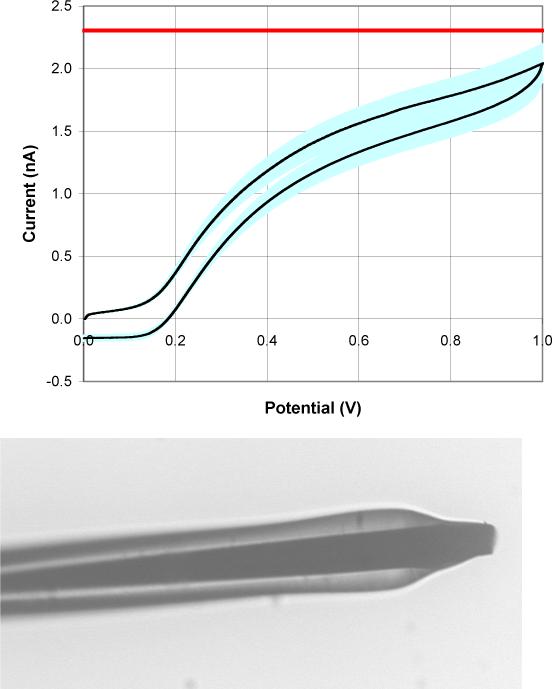
a) The average CV and standard deviation of the mean of 48 microelectrodes that were exposed for 7.5 minutes twice and developed in a 10% 2-butoxyethanol and 8% lactic acid aqueous solution after each exposure. The straight line across the graph at ∼ 2.3 nA is the steady state current predicted for a hemispherical electrode (r = 5 μm) in the testing solution. b) An optical photograph of a microelectrode that has undergone the above treatment.
Figure 6.

A CV in 1 mM H2Q of a sample microelectrode that had been exposed two times for 7.5 minutes and developed in a 10% 2-butoxyethanol and 8% lactic acid aqueous solution after each exposure.
Figure 7.

A CV in 1 mM RH of a sample microelectrode that had been exposed two times for 7.5 minutes and developed in a 10% 2-butoxyethanol and 8% lactic acid aqueous solution after each exposure.
We hypothesized that the photoresist would be removed from the tip of the electrode before being removed from its sides because of the difference in the angle of incidence of the light on the photoresist's surface. The light source is aligned parallel to the long axis of the electrode creating an angle of incidence that is 0° with respect to the normal to the tip surface and ∼90° with respect to the normal to the sides of the electrode, Fig. 1. Our hypothesis is supported by the current at 1.0 V of the average CV created by electrodes that have undergone two 7.5 minute exposures each followed by immersion in the developing solution for 30 seconds (Fig. 5). It is near the current predicted for steady-state at a hemispherical microelectrode with a radius of 5 μm in the same solution. The optical image in Fig. 5 also reinforces our hypothesis that the photoresist is predominately removed from the tip of the electrode with very little, if any, being removed from the sides of the electrode.
The photoresist on the sides of the electrode can be partially removed from multiple exposure/development trials. The peak current of the average CV for a microelectrode exposed four times is noticeably and statistically greater than that for a microelectrode exposed two times for all three analytes, Table 2. The increase in the average peak current led to the hypothesis that the photoresist on the sides of the electrode near its tip was being removed. Reinforcement of this hypothesis can be seen in the optical image of the microelectrode in Fig. 8, which is of the same electrode in Fig. 5, only it has now undergone two additional exposure/development trials (for a total of four). One can clearly see that the photoresist on the sides of the electrode in Fig. 8 has receded when it is compared to the image in Fig. 5.
Table 2.
Limiting current from voltammetry at exposed microelectrodes
| # of 7.5 Minute Exposures | 2 | 4 | 6 |
|---|---|---|---|
| Capacitive Current (0.1 V) | 0.23 ± 0.03 nA (48)b | 0.38 ± 0.08 nA (20) | 0.51 ± 0.09 nA (15) |
| Ferrocyanide current (1 V, anodic) | 2.04a ± 0.15 nA (48) | 2.45 ± 0.36 nA (20) | 2.37 ± 0.34 nA (15) |
| H2Q current (1.2 V, anodic) | 7.57 ± 1.13 nA (9) | 12.75 ± 4.68 nA (9) | 13.65 ± 5.40 nA (9) |
| RH current (−0.5 V, cathodic) | 4.30 ± .64 nA (9) | 8.40 ± 3.08 nA (9) | 10.75 ± 4.25 nA (9) |
The values for ferricyanide are the average of all the microelectrodes that had the specified light exposure. The values for H2Q and RH are the average of a few randomly selected microelectrodes that had the specified light exposure.
error is standard deviation of the mean, number of electrodes in parentheses.
Figure 8.
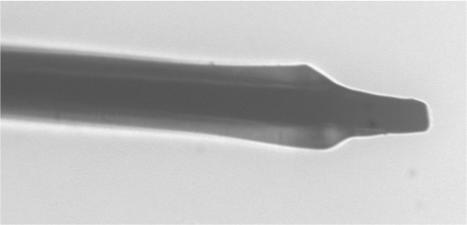
An optical photograph of the same microelectrode in figure 5 that has undergone two additional exposure/development trials, under the same conditions for a total of four.
The next hypothesis we formulated is that more of the photoresist would be removed from the sides of the electrodes if additional exposure/development trials were performed. The current of the average ferrocyanide CV after six trials does not change significantly in comparison to that after four trials, Table 2. Waves for RH and H2Q increased in magnitude, but not linearly with respect to exposed length. The steady-state current is not very sensitive to area for geometries like those shown in Figs. 5, 8 and 9, but the capacitive current is. The capacitive current at 0.1 volts (Table 2) indicates a greater electrochemically active surface area with more exposure/etching cycles. The optical image in Fig. 9, which is the same electrode as the one in the two previous figures, reinforces this hypothesis. One can clearly see that the photoresist on the sides of the electrode in Fig. 9 has receded when compare to the image in Fig. 8. The capacitive current and the optical images portray the same picture. We conclude that photoresist can be removed in a programmed fashion from the surface.
Figure 9.

An optical photograph of the same microelectrode in figures 5 and 8 that has undergone two additional exposure/development trials, under the same conditions for a total of six.
While the photoresist seems to be removed, the voltammetry of ferrocyanide is not ideal. The CVs of ferricyanide had a similar non-ideal shape as the ferrocyanide CVs (data not shown). There have been several papers published on different possible causes for non-ideal ferrocyanide CVs. Some of the possible causes that have been published include a lack of functional groups on the surface26, negative charge on the electrode coating blocking electron transfer27,adsorbed species on the electrode28, and the presence of different enviroments for the reaction to take place29.
We assumed that there was some residue on the surface from the treatment. A variety of treatments including sonication in water and isopropanol and electrochemical treatments in HCl and NaOH were used to try to improve the voltammetric shape, to no avail. We had hoped that ten minutes of sonication would help with the removal of any residue. Sonication in water did not have any apparent effect on the CVs of the microelectrodes, but when isopropanol was used the shape of the CVs worsened. The 50 % HCl electrochemical treatment performed on the microelectrodes came from a paper by Frysz24. In this paper they reported an improvement in the detection of ferricyanide, but this treatment did not show any improvement or degradation in our CV of ferricyanide. The NaOH electrochemical treatment used in our laboratory was very similar to that described in a paper by Schulte with a few minor modifications25. This treatment etches the carbon fiber exposing a fresh carbon surface and makes the electrode slightly smaller in size. Etching times of 1, 2, 5, 10, and 20 seconds were ineffective
Following the failure of the chemical/electrochemical approaches, we turned to plasma cleaning We were hesitant to use plasma cleaning because of possible damage to the electrically insulating photoresist. The microelectrodes were cleaned for one minute on the medium setting with air as the plasma cleaner's supply gas. Fortunately, the electrically insulating property of the remaining photoresist was not affected under these conditions. CVs of ferrocyanide were more ideal in shape, Fig. 10. The shape of the CVs for RH and H2Q were not affected (data not shown). The plasma cleaning did significantly increase the current for all three analytes, but the relative standard deviation of the mean stayed approximately the same, Table 3. We believe that the significant increase in the current for all three analytes is the result of more complete removal of the photoresist from the sides of the microelectrodes. The photoresist on the sides of the microelectrodes may not have been completely removed due to the alignment of the microelectrode and light source during light exposure.
Figure 10.

A sample CV in ferrocyanide of a microelectrode given two 7.5 minute exposures each followed by development in a 10% 2-butoxyethanol and 8% lactic acid aqueous solution and then plasma cleaning.
Table 3.
Limiting currents at etched microelectrodesa before and after plasma cleaning.
| # of 7.5 Minute Exposures | 2 | 4 | 6 | |||
|---|---|---|---|---|---|---|
| Before | After | Before | After | Before | After | |
| K4Fe(CN)6 (nA) | 1.93(± 0.27b) | 4.13 (± 0.52) | 2.15 (± 0.30) | 4.23 (± 0.53) | 4.30 (± 0.60) | 7.50 (± 0.94 |
| H2Q (nA) | 5.60 (± 0.78) | 7.35 (± 0.92) | 5.95 (± 0.83) | 7.50 (± 0.94) | 10.65 (± 1.48) | 13.70 (± 1.7 |
| RH (nA) | 3.25 (± 0.45) | 5.35 (± 0.67) | 3.87 (± 0.54) | 5.70 (± 0.72) | 9.75 (± 1.36) | 13.20 (± 1.6 |
Six microelectrodes were randomly selected from the larger populations that were used to create Table 2. The same microelectrodes were used for the `before' and `after' experiments.
Standard deviation of the mean, n=6.
One possible application of these carbon fiber microelectrodes is the detection of dopamine. Dopamine detection at carbon fibers is known to be surface sensitive, so it is a severe test of the electrode's capabilities30, 31. Several electrodes that were exposed for 7.5 minutes two times and developed in a 10% 2-butoxyethanol and 8% lactic acid aqueous solution after each exposure were used in the in vitro detection of dopamine using fast-scan cyclic voltammetry. For the fast-scan cyclic voltammetry, a computer-controlled potentiostat was linearly ramped at 300 V/s from an initial potential of 0 V to +1 V, then to −0.5 V and back to 0 V versus a Ag/AgCl reference electrode. These CVs were performed using a flow cell in a phosphate-buffered saline (PBS) solution and a 5 μM dopamine spiked PBS solution. Before the initial CV, the electrodes were electrochemically pretreated (but not plasma cleaned), which is commonly done in preparation for the in vivo determination of dopamine with carbon fiber microelectrodes. The electrochemical pretreatment, which is a 50 Hz, 0 V to +2 V triangle wave applied for 1.5 seconds, was performed in a flow cell in a PBS solution. The fast-scan CVs and pretreatment of the carbon fiber microelectrodes were carried out at room temperature. The background subtracted CV of a sample electrode is shown in Fig. 11. The characteristic shape of the dopamine wave is evident in the CV. Thus, we conclude that the coating and selective removal processes illustrated here do not detrimentally change the carbon fiber surface.
Figure 11.

The average of six CVs of a microelectrode that was exposed for 7.5 minutes two times and developed in a 10% 2-butoxyethanol and 8% lactic acid aqueous solution after each exposure, in 5 μM dopamine spiked PBS solution. The electrode was electrochemically pretreated, which is commonly done in preparation for the in vivo determination of dopamine with carbon fiber microelectrodes.
With this method of carbon fiber microelectrode fabrication one can control how much of the photoresist coating is removed from the carbon fiber microelectrodes by controlling the duration of exposure to light. This allows the production of electrodes that have a specific electrochemically active surface area within a small range.
Acknowledgements
This project was financially supported by the National Institutes of Health (R-01 GM66018). We would like to thank Dr. Stephen Zawacky at PPG for the donation of Photoimage™ and Joe Mitala and Prof. Adrian Michael for assistance in the fast scan cyclic voltammetry of dopamine.
We also thank a reviewer for pointing out the possibility that such electrodes may be suitable for multiple-electrode devices.
References
- 1.Wipf DO, Michael AC, Wightman RM. Journal of Electroanalytical Chemistry and Interfacial Electrochemistry. 1989;269:15–25. [Google Scholar]
- 2.Wightman RM. Analytical Chemistry. 1981;53:1125A–1126. 1128A, 1130A, 1132A, 1134A. doi: 10.1021/ac00232a791. [DOI] [PubMed] [Google Scholar]
- 3.Lee C, Miller CJ, Bard AJ. Analytical Chemistry. 1991;63:78–83. [Google Scholar]
- 4.Mirkin MV. Scanning Electrochemical Microscopy. 2001:145–199. doi: 10.1146/annurev.anchem.1.031207.112938. [DOI] [PubMed] [Google Scholar]
- 5.Mirkin MV, Fan FRF, Bard AJ. Journal of Electroanalytical Chemistry. 1992;328:47–62. [Google Scholar]
- 6.Bard AJ, Fan FRF, Kwak J, Lev O. Analytical Chemistry. 1989;61:132–138. [Google Scholar]
- 7.Olofsson J, Nolkrantz K, Ryttsen F, Lambie BA, Weber SG, Orwar O. Current Opinion in Biotechnology. 2003;14:29–34. doi: 10.1016/s0958-1669(02)00003-4. [DOI] [PubMed] [Google Scholar]
- 8.Tomita Y, Inooka G, Shimada H, Maruyama Y. Pfluegers Archiv. 1994;428:69–75. doi: 10.1007/BF00374753. [DOI] [PubMed] [Google Scholar]
- 9.Navera EN, Sode K, Tamiya E, Karube I. Biosensors & Bioelectronics. 1991;6:675–680. doi: 10.1016/0956-5663(91)87021-3. [DOI] [PubMed] [Google Scholar]
- 10.Kawagoe KT, Jankowski JA, Wightman RM. Analytical Chemistry. 1991;63:1589–1594. doi: 10.1021/ac00015a017. [DOI] [PubMed] [Google Scholar]
- 11.Nomura S, Nozaki K, Okazaki S. Bunseki Kagaku. 1994;43:719–722. [Google Scholar]
- 12.Wang J, Rivas G, Chicharro M. Journal of Electroanalytical Chemistry. 1997;439:55–62. [Google Scholar]
- 13.Hou W, Ji H, Wang E. Analytica Chimica Acta. 1990;230:207–211. [Google Scholar]
- 14.Rice ME, Nicholson C. Analytical Chemistry. 1989;61:1805–1810. doi: 10.1021/ac00192a005. [DOI] [PubMed] [Google Scholar]
- 15.Tamiya E, Sugiura Y, Navera EN, Mizoshita S, Nakajima K, Akiyama A, Karube I. Analytica Chimica Acta. 1991;251:129–134. [Google Scholar]
- 16.Zhao G. 1994.
- 17.Chen S, Kucernak A. Electrochemistry Communications. 2002;4:80–85. [Google Scholar]
- 18.Abe T, Matsue T, Uchida I. Hyomen Gijutsu. 1989;40:76–77. [Google Scholar]
- 19.Cheng C-C, Young M-S, Chuang C-L, Chang C-C. Biosensors & Bioelectronics. 2003;18:847–855. doi: 10.1016/s0956-5663(02)00158-6. [DOI] [PubMed] [Google Scholar]
- 20.Zhang X, Zhang W, Zhou X, Ogorevc B. Analytical Chemistry. 1996;68:3338–3343. doi: 10.1021/ac9600969. [DOI] [PubMed] [Google Scholar]
- 21.Huang W-H, Pang D-W, Tong H, Wang Z-L, Cheng J-K. Analytical Chemistry. 2001;73:1048–1052. doi: 10.1021/ac0008183. [DOI] [PubMed] [Google Scholar]
- 22.Koh D-S, Hille B. Journal of Neuroscience Methods. 1999;88:83–91. doi: 10.1016/s0165-0270(99)00020-5. [DOI] [PubMed] [Google Scholar]
- 23.Slevin CJ, Gray NJ, Macpherson JV, Webb MA, Unwin PR. Electrochemistry Communications. 1999;1:282–288. [Google Scholar]
- 24.Frysz CA, Chung DDL. Carbon. 1997;35:1111–1127. [Google Scholar]
- 25.Schulte A, Chow RH. Analytical Chemistry. 1998;70:985–990. doi: 10.1021/ac970934e. [DOI] [PubMed] [Google Scholar]
- 26.Engstrom RC. Analytical Chemistry. 1982;54:2310–2314. [Google Scholar]
- 27.Lyne PD, O'Neill RD. Analytical Chemistry. 1990;62:2347–2351. doi: 10.1021/ac00220a016. [DOI] [PubMed] [Google Scholar]
- 28.Pharr CM, Griffiths PR. Analytical Chemistry. 1997;69:4665–4672. [Google Scholar]
- 29.Collyer SD, Davis F, Lucke A, Stirling CJM, Higson SPJ. Journal of Electroanalytical Chemistry. 2003;549:119–127. [Google Scholar]
- 30.Michael AC, Justice JB., Jr. Analytical Chemistry. 1987;59:405–410. doi: 10.1021/ac00130a006. [DOI] [PubMed] [Google Scholar]
- 31.Sujaritvanichpong S, Aoki K, Tokuda K, Matsuda H. Journal of Electroanalytical Chemistry and Interfacial Electrochemistry. 1986;198:195–203. [Google Scholar]