Abstract
Single-cell electroporation uses microelectrodes, capillaries or micropipets positioned near single, adherent cells to increase transiently the membrane permeability of the cell. The increased permeability permits, for example, transfection without chemical reagents. When using microelectrodes for applying an electric field to the cell, there is a question of how much voltage to apply. Unlike in bulk electroporation where hundreds of volts may be applied between electrodes, a rather small voltage is applied to a microelectrode in single-cell electroporation. In the single-cell experiment with microelectrodes, a substantial fraction of the voltage is lost at the interface, and does not therefore exist in solution. This problem is the same as the classical electrochemist's problem of knowing the ‘iR’ drop in solution and correcting for it to obtain true interfacial potential differences. Therefore, we have used current interruption to determine the iR drop in solution near microcylinder electrodes. As the field is inhomogeneous, calculations are required to understand the field distribution. Results of the current interruption are validated by comparing two independent measurements of the resistance in solution: one value results from the measured iR drop in conjunction with the known applied current. The other value results from a measured solution conductivity and a computed cell constant. We find substantial agreement in the range of resistances from about 2 to 50 kΩ, but not at higher resistances. We propose a simple, four-step plan which takes a few minutes to calculate the approximate current required to electroporate a cell with an electrode of a particular size, shape and distance from the cell. We validate the approach with electroporation of single A549 cells.
For several decades, microelectrodes have been used in research laboratories in numerous techniques1-7. One distinctive property of microelectrodes is the small currents and convergent flux to them. These small currents and convergent flux result in a small iR drop in solution. In fact, the iR drop at microelectrodes is generally considered insignificant in most cases. In cases where the iR drop is not considered insignificant, i.e. fast-scan cyclic voltammetery, it is compensated for, but not typically measured8-12.
Recently, Orwar's group7 showed that single cells could be electroporated with microelectrodes. Electroporation results when cells are placed in an electric field13-15. Transient pores are formed in the cell membrane, allowing molecules to diffuse in and out of the cell based on their chemical potential gradients. Historically, electroporation has been carried out on cells in suspension exposed to a homogeneous electric field (Fig. 1). At microelectrodes, the electric field in solution is inhomogeneous (Fig. 1). The electric field decreases rapidly with increasing distance from the microelectrode. Thus, electroporation with microelectrodes can achieve high resolution as shown schematically in Fig. 1. To make microelectrode-based single-cell electroporation a predictable experiment, both the shape of the electric field and the total voltage dropped through solution must be known. Of course, this is the same voltage that is termed ‘iR drop’ in electrochemical circles. Once the iR drop is known, the field at any point in the solution can be determined from doing a calculation of the shape of the field by finite element analysis16. With this knowledge, and the threshold transmembrane potential required to electroporate the cell, one can calculate the iR drop needed for electroporation with a microelectrode of particular dimensions and a particular distance away from the cell.
Figure 1.
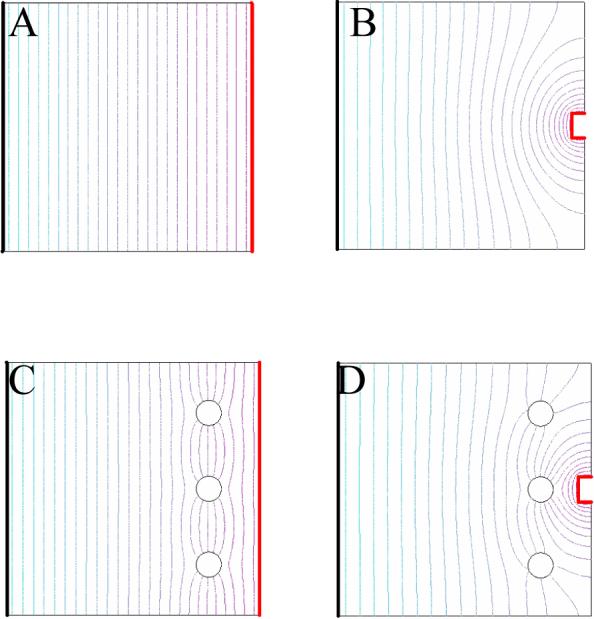
A) The electric field produced by the planar working electrode, on the left, is homogeneous, as shown by the evenly spaced equipotential lines. B) The electric field produced by the working microelectrode, on the right, is not homogeneous. C) The homogeneous electric field produced in bulk electroporation permits the three cells, the empty circles, to feel the same electric field. D) The inhomogeneous electric field produced by a microelectrode causes the electric field felt by the middle cell to be stronger than the other two.
In principle, the iR drop in solution could be controlled experimentally by controlling the current applied to the microelectrode, and combining the current, i, with a known resistance of the electrolyte solution. This resistance, however, is not trivially determined. The resistance of a solution depends on the resistivity of the medium and a geometric factor (called the ‘cell constant’ by electrochemists) of the working electrode/electrolyte solution/counter electrode system. The cell constant depends on the geometry of the microelectrode, and is only easily determined analytically for a hemisphere, disc or cylinder in a coaxial arrangement with only radial flux17.
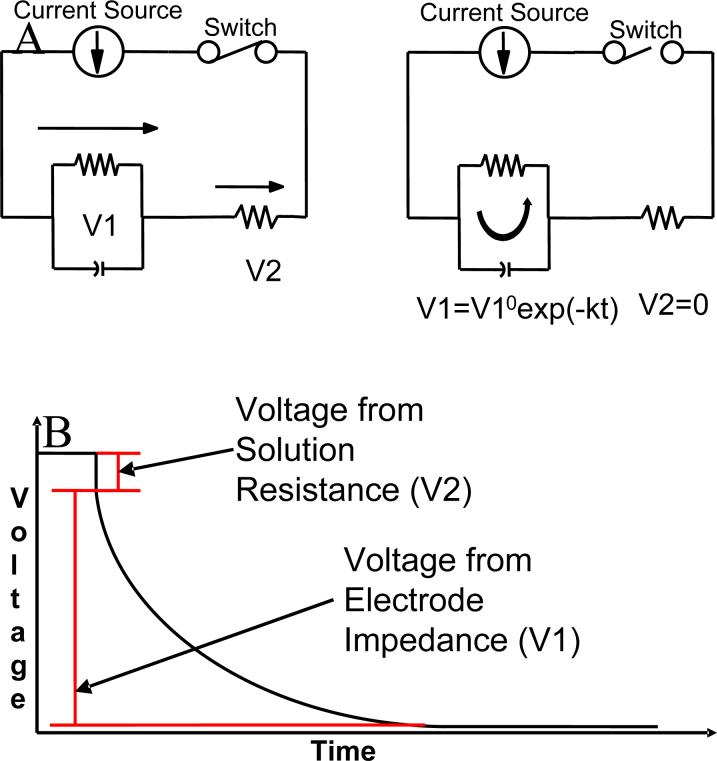
This paper describes the determination of the iR drop at microelectrodes. The current interruption technique18-22 schematically illustrated in Fig. 2, determines the value of the voltage drop in solution for a given current. This technique works by applying a constant current to an electrochemical cell, and quickly switching this current off. The output signal has two distinct regions: 1) an instantaneous drop and 2) an exponential decay. The instantaneous drop is the iR drop whereas the exponentially decaying voltage is attributed to the electrode discharging through the electrolyte/electrode interfacial impedance. We recognize that the determination of iR drop by current interruption, while straightforward, does require some instrumentation and time. It would be convenient to be able to calculate iR drop as described above from the applied current, solution resistivity, and a cell constant, κ. We therefore have calculated cell constants for a variety of electrode geometries.
Figure 2.
A) In the left figure, the switch is closed; current flows through both resistors (resulting in voltage V1 and V2), and charges the capacitor. In the right figure, the switch is open; current (discharge of the capacitor) only flows through the first resistor resulting in voltage V1, which would decay exponentially, and no current flows through the second resistor. B)An idealized signal that would be produced by a current interruption experiment.
We find, fortunately, that κ as a function of electrode length is expressed with high accuracy by a simple power-law expression. Values of measured resistance (current interruption) and resistance expected based on the computed cell constants are in good agreement over a significant range of resistances. Finally, we propose a protocol to predict the current required for electroporation and demonstrate its validity.
Experimental
Materials and Equipment
The materials and procedures used to fabricate the uncoated microelectrodes used in the current interruption experiments are described in an earlier paper.23 The microelectrodes consist of a 10 μm diameter carbon fiber (Amoco Performance Products, Inc. (Thornell P-55 3K) Greenville, SC) attached to a copper wire with silver paint (SPI Supplies, West Chester, PA). This construct is glued into a glass capillary with epoxy resin at the back end through which the copper wire protrudes. The front end (carbon fiber) is sealed by reheating the pulled glass capillary with an in-house built apparatus. All microelectrodes were characterized with cyclic voltammetry in K4Fe(CN)6 solution. All chemicals were of analytical reagent grade purity and were used as received: KCl (Mallinkrodt, Paris, KT), potassium ferrocyanide, K4Fe(CN)6 · 3H2O (Fisher Scientific, Fair Lawn, NJ), quinhydrone (Aldrich, Milwaukee, WI), methyl orange (Aldrich, Milwaukee, WI), and Iso-osmolar Electroporation Buffer (Eppendorf), which will be referred to as Iso in the rest of the paper. The fluorescent labels Thioglo-1 (Covalent Associates, Woburn, MA) and calcein AM (Invitrogen/Molecular Probes, Eugene, OR) were used for imaging the cells in fluorescent microscopy. The solution conductivity measurements where made by a conductivity meter (Model 604 Amber Science Inc., San Diego, CA). All solutions were prepared with Milli-Q (Millipore Syntheis A10, Billerica, MA) water.
Carbon Fiber Resistance
The resistance of the carbon fiber and its junction with the copper wire in the microelectrodes were determined experimentally. A carbon fiber was attached on both ends to a copper wire with silver paint, as described above. The resistance of this construct was then measure with an ohmmeter and the length of the fiber was determined with a ruler. The carbon fiber was cut near one of the two copper wires. The silver paint was removed with acetone and reattached to the cleaned copper wire. The length of the carbon fiber and the resistance was measured again. This was repeated on 3 different carbon fibers so that 5 different lengths and resistances were measured per carbon fiber. The resistances were plotted versus carbon fiber lengths for each of the carbon fibers. The average of the slopes for these plots was 0.91 kΩ/cm and the average y-intercept was 0.19 kΩ, which is the resistance of two carbon fiber junctions with the copper wire. The length of the carbon fiber in the microelectrodes was estimated to be 2 cm and had only one carbon fiber junction with the copper wire. This gave an estimated fiber resistance, Rf, of 1.9 kΩ for a microelectrode.
Apparatus
All current interruption experiments were carried out in a thermostated electrochemical cell at 23°C. The temperature was kept constant using a water bath (Haake, K10) and immersion circulator (Haake, DC 10). A two electrode setup was used with a carbon fiber microelectrode as the working electrode and a 1.5 cm by 1.5 cm platinum wire mesh (Goodfellow) as the counter electrode, which was grounded. The current interruption device used was built in-house by the electronics shop in the chemistry department at the University of Pittsburgh.
FEMLAB Simulations
A computer simulation program, formerly FEMLAB now COMSOL Multiphysics, was used to simulate the shape and strength of the electric field produced by microelectrodes of a variety of dimensions and to calculate their cell constants. The simulations used for calculating the cell constants were completed using FEMLAB 3.0a, and the electric field simulations used COMSOL Multiphysics 3.2. All of the simulations were performed in the “Conductive Media DC with Axial Symmetry (2D) Model”, which solves for the following equation:
| (1) |
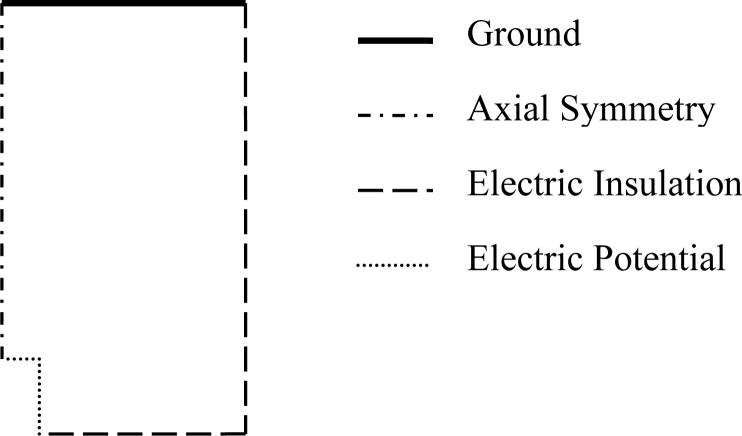
where σ is conductivity and V is potential. The geometric shape and boundary conditions for both types of simulations were similar and are shown in Fig. 3. The cell dimensions in the two types of simulations were different. The electric field simulations were in a cell 5 cm by 2.5 cm. The cell constant simulations were in a cell 1 m by 0.5 m. The electric field simulations had 80,000 − 120,000 elements and the cell constant simulation had 180,000 − 220,000. The global mesh parameters for both simulation types were set to the predefined mesh size of ‘finer’. The mesh around the microelectrode is refined by creating a subdomain 5 mm by 2.5 mm around the microelectrode and specifying a maximum element size of 50 μm and a growth rate of 1.15 in that subdomain. The mesh around the microelectrode was then selectively refined further until the size of the elements bordering the microelectrode was 1 μm or smaller. The extremely fine mesh around the microelectrode is required because of the high field in this region. The mesh bordering the ground in the cell constant simulations was also selectively refined, because the electric field close to this boundary is required for calculating the cell constant.
Figure 3.
The boundary conditions and geometry used to simulate the electric field and to help calculate cell constants. The relative size of the microelectrode, for which the boundary condition is constant potential, is increased for visibility. This particular geometry is referred to in the tables as ‘cylinder’. Appropriate changes in the geometry are made for ‘conical’ etc..
The following equation was used to calculate the cell constant (κ) for the microelectrodes:
| (2) |
The numerator is the integral of the electric field over the z axis, the symmetry axis. r The denominator of the equation is the integral of the electric field normal to an isopotential line over the area through which the current flows. The numerator of Eq. 2 is equal to ΔV. With this substitution and by setting the potential of the microelectrode at 1 volt versus the ground electrode, the numerator is 1 with the units of volts in equation 2. The denominator is calculated at the planar counter electrode by the discrete approximation, Eq. 3,:
| (3) |
where is the field at the nth radius, rn. In eq. 3, N=1001.
Current Interruption
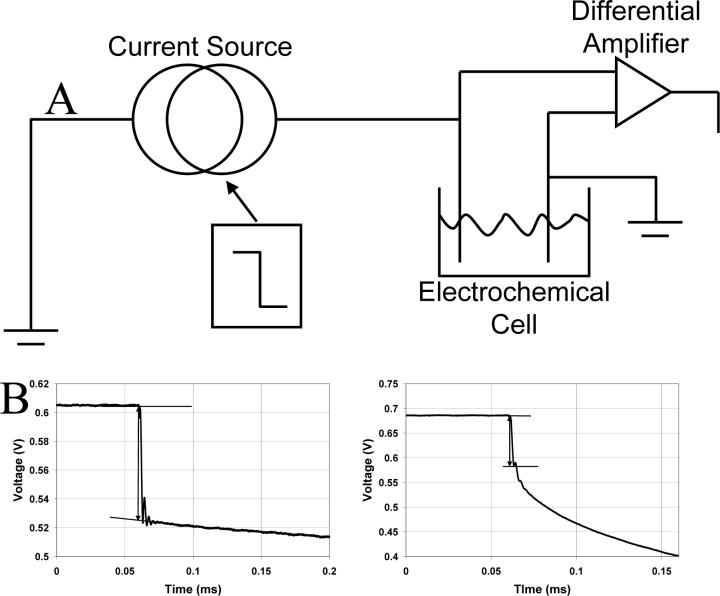
A block diagram of the in-house built current interruption device and examples of experimental data are shown in Fig. 4. The device requires a signal voltage which is converted to an applied current. A unipolar square wave from a function generator (Stanford Research Systems Model DS345) was used as the voltage source. The electrochemical cell consists of a counter electrode, working microelectrode, and a conductive solution in a container. The signal from the current interruption device is captured using a fast acquisition oscilloscope (LeCroy Model 9410), which was externally triggered by the same function generator that was used as the current source. The data acquired by the oscilloscope were then passed to a computer in text file format using a GPIB connection and National Instruments software (LabWindows CVI Version 7.1). In a given experiment, a typical protocol is to apply 1 μA for 10 s, drop to 0 μA (‘interruption’) for 10 s, and repeat 10 times. Ten transients were averaged. The results were not affected by doing a series of interruptions, but the precision was improved over single pulse experiments. In practice, the microelectrodes used in the experiments reported here varied in length from 0 to 1,600 μm. Often, cutting the microelectrode with a scalpel leaves a tip with a point. During use, the tip erodes to a hemispherical shape. This change in shape can be attributed to the higher current density at the pointed tip, which causes the carbon fiber to be etched.
Figure 4.
A) A block diagram of the in-house built current interruption device used in our current interruption experiments. B) Plots of two current interruption experiments that were performed on 10 μm diameter carbon fibers. These plots represent cases in which the measurement of the voltage drop is straightforward (left) and where it is less so (right). In the cases where the ringing in combination with a rapid decay of the double layer voltage makes distinguishing the transition between iR drop and double layer drop, we take the measurement to the first ‘minimum’ as shown. The lengths of the microelectrodes are approximately 415 μm for the left and 60 μm for the right plot.
Cell culture
Basal medium Eagle, supplemented with 10 % fetal bovine serum, and 1 % antibiotic was used to culture human lung cancer A549 cells. Cells were grown in 75 mL cell culture flasks in a CO2 cell culture incubator (HERA cell incubator, Newtown, CT) at 37° C and 5 % CO2 to about 80 % confluency. Before the experiments, cells were plated on 35 mm glass bottom cell-culture dishes (MatTek Corporation, Ashland, MA) and were grown for 1−3 days. Experiments were performed on the 2nd and 3rd day following the cell plating.
Cell staining
Prior to the experiments, the cells were stained with the dye Thioglo-1 (2 μM in Iso) for 60 seconds at room temperature or calcein AM (2.5 μM in Iso) for 30 min in the incubator. Thioglo-1 is a cell permeable maleimide-based reagent which gives a highly fluorescent, cell-impermeant product upon its reaction with active SH groups24, 25. To remove excess uncaptured dye, the cells were washed in Iso twice. Cells were bathed in the buffer and mounted on the cell chamber (DH 35i culture dish incubator, Warner Instruments, Holliston, MA) and transferred to the stage of the microscope.
Fluorescence Imaging
Cells were observed using an inverted microscope (Olympus, IX 71, Melville, NY) with an Olympus 20× 0.7 NA objective or occasionally a 40× 1.3 NA oil immersion objective. The HBO 100 W mercury lamp in the microscope was used as the excitation source. For Thioglo-1, an Omega fluorescence cube (specially built, Omega, Brattleboro, VT) was used with filters for excitation at 378 nm and emission at 480 nm. For calcein we used excitation: λex = 494 nm and emission: λem = 530 nm. A 12 bit, digital output charged couple device (CCD) camera (Hamamatsu, ORCA-285, Bridgewater, NJ) imaged cells. The image collection frequency was 1 s−1. The gain was set manually, and exposure times were between 0.1 and 0.3 s/frame. Image processing was performed by the image acquisition software from Compix (Simple PCI).
Results and Discussion
Potential along the z-axis in solution
The electric fields for disc, conical, hemispherical and cylindrical microelectrodes protruding from an insulating plane, as well as for a cylinder with an insulating ‘sheath’ were calculated in FEMLAB. All of the microelectrodes in these simulations had a diameter of 10 μm. The lengths of the conducting portion of the conical, cylindrical, hemispherical, and insulated microelectrodes were all 5 μm. The potential as a function of distance from the tips of the electrodes are compared in Table 1 (a more extensive tabulation can be found as Table S-1 in supporting information). The potentials were similar for the disc, cylindrical, hemispherical, and insulated geometries but the potential profile for the conical geometry is significantly different.
Table 1.
A comparison of the potential in volts simulated for different microelectrode geometries at various distances from the tip of the microelectrodes. All of the microelectrodes simulated had a diameter of 10 μm and a length of 5 μm (excluding the disc geometry) with 1 volt applied to the microelectrode. In the `insulated' geometry, the cylinder has a 5 μm thick insulating layer that extends 1 mm down the microelectrode shaft.
| Distance from the Microelectrode Tip (μm) | Conical | Disc | Hemispherical | Cylindrical | Insulated |
|---|---|---|---|---|---|
| 1 | 0.6901 | 0.8755 | 0.8325 | 0.9036 | 0.8915 |
| 2 | 0.5809 | 0.7597 | 0.7141 | 0.8127 | 0.7895 |
| 5 | 0.4058 | 0.5029 | 0.4972 | 0.5988 | 0.5526 |
| 10 | 0.2725 | 0.2976 | 0.3330 | 0.4020 | 0.3439 |
| 25 | 0.1645 | 0.1269 | 0.1668 | 0.1999 | 0.1509 |
| 50 | 0.0752 | 0.0642 | 0.0912 | 0.1089 | 0.0765 |
The potentials 5 μm from the tip of the microelectrodes of various lengths, which were calculated in FEMLAB, are compared in Table 2. In the context of electroporation, the key factor is the total potential difference across the cell. Taking a typical cell to be 20−40 μm in diameter if the electrode-cell distance is 5 μm, the range of potential differences seen by a cell depends somewhat on the cell diameter, somewhat on the electrode length, and somewhat on the shape of the electrode. In no case, however, is the dependence a strong one. This bodes well for reproducibility of electroporation using microelectrodes independent of the hard-to-control tip shape.
Table 2.
Potential (V) 5 μm from the tips of the microelectrodes (at 1.0 V). The microelectrode lengths for the hemispherical and conical geometries are the total of a hemispherical and conical tip (both 5 μm) plus the length of the cylindrical shaft.
| Microelectrode Length (μm) | Conical | Hemispherical | Cylindrical | Insulated |
|---|---|---|---|---|
| 5 | 0.4058 | 0.4972 | 0.5988 | 0.5526 |
| 10 | 0.4742 | 0.5440 | 0.6260 | 0.5852 |
| 15 | 0.5027 | 0.5655 | 0.6417 | 0.6049 |
| 25 | 0.5334 | 0.5897 | 0.6606 | 0.6290 |
| 50 | 0.5686 | 0.6208 | 0.6841 | 0.6591 |
| 100 | 0.5981 | 0.6465 | 0.7049 | 0.6854 |
| 500 | 0.6518 | 0.6935 | 0.7438 | 0.7346 |
| 1,000 | 0.6709 | 0.7102 | 0.7577 | 0.7521 |
The cell constant
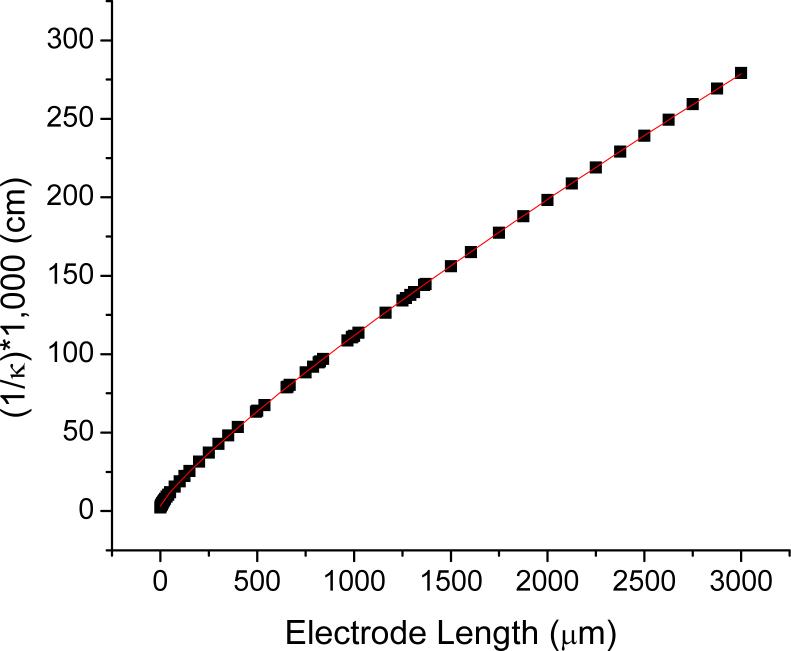
The calculated cell constant of an electrochemical cell is dependent on the size and shape of the electrodes. Numerous simulations using Laplace's equation and the geometry were done for commercially available, 5, 7, and 10 μm diameter fibers at various lengths. The general geometry and boundary conditions for these simulations can be seen in Fig 3. From the potential distribution, equations 2 and 3 were used to generate cell constants for each combination of electrode diameter and length. Values of 1000/κ fit well to a power law, Eq. 4, as seen in for 10 μm diameter electrodes in Figure 5. Coefficients for the three microelectrode diameters are in Table 3.
| (4) |
With these equations, a reasonably accurate cell constant for a cylindrical microelectrode of specific dimensions can easily be obtained without a computer simulation.
Figure 5.
A plot of the cell constant calculated from FEMLAB simulation versus the electrode length for 10 μm diameter microelectrodes. The squares indicate the values from the simulations and the line is from a fitted power law equation.
Table 3.
Coefficients for the fitted power law equation, 1000/κ = A*|x|p+y0, for the three common diameters of commercially available carbon fibers. The variable `x' is the length of the microelectrode in micrometers. The value for y0 was set to the value of (1/κ)*1,000 for a disc microelectrode of the given diameter. The units of 1000/κ are cm.
| Electrode Diameter | 5 μm | 7 μm | 10 μm |
|---|---|---|---|
| R2 | 0.99996 | 0.99996 | 0.99996 |
| A | 0.28441 ± 0.0038 | 0.30707 ± 0.00414 | 0.33151 ± 0.0028 |
| p | 0.8468 ± 0.00179 | 0.84314 ± 0.00178 | 0.83992 ± 0.00112 |
| y0 | 1.0163 | 1.43001 | 2.24273 |
Changes in the cell constant were also observed as a result of making more subtle changes in the shape of the microelectrode, such as roughness of the electrode surface, thickness of the electrode's insulating layer, and the roundness and sharpness of the microelectrode tip. Results of the calculations are shown in Table 4. The short microelectrode (10 μm) had the most significant changes in the cell constant. This was not a surprise because applying the same changes to the tip for each microelectrode causes the largest relative change in the 10 μm microelectrode's surface area. Tip geometry is insignificant for electrode lengths > 100 μm.
Table 4.
Common geometrical properties of microelectrodes and the effect they have on the cell constant. Cylindrical: cylinder truncated perpendicular to the symmetry axis. Conical tip: Distal 5 μm is conical. Hemispherical tip: Distal 5 μm is hemispherical. Rough sides: the microelectrode has a wave (± 0.285 μm) that repeats every 5 μm. Insulated: The electrode itself is the same as the one labeled `cylinder', but there is a 5 μm thick and 1 mm long insulating layer on the microelectrode compared to an infinite insulating layer for the other geometries.
| Microelectrode Length |  |
 |
 |
 |
Insulated |
|---|---|---|---|---|---|
| 5 μm | 265.78 cm−1 | 386.94 cm−1 | 308.31 cm−1 | 267.55 cm−1 | 221.18 cm−1 |
| 10 μm | 201.98 cm−1 | 244.76 cm−1 | 224.08 cm−1 | 202.40 cm−1 | 164.65 cm−1 |
| 15 μm | 166.58 cm−1 | 190.99 cm−1 | 179.69 cm−1 | 166.76 cm−1 | 135.02 cm−1 |
| 25 μm | 126.81 cm−1 | 138.62 cm−1 | 132.27 cm−1 | 126.82 cm−1 | 102.72 cm−1 |
| 50 μm | 83.49 cm−1 | 87.66 cm−1 | 85.46 cm−1 | 83.39 cm−1 | 68.33 cm−1 |
| 100 μm | 52.45 cm−1 | 53.84 cm−1 | 53.11 cm−1 | 52.36 cm−1 | 43.76 cm−1 |
| 500 μm | 15.66 cm−1 | 15.75 cm−1 | 15.71 cm−1 | 15.63 cm−1 | 13.86 cm−1 |
| 1,000 μm | 8.96 cm−1 | 8.98 cm−1 | 8.97 cm−1 | 8.94 cm−1 | 8.11 cm−1 |
Current interruption device
The accuracy of the current interruption device was tested with the use of a “dummy cell”, a simple model of an electrochemical cell constructed from two resistors and a capacitor. A resistor and capacitor connected in parallel emulates the electrode's impedance, while a resistor in series with the parallel RC element emulates the solution resistance. As mentioned earlier, interrupting the current to an electrochemical cell, a dummy cell in this case, will result in two distinct regions in the signal acquired by the oscilloscope. Several different dummy cells were constructed with resistors and capacitors similar in magnitude to those that would be present in an actual electrochemical cell with a working microelectrode. The actual resistances of the resistors used were determined with an ohmmeter. As a measure of the accuracy of the measurement, we determined the ratio of the average value of the measured resistance to the true value of the resistance. This ratio is 1.016 ± 0.047 (standard deviation, n = 16) over the range of 4.75 kΩ to 1.02 MΩ (Table S-2 in Supplemental Information). The accuracy of these values shows that the current interruption device is capable of measuring iR drops of the expected magnitude in the presence the impedance expected from the interface.
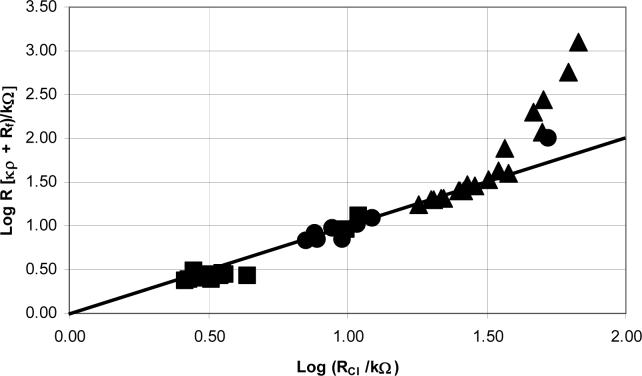
To alter the solution resistance experimentally microelectrodes of various lengths were used in current interruption experiments done in solutions of different conductivities. The lengths of the microelectrodes were determined with the use of the microscope, camera, and computer software. Solution conductivities were determined using a conductivity meter. These experimental resistances were then compared to the predicted resistance. The predicted resistance is the sum of two resistances: one is the product of a cell constant and the solution conductivity, the other is Rf (1.9 kΩ). The agreement of these two values, ‘predicted’ and ‘experimental’ depends on the conductivity of the solution and microelectrode length, Fig. 6. For the 10 and 100 mM KCl, the agreement for all lengths of microelectrodes tested was acceptable. Agreement was acceptable in the Iso solution for microelectrodes longer than 150 μm. Agreement is good in the range of about 2 to 50 kΩ. The ‘good’ range includes data from each of the three electrolyte solutions.
Figure 6.
A log plot of κρ + Rf vs. the resistance values from current interruption experiments. The diagonal line on the graph represents perfect correlation with a slope of 1. The approximate conductivities of the solutions used in the current interruption experiments: ● 100 mM KCl (13,000 μS/cm), ■ 10 mM KCl (1,500 μS/cm), ▲ and Iso (400 μS/cm).
Though the agreement is good in a wide range of experimentally useful conditions, we had anticipated better agreement. Several potential confounding effects were investigated. Is Ohm's Law being obeyed in the current interruption experiments? According to Ohm's Law an increase or decrease in the applied current should linearly affect the drop in voltage when the resistance is kept constant. Current interruption experiments were performed at various applied currents on several microelectrodes of various lengths in the same solution (data not shown). The positive linear correlation with zero intercept between the applied current and instantaneous voltage drop shows that Ohm's Law is being obeyed in the current interruption experiments.
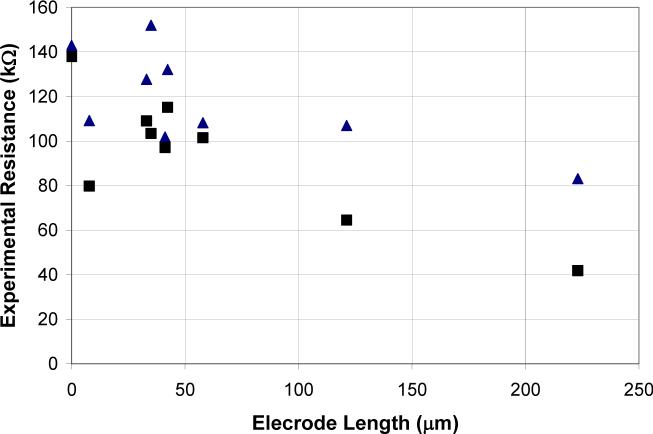
Could this lack of agreement with theory be due to the difference in the average current density at the microelectrode? First, current interruption experiments were performed on microelectrodes of various lengths in Iso buffer with an applied current of 1 μA. Then, current interruption experiments were performed on microelectrodes in the same solution, but the applied currents were adjusted so that the average current densities for the different microelectrodes were approximately the same. This was done by applying 1 μA of current to the longest microelectrode and linearly decreasing the applied current as a function of the microelectrode's surface area. The resistance values for the adjusted applied current were similar to those for the applied current of 1 μA, Fig. 7. The average current density experiments were also carried out in 100 mM KCl solutions with similar results.
Figure 7.
A plot of current interruption experiments performed on microelectrodes of various lengths in Iso solution. In the ‘Adjusted current’ measurements, all of the microelectrodes had the same average current density: ▲ 1 μA and ■ ‘Adjusted current’.
Is the lack of agreement of the experimental resistance values from the theoretical ones due to electrode polarization? Initially, no reversible depolarizer was added to any of the solutions (10 mM KCl, 100 mM KCl, and Iso). In order to insure that polarization was not influencing the results, quinhydrone was added to the Iso solution. The concentration of quinhydrone (5 mM) was sufficient to insure that the diffusion limited current was greater than the current applied in the current interruption experiment. The solution resistance values of the experiments with quinhydrone added are within 10% of the initial experiments without any quinhydrone. This allowed us to determined that polarization is not the problem.
Could changes in conductivity be the cause for this lack of agreement with theory? The conductivity of the solutions were taken before and after current interruption experiments with no significant, less than 1%, change in its value for all three solutions. The lack of a global change in conductivity of a solution does not ensure that the local conductivity of a solution around the microelectrode does not change. This is especially true for the Iso solution that contains organic molecules, ∼ 225 mM inositol, that could be oxidized into conductive ions. We determined that, in fact, electrolysis of Iso solution does increase its conductance. In a cell with two glassy carbon plate electrodes ∼ 3 cm by 1 cm by 0.25 cm, and using a similar current density to that of the carbon fiber microelectrode's in 50 mL of the Iso solution in a thermostated cell (23° C) for 6 hours resulted in an 18% increase in the solution conductivity. We further carried out a ‘back of the envelope’ calculation to tell us what the concentration of electrolyte created by this electrolysis might be near a microelectrode. The dimensionless time in the equation for current at a cylinder, τ = 4Dt/a2 (D is diffusion coefficient, t is time, a is cylinder radius) for a typical 200 ms pulse used in electroporation is 30, and for the current interruption experiment is much larger. Thus, we are in the ‘quasi-steady state’ regime. We use the equation for diffusion controlled current density, with a diffusion coefficient of 1 × 10⁻⁹ m2s−1, we take n = 1, to arrive at what the concentration at the electrode of the species must be. With a current density of about 70 A/m2 (1 μA at a 10 μm diameter, 500 μm long cylinder) we get a surface concentration of about 400 mM. This is clearly sufficient to lead to a resistance much lower than anticipated from the bulk conductance of the Iso solution and the cell constants (the right side of Fig. 6).
Could a local change in the pH or temperature around the microelectrode be the cause for the lack of agreement between the experimental and theoretical solution resistance values? A drastic change in pH could indicate the electrolysis of water, which would increase the local conductivity of the solution. We verified that there was not a significant change in the pH around the microelectrode with the pH indicator, methyl orange, in the Iso solution. This was done by running current interruption experiments, in which the current was applied 10 times longer than normal, under a microscope with 200 times magnification. No noticeable color change in the pH indicator was observed under these conditions. As the temperature of a solution increases, the conductivity of a solution also increases. The global temperature change of a solution is prevented by thermostating the electrochemical set-up. Computer simulations were performed to see if a local temperature change around the microelectrode is predicted. When an average current density similar to those in the current interruption experiments was applied to the microelectrode in the simulation, there was no (< 0.004 °C) predicted temperature increase in the solution around the microelectrode for the Iso solution. When an average current density of 10 times greater than that in the current interruption experiments was applied to the microelectrode a temperature change of < 0.04 °C was predicted, 100 times gave a predicted temperature change of < 3.7 °C.
Could the lack of agreement between the experimental and theoretical solution resistance values be a result of a thin semi-insulating layer on the surface on the microelectrode? It would explain the disagreement on the low-resistance end with the high conductance solution. This is not unreasonable. Graphite oxide can be formed on carbon surfaces26. Graphite oxide is nonconductive, but the layer it forms on an electrode surface is porous. Thus it acts as a resistive coating. The presence of such an additional resistance, if it discharged rapidly in the current interruption experiment, would add to the solution resistance, however the disagreement is in the opposite direction
The model used in the computer simulations does not account for any secondary electrochemical effects, such as changing ion concentrations at the electrodes. We conclude that the failure to measure large solution resistances is likely due to the creation of ions near the electrode, decreasing the measured resistance.
Application to electroporation under current control
In practice, to apply the results to electroporation requires 4 simple steps. Numerical calculations and current interruption are not required. All of the information except the actual conductivity of the solution being used in one's laboratory is provided here or in the Supplemental Information.
We first determine approximately how much voltage will be expressed from the proximal to the distal point of a cell. This will correspond approximately to the voltage drop in solution corresponding to the same distance. If an insulated 500 μm cylinder electrode is placed 5 μm from a cell, calculations (Table 2) indicate that 30 − 40% of the voltage drop in solution occurs in the range from 5 μm to 25 or 45 μm from the electrode tip. This range corresponds to typical cell diameters (20 − 40 μm). To achieve a transmembrane potential of 0.25 V27-29, we then must create an iR drop in solution of about 0.82 V (20 μm cell) to 0.64 V (40 μm cell). The second step is calculating the cell constant for the diameter and length of the microelectrode. For a 10 μm diameter microelectrode 500 μm long the cell constant calculated from the equation in Table 3 is 15.3 cm−1. The third step is calculating the solution resistance. One just divides the calculated cell constant (units of cm−1) by the solution conductivity (units of μmhos/cm) to get the solution resistance in Mohms. If the Iso buffer (390 μmhos/cm) is used the solution resistance will be about 40 kΩ. Finally the applied current needed is calculated. This is done by dividing the voltage drop needed in solution (0.82V and 0.64V) by the solution resistance (40 kΩ). Thus, approximately 21 μA (20 μm cell) to 16 μA (40 μm cell) will be needed to achieve electroporation.
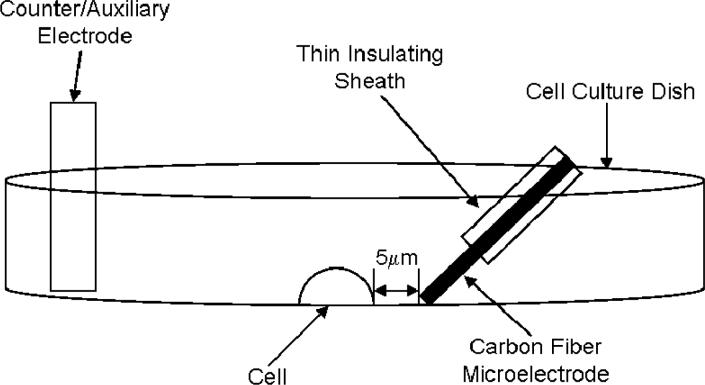
Three electrodes corresponding to the ‘good’ region of resistance with Iso were chosen to determine the current needed to electroporate adherent A549 cells in Iso. In all experiments, the distance between the cell and the electrode was 5 μm. The arrangement of the electrode vs the cell can be seen in Figure 11. Individual stained (thioglo-1 for 2 electrodes and calcein AM for one) cells were exposed to 200 ms pulses of a particular current while the cell was observed with fluorescence microscopy. Electroporation was judged to have occurred if the fluorescence signal from the cell dropped more than 5% following the current pulse (noise in the fluorescence signal ∼ 2%). For electrodes of 420, 660 and 860 μm length, we observe that the minimum currents to achieve electroporation are, respectively, < 20, 20 and 30 μA. Thus, the simple algorithm for finding electroporation conditions suggested here seems to be effective.
Figure 8.
The experimental setup for the electroporation experiments, not to scale.
ACKNOWLEDGEMENTS
We would like to thank the NIH (R01 GM066018), The Foundation for Strategic Research (SSF), Vetenskapsrådet (VR) and the Göran Gustafsson Foundation for financial support. We thank Reviewer III for pointing out that carbon fibers can have a significant resistance.
Footnotes
Supplementary Material Available: Table S-1 of potential vs. distance along the z-axis for several electrode shapes and lengths, Table S-2 data for dummy cells are available as Supporting Information.
Current ordering information is found on any masthead page.
References
- 1.You TY, Yang XR, Wang EK. Electroanalysis. 1999;11:459–464. [Google Scholar]
- 2.Cahill PS, Walker QD, Finnegan JM, Mickelson GE, Travis ER, Wightman RM. Analytical Chemistry. 1996;68:3180–3186. doi: 10.1021/ac960347d. [DOI] [PubMed] [Google Scholar]
- 3.Li JL, Pons S, Fleischmann M. Journal of Electroanalytical Chemistry and Interfacial Electrochemistry. 1991;316:255–261. doi: 10.1016/0302-4598(87)85005-5. [DOI] [PMC free article] [PubMed] [Google Scholar]
- 4.Golasz J, Drickamer HG, Faulkner LR. Journal of Physical Chemistry. 1991;95:10191–10197. [Google Scholar]
- 5.John R, Wallace GG. Journal of Electroanalytical Chemistry and Interfacial Electrochemistry. 1990;283:87–98. doi: 10.1016/0302-4598(87)85005-5. [DOI] [PMC free article] [PubMed] [Google Scholar]
- 6.Robinson RS, McCreery RL. Analytical Chemistry. 1981;53:997–1001. [Google Scholar]
- 7.Ryttsen F, Farre C, Brennan C, Weber SG, Nolkrantz K, Jardemark K, Chiu DT, Orwar O. Biophysical Journal. 2000;79:1993–2001. doi: 10.1016/S0006-3495(00)76447-2. [DOI] [PMC free article] [PubMed] [Google Scholar]
- 8.Lin X, Guo Z. Analytical Sciences. 2004;20:1645–1647. doi: 10.2116/analsci.20.1645. [DOI] [PubMed] [Google Scholar]
- 9.Amatore C, Bouret Y, Maisonhaute E, Abruna HD, Goldsmith JI. Comptes Rendus Chimie. 2003;6:99–115. [Google Scholar]
- 10.Amatore C, Maisonhaute E, Simonneau G. Journal of Electroanalytical Chemistry. 2000;486:141–155. [Google Scholar]
- 11.Garreau D, Hapiot P, Saveant JM. Journal of Electroanalytical Chemistry and Interfacial Electrochemistry. 1990;281:73–83. [Google Scholar]
- 12.Wightman RM, Wipf DO. Accounts of Chemical Research. 1990;23:64–70. [Google Scholar]
- 13.Teissie J, Eynard N, Gabriel B, Rols MP. Advanced Drug Delivery Reviews. 1999;35:3–19. doi: 10.1016/s0169-409x(98)00060-x. [DOI] [PubMed] [Google Scholar]
- 14.Weaver JC, Chizmadzhev YA. Bioelectrochemistry and Bioenergetics. 1996;41:135–160. [Google Scholar]
- 15.Tsong TY. Biophysical journal. 1991;60:297–306. doi: 10.1016/S0006-3495(91)82054-9. [DOI] [PMC free article] [PubMed] [Google Scholar]
- 16.Olofsson J, Levin M, Stroemberg A, Weber SG, Ryttsen F, Orwar O. Analytical Chemistry. 2005;77:4667–4672. doi: 10.1021/ac0502302. [DOI] [PMC free article] [PubMed] [Google Scholar]
- 17.Bruckenstein S. Analytical Chemistry. 1987;59:2098–2101. [Google Scholar]
- 18.Wruck WJ, Machado RM, Chapman TW. Journal of the Electrochemical Society. 1987;134:539–546. [Google Scholar]
- 19.Kuhn M, Schuetze G, Kreysa G, Heitz E. DECHEMA Monographien. 1986;101:265–278. [Google Scholar]
- 20.Britz D, Brocke WA. Journal of Electroanalytical Chemistry and Interfacial Electrochemistry. 1975;58:301–311. doi: 10.1016/0302-4598(87)85005-5. [DOI] [PMC free article] [PubMed] [Google Scholar]
- 21.Grahame DC. Journal of Physical Chemistry. 1953;57:257–261. [Google Scholar]
- 22.Lambie Bradley A, Orwar O, Weber Stephen G. Analytical chemistry. 2006;78:5165–5171. doi: 10.1021/ac051372z. [DOI] [PMC free article] [PubMed] [Google Scholar]
- 23.Fabisiak JP, Sedlov A, Kagan VE. Antioxidants & Redox Signaling. 2002;4:855–865. doi: 10.1089/152308602760599016. [DOI] [PubMed] [Google Scholar]
- 24.Kagan VE, Kuzmenko AI, Tyurina YY, Shvedova AA, Matsura T, Yalowich JC. Cancer Research. 2001;61:7777–7784. [PubMed] [Google Scholar]
- 25.Aoki K, Honda K, Tokuda K, Matsuda H. Journal of Electroanalytical Chemistry and Interfacial Electrochemistry. 1985;186:79–86. [Google Scholar]
- 26.Kepley LJ, Bard AJ. Analytical Chemistry. 1988;60:1459–1467. [Google Scholar]
- 27.Rols MP, Teissie J. Biophysical journal. 1998;75:1415–1423. doi: 10.1016/S0006-3495(98)74060-3. [DOI] [PMC free article] [PubMed] [Google Scholar]
- 28.Puc M, Kotnik T, Mir Lluis M, Miklavcic D. Bioelectrochemistry (Amsterdam, Netherlands) 2003;60:1–10. doi: 10.1016/s1567-5394(03)00021-5. [DOI] [PubMed] [Google Scholar]
- 29.Neumann E, Kakorin S, Toensing K. Bioelectrochemistry and bioenergetics (Lausanne, Switzerland) 1999;48:3–16. doi: 10.1016/s0302-4598(99)00008-2. [DOI] [PubMed] [Google Scholar]


