

Abstract
Imaging mass spectrometry (IMS) of neuropeptides in crustacean neuronal tissues was performed on a MALDI-TOF/TOF instrument. Sample preparation protocols were developed for the sensitive detection of these highly complex endogenous signaling molecules. The neuromodulatory complements of the pericardial organ (PO) and brain of the Jonah crab, Cancer borealis, were mapped. Distributions of peptide isoforms belonging to more than ten neuropeptide families were investigated using the IMS technique. Often neuropeptides of high sequence homology were similarly located. However, two RFamide-family peptides and a truncated orcokinin peptide were mapped to locations distinct from other members of their respective families. Over 30 previously sequenced neuropeptides were identified based on mass measurement. For increased confidence of identification, select peptides were fragmented by post-source decay (PSD) and collisional-induced dissociation (CID). Collectively, this organ-level IMS study elucidates the spatial relationships between multiple neuropeptide isoforms of the same family as well as the relative distributions of neuropeptide families.
Keywords: Imaging mass spectrometry, Neuropeptide, Cancer borealis, MALDI-TOF/TOF, RFamide, RYamide, orcokinin
Introduction
Imaging mass spectrometry (IMS) reveals the planar spatial distribution of analytes. Mass spectra are acquired according to a predefined Cartesian grid. This array of mass spectra is then processed into a cohesive image where each pixel contains the data from the corresponding spectrum. This technique simultaneously generates numerous ion density maps with high molecular specificity.
Imaging may be performed using matrix-assisted laser desorption/ionization (MALDI) or secondary ion mass spectrometry (SIMS) depending on the necessary spatial resolution and the analyte. SIMS imaging produces analyte intensity maps with submicron spatial resolution,1 but SIMS does not readily create intact ions of macromolecules. Although modifications such as matrix-enhanced SIMS,2 metal-assisted SIMS,3 and the use of polyatomic primary ion beams4 increase the sensitivity of SIMS for molecules such as cholesterol, small peptides, polymers, and lipids, MALDI-MS is more adept at the detection of higher mass compounds. MALDI-MS images typically have 50−300 μm spatial resolution.5 Stigmatic MALDI imaging, which retains the planar arrangement of generated ions and records them as a two-dimensional array, enables the discrimination of features as small as 4 μm.6 MALDI-IMS has been used for mapping cholesterol and phospholipids,7, 8 but this technique is particularly recognized for the localization of proteins6, 9-12 or pharmaceuticals13-15 in tissue. More recently, the use of IMS to map the distribution of neuropeptides has gained increased attention.16, 17
The application of mass spectrometry to the field of neuroscience has enabled the discovery and characterization of many neuropeptides and neurohormones. Preparation of neuronal tissues for mass spectral analysis is often achieved by homogenizing the sample in the presence of an extraction buffer followed by differential centrifugation. The neuropeptide-rich supernatants are commonly fractionated prior to tandem MS analysis.18-20
Alternatively, direct tissue methods, in which the tissue is coated with matrix and probed via MALDI analysis, enable the sensitive detection of neuropeptides in single organs21, 22 and even single cells.23-27 Because direct tissue analysis does not necessitate disruption of tissue morphology, this technique can be extended for MALDI-IMS of neuropeptides. IMS offers higher spatial resolution than organ profiling without the necessity for difficult dissections such as are required for single cell analysis.
Immunocytochemistry is another technique which is commonly used to determine the distribution of neuropeptides,28-30 but IMS offers several advantages over such antibody-based methods. First, IMS provides higher throughput. In contrast to the multiple days required to perform antibody-staining, IMS data acquisition often requires a few hours or less. Furthermore, the inherent nature of mass spectrometry to detect with high chemical specificity enables the simultaneous differential localization of numerous peptides even when significant sequence homology exists. A priori knowledge of the peptide structure is not required, and MS/MS may be performed for unambiguous identification or de novo sequencing. Therefore, IMS has the potential not only to reveal complex colocalization patterns, but also to discover novel neuropeptides. Additionally, IMS gives semi-quantitative information about neuropeptide expression in a tissue section. Compared to MALDI profiling, imaging generates an ion density map from a more uniformly prepared tissue section. Thus, IMS offers a more accurate assessment of neuropeptide abundance at specific locations throughout the tissue.
IMS of neuropeptides presents some challenges due to the low abundance and likelihood of diffusion of the relatively small hydrophilic molecules. However, due to the great potential of this technology to offer insight into nervous system function, IMS has been applied to map neuropeptides in both vertebrate and invertebrate species. Specifically, the distribution of vasopressin (m/z 1084.4) in rat brain has been mapped using surface metallization in conjunction with stigmatic MALDI imaging and MALDI-Fourier transform ion cyclotron resonance imaging.31, 32 Stigmatic MALDI imaging has also been used to map multiple neuropeptides in pituitary tissue with spatial resolution comparable to the length of a cell.17 The capability of matrix enhanced SIMS to localize the small neuropeptide APGWamide (m/z 429.2) in the cerebral ganglia of the freshwater snail with micrometer spatial resolution has been demonstrated.2 Furthermore, MALDI imaging utilizing an ablation technique which allows resolution of images smaller than the size of the laser beam has been used to localize acidic peptide (m/z 2961) in a sea slug neuron.33 Recently, tandem MS was coupled to neuropeptide imaging in the house cricket.16
Herein we present organ-level mapping of a multitude of neuropeptides in a decapod crustacean by IMS. An effective sample preparation protocol was developed to enable simultaneous imaging of a wide array of neuropeptides directly from nervous tissue using a MALDI TOF/TOF instrument. Over thirty distinct neuropeptides from ten peptide superfamilies were localized in the brain and a neurosecretory organ isolated from the Jonah crab, Cancer borealis. Furthermore, confident identification of select peptides by collisional-induced dissociation (CID) fragmentation was demonstrated. The application of the powerful IMS technology to localize neuropeptides in a well-characterized model nervous system enabled a detailed investigation of colocalization patterns and differential distributions of peptide isoforms.
Experimental Section
Animals
Cancer borealis (Jonah crabs) were maintained without food in an artificial seawater tank at 10−12°C. Details of the animal treatment and dissection were described in Kutz, et al.21 For the purposes of this study, the crabs were cold-anesthetized and the brain and pericardial organs were dissected out in chilled physiological saline (composition in mM: NaCl, 440; KCl, 11; MgCl2, 26; CaCl2, 13; Trizma base, 11; maleic acid, 5; pH 7.45).
MALDI matrix comparison
The matrices 2,5-dihydroxybenzoic acid (DHB, 150 mg/mL in 50/50 methanol/0.1% aqueous formic acid, v/v) and α-cyano-4-hydroxycinnamic acid (CHCA, saturated solution in 50/50 acetonitrile/0.1% aqueous formic acid, v/v) were freshly prepared. Small portions of the trunk region of the pericardial organ (PO) were chosen at random, rinsed in doubly distilled water, placed on the MALDI plate, and coated with either DHB or CHCA by dropping 0.4 μL of matrix on top of the tissue. For each piece of PO, the MALDI-TOF/TOF acquisition software was set to acquire and average together spectra of 250 shots each over the mass range m/z 800−2000 from five random locations on the tissue. Once the optimum laser attenuation had been determined for each of the two matrices, spectra were acquired for ten pieces of PO with five spotted in DHB and five spotted in CHCA, respectively.
Sample preparation
Immediately following dissection, the brain was embedded in gelatin (100 mg/mL aqueous) and snap-frozen. Sectioning into 12 μm slices at −25°C was performed on a cryostat (Microtom HM505E, Waldorf, Germany) and the slices were thaw-mounted onto a MALDI plate that had been coated with a thin layer of DHB. The pericardial organ was dissected free of the animal and arranged to lay flat on an uncoated MALDI plate in a small pool of water which was subsequently removed. All plated tissues were dehydrated in a dessicator for at least 1 hour prior to matrix application. For imaging experiments, an airbrush was used to spray coat the tissues with DHB. The airbrush was held perpendicular to the MALDI plate at a distance of 35 cm and the flow rate of matrix was adjusted so that most of the matrix solvent evaporated before reaching the plate. Five coats of matrix were applied by spraying each sample for 30 seconds with one minute dry time between each application.
For the brain profiling experiments, the brain was embedded and sectioned as described above and thaw-mounted onto an uncoated MALDI plate. Five 50 nL droplets of DHB were spotted at discrete locations on two slices. These slices were then analyzed using the same acquisition and processing parameters as the airbrush-coated brain slice.
For tandem MS analysis, the tissues were prepared as though they were to be imaged except DHB was applied in small droplets (50 nL droplets on the brain slice; 0.4 μL droplets on the PO) instead of using the airbrush matrix application technique.
Data Acquisition and Processing
A model 4800 MALDI TOF/TOF analyzer (Applied Biosystems, Framingham, MA, USA) equipped with a 200 Hz, 355 nm Nd:YAG laser (spot diameter of ∼75 μm) was used for all mass spectral analyses. Acquisitions were performed in positive ion reflectron mode. Instrument parameters were set using the 4000 Series Explorer Software (Applied Biosystems). The tissue region to be imaged and the raster step size were controlled using the 4800 Imaging application (Novartis, Basel, Switzerland) available through the MALDI MSI website (www.maldi-msi.org). To generate images, spectra were collected at 100 μm intervals in both the x and y dimensions across the surface of the sample. Each mass spectrum was generated by averaging 250 laser shots over the mass range m/z 800−2000. Individual spectra were acquired using 1.0 ns binning to yield 27,812 data points per spectrum. Mass spectra were externally calibrated using peptide standards applied directly to the stainless steel MALDI target. Image files were processed and extracted ion images were created using the BioMap software package (www.maldi-msi.org, Novartis, Basel, Switzerland). BioMap enables the creation of MS-images by reconstituting the x and y coordinates of the spectra in the acquired image file with their original locations on the tissue. Images can be extracted over a m/z window and assigned an intensity-based color scale. Tandem mass spectra (MS/MS) were obtained using precursor ion selection windows between 1 Da and 15 Da depending on the necessary selectivity, and ion activation was achieved using 1 kV collision-induced dissociation (CID) with air as the collision gas. One thousand laser shots were averaged for each MS/MS spectrum and sequence interpretation was performed manually.
Results and Discussion
MALDI-IMS experiments were performed on organs with neuromodulatory influence on the crustacean stomatogastric nervous system (STNS). Specifically, sample preparation protocols were developed and implemented for imaging the pericardial organs (POs) and brain of Cancer borealis. The STNS consists of several linked, motor-pattern-generating networks that produce coordinated motor output. Numerous anatomical, electrophysiological, immunocytochemical, and mass spectral studies have been performed on components of this system.34-39 Therefore, the STNS is an excellent test-bed for IMS method development as well as a useful model nervous system from which general neurobiological concepts may be derived.
Figure 1 shows the gross anatomy of C. borealis. Note that the paired POs are found in the pericardial chamber which surrounds the heart, and the brain is located dorsal to the major components of the STNS. The POs are known to secrete neurohormones, which have modulatory effects on the STNS, into the hemolymph. The brain, which is connected to the STNS via projection neurons,40 also contains and releases neuromodulators which are known to elicit effects on the central pattern generating system of the crab.
Figure 1. Location and morphology of brain and pericardial organs in Cancer borealis.
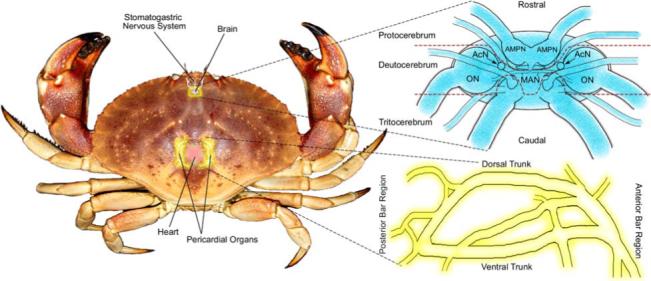
The brain lies dorsal to the main artery running forward from the heart to the stomach/oesophagus. Portions of the stomatogastric nervous system (STNS) reside within this artery, and the rest of the STNS extends outward and ventrally. The brain can be divided into three sections: the protocerebrum which includes the anterior medial protocerebral neuropil (AMPN); the deutocerebrum which contains the olfactory lobe (ON), the median antenna I neuropil (MAN), and the accessory lobe (ACN); and the tritocerebrum.54 The pericardial organs (POs) lie within the cardial chamber surrounding the heart. It has both a dorsal and ventral trunk as well as posterior and anterior bar regions.47 Both organs have been oriented in such a way to most closely correspond to the MS-images shown.
Tissue Preparation
Careful sample preparation is crucial for obtaining biologically relevant mass spectral images. Variables including embedding medium, tissue slice thickness, fixing reagents and matrix factors such as type, solvent, and application method determine the final quality of the acquired image.
Optimal cutting temperature (OCT) media produces severely interfering signals by MALDI in the mass range of most neuropeptides. Therefore, the alternatives of mounting the brain with a small amount of OCT on the cryostat stage or embedding the brain in gelatin were investigated. Without embedding, the small and delicately structured brain did not retain its morphology during the freezing process and was difficult to mount without OCT contamination. The alternative option of embedding the brain in gelatin provided stability during thin sectioning and did not produce significant interference in the m/z range 800−2000 when the brain slice was imaged. The high spectral quality that can be achieved using this embedding media is demonstrated in Figure 2b which shows two spectra from a brain slice in which most peaks are attributable to known neuropeptides. Due to the high salt and lipid content of the crab brain, thin sectioning was performed at a temperature (−25°C) which is slightly colder than is commonly reported for cryostat sectioning of many tissues.
Figure 2. Neuropeptide localization in Cancer borealis brain.

(a) MALDI-MS images of select peptides demonstrating colocalization of members of the same neuropeptide family as well as exceptions to this trend. The phosphatidylcholine [M+Na]+ image is shown in the lower right panel for comparison. (b) Mass spectral profiles extracted from two discrete regions of the brain image.
The MALDI matrices CHCA and DHB were compared for sensitivity and robustness for direct analysis of neuropeptides from C. borealis PO. Ten pieces of the trunk portion of the PO were placed on the MALDI plate and covered with a small droplet of either DHB or CHCA. Five locations were randomly sampled throughout each piece of tissue and the resulting spectra were combined. The signal-to-noise ratio (S/N) of the prominent neuropeptide peak at m/z 1030.5 was used as a measurement of spectral quality. The average S/N of m/z 1030.5 in the spectra from the DHB coated tissue was 20.6 with a standard deviation of 9.4, and for the CHCA coated tissue the average S/N was 5.4 with a standard deviation of 3.6. These direct tissue experiments indicated that DHB was more appropriate for this study. Furthermore, DHB exhibited reduced ablation compared to CHCA thus allowing for subsequent re-analysis of the samples. Although, airbrushed DHB formed larger crystals than CHCA, the crystals were significantly smaller than the 100 μm raster step size and therefore should not have impacted spatial resolution.
A rudimentary investigation of the relationship between tissue thickness and signal intensity was performed by mounting brain slices of 20 μm, 12 μm, 8 μm, and 4 μm thickness on the MALDI plate and spray coating these slices with DHB. Random sampling throughout the slices resulted in the deduction of a general trend of increased signal intensity with decreased thickness. However, the increased delicacy of slices thinner than 12 μm often resulted in tears or holes in these tissue sections. Therefore, 12 μm slices were determined to be optimal for obtaining sufficient signal sensitivity while maintaining tissue integrity. This result is consistent with a previously published report by Schwartz et al41 which reported that slices with thickness in the 10−20 μm range are appropriate for imaging applications.
In MALDI imaging, diffusion of the analytes can limit the achievable spatial resolution. This concern is magnified when attempting to localize smaller, hydrophilic, more mobile molecules such as neuropeptides. Reports on mass spectral imaging of proteins have used ethanol fixation to decrease non-specific protein degradation and dehydrate tissues thus decreasing diffusion. However, previous investigation of various fixing techniques for preparation of invertebrate neuronal tissues showed that ethanol fixation can complicate the correlation of molecular images with structural features.42 This may be due in part to neurons rupturing during the fixing process and neuropeptides being solubilized in the ethanol. Furthermore, rinsing tissue with ethanol prior to matrix application has been shown to improve mass spectral data when using CHCA as the matrix, but no significant improvement was observed for ethanol rinsing in conjunction with DHB.41 Therefore, the tissue was not ethanol fixed prior to matrix application. Instead, to reduce lateral diffusion of the analyte, the samples were dehydrated in a dessicator and the matrix was carefully applied by airbrush.
The flow rate and distance between the sample and airbrush were adjusted to encourage sufficient extraction of the analyte to the tissue surface while limiting lateral diffusion. Dissolving the matrix in a mixture of equal parts water and methanol instead of pure methanol led to stronger peptide signals probably due to more efficient mixing of the analyte with the matrix. In our hands, it was necessary to sandwich the brain slices between two layers of airbrushed matrix instead of only coating the top of the sample in order to achieve sufficient neuropeptide signal for robust detection. In this manner, diffusion was limited and significant neuropeptide signals were observed with differential intensities throughout the imaged tissues.
To confirm that the neuropeptide maps were not influenced by potential diffusion induced during matrix application, two brain slices of 12 μm thickness were each microspotted with 50 nL droplets of DHB at five discrete locations. These brain slices were then imaged and processed in a manner similar to the airbrushed brain slices. Although this microspotted matrix application method only offers limited spatial resolution, the results of this profiling experiment correlated very well with those determined through the more detailed imaging experiment. In contrast, when a droplet of matrix encompassing the entire brain slice was applied, extensive analyte diffusion was observed.
The brain MS images did not show any significant neuropeptide signal outside of the tissue region. However, it was evident in the pericardial organ images that neuropeptide signals were obtained from a location not on the organ. This arch-shaped area near the anterior bar (evident in Figure 3) exhibited a peptide profile very similar to the profile of the anterior bar region. It is likely that this portion of the MALDI plate came into contact with the anterior bar region of the PO when the organ was being arranged to lay flat on the plate in preparation for imaging analysis. Fortunately, this is not a concern for the brain tissue because it was mounted on the plate without further adjustment.
Figure 3. Differential localization of neuropeptide families in the pericardial organs (PO).
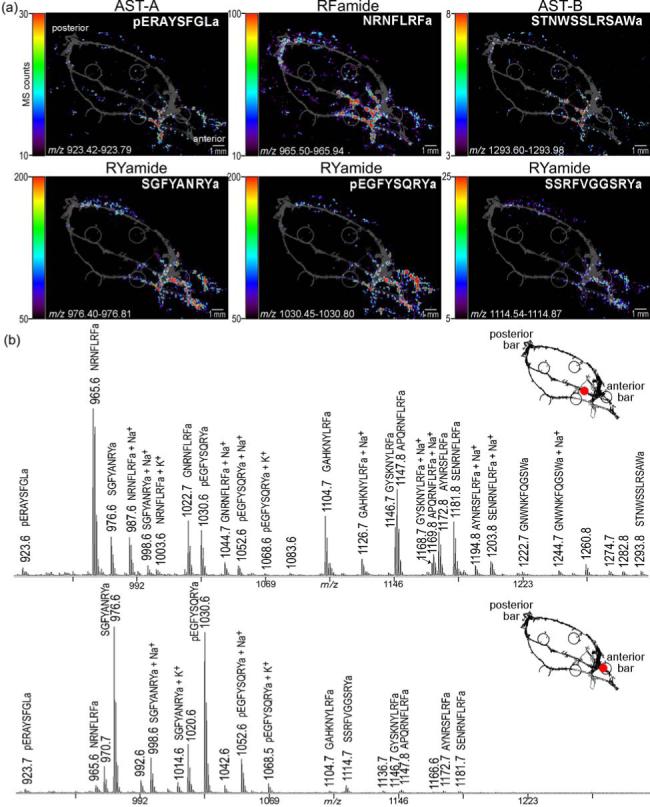
(a) MS images, colored according to associated color-intensity scale, are shown as an overlay on top of an optical image of the PO. Members of different neuropeptide families are differentially located. The most apparent contrast is observed between the RYamide family and the RFamide family. (b) Mass spectral profiles extracted from two discrete regions of the PO image.
MALDI-IMS data acquisition
For MALDI-IMS experiments, spectra were acquired at 100 μm steps throughout the XY plane of the sample. Each spectrum is the result of averaging 250 laser shots and typically contained about 100 distinct mass signals in the range m/z 800−2000. Images were acquired at a rate of approximately 1.5 seconds per spectrum. The IMS files were processed using BioMap which displays the ion intensity within a user defined mass window according to a color-coded scale for each coordinate. The thickness of the tissue was detrimental to the mass measurement accuracy and resolution; therefore, the bins defined to create the MS images are approximately 0.5 Da. Due to constraints of computational capacity, the PO data was acquired in two sequential experiments to reduce the data file to an appropriate size. The processed MS images were then spliced together for visualization. The entire area imaged for the PO was 14.8 mm by 17.6 mm. 26,048 points were acquired over 11 hours resulting in two files each of 703 Mb to produce the image of the entire PO. The brain slice image dimensions were 3.9 mm by 3.3 mm and 1287 points were acquired in less than one hour to produce a 76.9 Mb image file.
Neuropeptide localization
Previous immunocytochemical28-30, 43, 44 and mass spectral37, 39, 45, 46 studies have shown that a rich repertoire of neuromodulators exist in the POs and brain of decapod crustaceans. These neurohormones are commonly divided into families based on sequence homology. Often multiple members of the same peptide family are encoded by the same precursor protein.27 However, cellular colocalization of peptides derived from distinct precursor proteins in multiple differentially modified forms has also been reported.25 Our IMS study allowed the identification of 21 peptides from 6 different families in the PO and 17 peptides from 5 families in the brain (Table 1). When detected, the sodium and potassium adducted peptide signals showed spatial distribution identical to the corresponding [M+H]+ peak. Neuropeptide localization was found to be highly correlated with peptide family in both the brain (Figure 2) and in the PO (Figure 4). However, exceptions to this observed trend of familial colocalization were apparent in the brain data (Figure 2). This finding highlights the advantage of IMS over immunocytochemistry for the molecularly-specific detection of isoforms of the same peptide family. The differential localization of isoforms of a peptide family may be the result of tissue-specific processing of neuropeptide precursors and may imply discrete functions despite sequence similarity.
Table 1.
Peptides identified from the MALDI-IMS analysis of C. borealis pericardial organ and brain
|
Pericardial Organ |
Brain |
||
|---|---|---|---|
| Sequence | m/z | Sequence | m/z |
| RFamides | RFamides | ||
| NRNFLRFa | 965.5 | NRNFLRFa | 965.5 |
| GNRNFLRFa | 1022.6 | GNRNFLRFa | 1022.6 |
| SDRNFLRFa | 1053.6 | GAHKNYLRFa | 1104.6 |
| GAHKNYLRFa | 1104.6 | SMPSLRLRFa* | 1105.6 |
| GYSKNYLRFa | 1146.6 | GYSKNYLRFa | 1146.6 |
| AYNRSFLRFa | 1172.6 | APQRNFLRFa | 1147.6 |
| SENRNFLRFa | 1181.6 | AYNRSFLRFa | 1172.6 |
| SENRNFLRFa | 1181.6 | ||
| A-type allatostatins | DVRTPALRLRFa* | 1342.8 | |
| pERAYSFGLa | 923.5 | ||
| PRDYAFGLa | 937.5 | SIFamide | |
| GYRKPPFNGSIFa | 1381.7 | ||
| B-type allatostatins | |||
| NWNKFQGSWa | 1165.6 | CabTRP 1a | |
| GNWNKFQGSWa | 1222.6 | APSGFLGMRa | 934.5 |
| NNWSKFQGSWa | 1252.6 | ||
| STNWSSLRSAWa | 1293.6 | Orcokinins | |
| NNNWSKFQGSWa | 1366.6 | NFDEIDRSGFG* | 1256.6 |
| VPNDWAHFRGSWa | 1470.7 | NFDEIDRSGFGFA | 1474.7 |
| NFDEIDRSGFGFV | 1502.7 | ||
| CCAP | NFDEIDRSSFGFV | 1532.7 | |
| PFCNAFTGCa | 956.4 | NFDEIDRSSFGFN | 1547.7 |
| RYamides | Orcomyotropin-related | ||
| FYSQRYa | 862.4 | FDAFTTGFGHS | 1186.5 |
| SGFYANRYa | 976.5 | ||
| SSRFVGGSRYa | 1114.6 | ||
| pEGFYSQRYa | 1030.5 | ||
| YRamide | |||
| HIGSLYRa | 844.5 | ||
denotes neuropeptides localized differently from other members of their respective families. Underlined sequences were confirmed by tandem MS.
Figure 4. Colocalization of RFamide-related peptides in the pericardial organs.
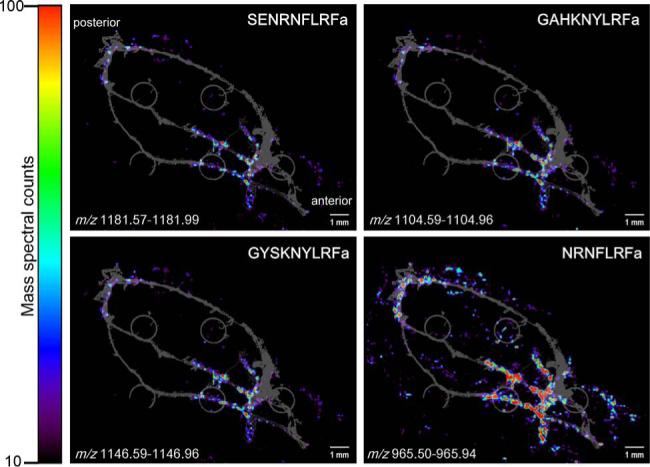
MS images of four peptides with homologous C-terminal sequences of LRFamide show similar distribution (displayed on the same color intensity scale). The grey underlay image is the optical image of the PO as it was placed on the MALDI plate. The small grey circles are the sample wells of the MALDI plate.
Pericardial organ imaging
Figure 1 shows the location of the pericardial organs (POs) in the crab as well as common terminology47 used to describe these organs. Each PO consists of vertical anterior and posterior bar regions which are connected by longitudinal nerve trunks. The bar regions are approximately 3.0 mm long and 0.5 mm in cross-sectional diameter, and the nerve trunks are slightly over 1.0 cm long with cross-sectional diameters near 0.13 mm.
The RFamide family, which is implicated in feeding behavior in both invertebrates and vertebrates,48 showed familial colocalization within the PO. Mass spectral signals from members of this family including NRNFLRFa (m/z 965.5), GNRNFLRFa (m/z 1022.6), SDRNFLRFa (m/z 1053.6), GAHKNYLRFa (m/z 1104.6), GYSKNYLRFa (m/z 1146.6), AYNRSFLRFa (m/z 1172.6), and SENRNFLRFa (m/z 1181.6) were most prevalent in the trunks and posterior bar region of the POs. This colocalization pattern is highlighted in Figure 4 which shows the MS images of four RFamide neuropeptides.
The A-type allatostatins (AST-A) investigated here, pERAYSFGLa (m/z 923.5) and PRDYAFGLa (m/z 937.5), had nearly identical spatial profiles with significant signal intensity in the anterior region of the pericardial organ. The B-type allatostatins (AST-B), NWNKFQGSWa (m/z 1165.6), GNWNKFQGSWa (m/z 1222.6), NNWSKFQGSWa (m/z 1252.6), STNWSSLRSAWa (m/z 1293.6), NNNWSKFQGSWa (m/z 1366.6), and VPNDWAHFRGSWa (m/z 1470.7) also showed very similar spatial localization among family members with a high concentration in the anterior region of the PO. As highlighted in Figure 3, the AST-A and AST-B localizations were similar, but not identical. The AST-B family exhibited the highest intensity in the central trunk while the AST-A family was most prevalent in the ventral trunk and anterior bar region of the PO. Interestingly, despite the remarkable sequence differences between the AST-A and AST-B peptide families, members from the two families exert similar physiological actions on the pyloric neural circuit in the stomach where they have inhibitory effects on the pyloric rhythm.49, 50 The overlapping, yet distinct, localization patterns of the two peptide families revealed by the imaging study described here may suggest differential release and regulation of the two families.
Although crustacean cardioactive peptide (CCAP, PFCNAFTGCa, m/z 956.4) was not readily detectable in every preparation, successful detection of this neuropeptide showed its spatial profile was highly homologous with the AST-B family distribution.
The most pronounced difference in spatial localization was the high concentration of the RYamide family neuropeptides FYSQRYa (m/z 862.4), SGFYANRYa (m/z 976.5), SSRFVGGSRYa (m/z 1114.6), and pEGFYSQRYa51 (m/z 1030.5) in the anterior bar. Although these peptides were also present in the adjacent nerves, there was an apparent contrast between this family and all other families investigated. Notably, the peptide HIGSLYRa (m/z 844.5) did not share this expression pattern but was instead localized in the anterior region of the trunks similar to the AST-A family. For this YRamide-family peptide, isoleucine and leucine were assigned based on likely homology to an expressed sequence tag of a peptide hormone in Homarus americanus and Carcinus maenas52. The remarkable disparity between the bar and trunk regions of the PO is apparent upon critical evaluation of the mass spectra shown in Figure 3. The differential expression of peptide families throughout the PO is further highlighted by the inclusion of MS images from four of the families discussed (Figure 3). These general trends of neuropeptide distribution were observed in each of three POs imaged using this technology.
Unlike previous studies that focused on cellular localization of immunoreactivity in the trunks of the POs,28, 43 our characterization of this organ by MS imaging was extended to the anterior and posterior bar regions. The discovery of intense signal from the RYamide family in the anterior bar region was particularly intriguing. Although members of this family of neuromodulators are released upon high K+ depolarization of isolated POs,37 the physiological actions of these peptides have yet to be described in crabs. In mammals, neuropeptides with a conserved RYamide C-terminal sequence, such as peptide YY, have been shown to affect food intake.53
Brain imaging
In Brachyuran crabs, the brain is bilaterally symmetric and can be divided into three main regions (protocerebrum, deutocerebrum, and tritocerebrum) reflecting the three ganglia that have fused to form it.54 These regions lie in one plane so that most of the neuropils can be seen from both the dorsal and ventral sides. The general structure of the crab brain is shown in Figure 1.
IMS of the crab brain revealed interesting neuropeptide localization patterns (Figure 2). In many instances, neuropeptides of the same family were similarly localized. However, there were a few exceptions to this general trend. Most RFamide family peptides including, NRNFLRFa (m/z 965.5), GAHKNYLRFa (m/z 1104.6), GNRNFLRFa (m/z 1022.6), GYSKNYLRFa (m/z 1146.6), APQRNFLRFa (m/z 1147.6), AYNRSFLRFa (m/z 1172.6), and SENRNFLRFa (m/z 1181.6) were located distal to the midline and exhibited higher intensity in the caudal brain region than the rostral region.
The highest intensity of SIFamide (GYRKPPFNGSIFa, m/z 1381.7), an isoform of which activates the pyloric rhythm in lobsters,55 could be mapped to the same distal regions as the RFamides, but SIFamide exhibited more uniform intensity throughout the slice medially.
Cancer borealis tachykinin-related peptide 1a (CabTRP 1a, APSGFLGMRa, m/z 934.5) exhibited the strongest signal intensity in the brain slice and maps similarly to the previously mentioned RFamides. Tachykinins are vasoactive peptides in mammals.56
The most pronounced difference in localization was the strong signal intensity of the orcokinin family neuropeptides including [Ala13]-Orc (NFDEIDRSGFGFA, m/z 1474.7), [Val13]-Orc (NFDEIDRSGFGFV, m/z 1502.7), [Ser9-Val13]-Orc (NFDEIDRSSFGFV, m/z 1532.7), and [Ser9-Asn13]-Orc (NFDEIDRSSFGFN, m/z 1547.7) in the rostral region of the brain slice. The orcokinin family, which exerts neuromodulatory effects on the lobster pyloric neural circuit57 and has been implicated in circadian clock control in the cockroach,58 exhibited signal intensity throughout the brain with a strong area of medial rostral expression. This intensity pattern is in stark contrast with that of the common RFamide family localization.
Although strong familial colocalization was apparent in both the PO and the brain, a few interesting exceptions were revealed in the brain images. The RFamide peptides SMPSLRLRFa (m/z 1105.6) and DVRTPALRLRFa (m/z 1342.8), recently identified in C. borealis brain extract,46 were mapped to the medial rostral brain region and showed comparable distribution on both sides of the midline very similar to the full length orcokinin peptides. The differential distribution pattern between GAHKNYLRFa (m/z 1104.6) and SMPSLRLRFa (m/z 1105.6) was particularly striking as the two peptides differ in mass by only 1 Da. Although, it is possible that the 13C isotope of GAHKNYLRFa contributed to the image of SMPSLRLRFa, the dramatic difference in location and signal intensity of these peptides enables differentiation.
The putative truncated orcokinin NFDEIDRSGFG (m/z 1256.6) and the orcomyotropin-related peptide FDAFTTGFGHS (m/z 1186.5) were localized together in the rostral region of the brain. These two peptides did not show bilaterally symmetric distribution. Although some similarity was apparent in the MS images among the truncated orcokinin peptide, the orcomyotropin-related peptide, and the full-length orcokinin peptides, this overlap was not as complete as was observed in other instances. These examples emphasize a major advantage of IMS over traditional immunocytochemical approaches. Because antibodies generally interact with the entire peptide family, antibody-based visualization could not have revealed this differential distribution of isoforms.
For comparison with the images of putative neuropeptide peaks, the image of a phospholipid is also included in Figure 2. Phosphatidylcholine 16:0/22:6, which is characterized by a [M+H]+ signal at m/z 806.6, [M+Na]+ at m/z 828.6, and [M+K]+ at m/z 844.6,59 was found to be equally distributed throughout the brain slice. This observation is consistent with the fact that phosphatidylcholine is one of the most abundant classes of phospholipids and is universally present in brain tissue.
The IMS data presented here represents the first attempt to map the locations of neuromodulators in the C. borealis brain. The results of this imaging experiment were reproduced in a second animal via the aforementioned microspotting experiments which confirm our observations regarding the differential distribution of neuropeptide families in the brain, the familial colocalization of peptide isoforms, and the noted exceptions to this trend. Although previous studies which utilized in-situ hybridization,60 immunocytochemistry,61 or MALDI MS profiling62 to localize neuropeptides in crayfish brain could potentially offer some further insight into peptide distribution in a crustacean brain, due to lack of knowledge about the degree of homology between the crab and crayfish brain no detailed comparison can be made at this time.
MS/MS
While most MALDI-based imaging studies rely on mass measurement alone to identify peptides and proteins, sequence-specific fragmentation such as post-source decay and collisional-induced dissociation (CID) can provide increased confidence for assignment16. Here we have taken advantage of performing MS imaging experiments on an instrument capable of providing this type of fragmentation information. Neuropeptide sequences underlined in Table 1 indicate that these assignments were confirmed by tandem MS analysis. Figure 5 shows high-energy CID fragmentation spectra of an RYamide and an RFamide characterized by abundant sequence-specific fragment ions. Although some sequence information can be obtained by performing MS/MS on previously imaged PO preparations (data not shown), fresh tissue dried droplet matrix application of DHB produces precursor ions with higher abundance and thus can yield nearly complete sequence coverage (Figure 5). Nonetheless, the capability to generate molecular maps and to detect sequence-specific fragments from the same tissue preparation highlights the advantage of performing imaging experiments on a MALDI TOF/TOF instrument.
Figure 5. Direct tissue CID of neuropeptides from two families.

(a) MS/MS fragmentation spectrum of m/z 1030.5 enables the sequence confirmation of pEGFYSQRYamide. Abundant sequence-specific ions including immonium, b-type, and y-type ions as well as several side chain cleavage ions such as v- and w-type ions are noted. (b) MS/MS fragmentation spectrum of m/z 965.5 confirming the sequence derivation of NRNFLRFamide.
Conclusions
In summary, we have demonstrated the first MALDI TOF/TOF imaging of a multitude of neuropeptides in a decapod crustacean nervous system. An effective sample preparation protocol that enabled an in-depth investigation of neuropeptide localization in decapod crustacean neuronal tissues by MALDI-IMS was developed. Many neuropeptides were colocalized with peptides of high sequence homology. However, a few interesting exceptions to this were noted. The peptide families exhibiting the most unique distributions were the RYamides in the PO and the orcokinins in the brain. Fragmentation by CID was used for sequence confirmation. This large-scale localization of neuropeptides by MALDI-IMS revealed the differential distribution of numerous members of multiple peptide families. This information may contribute to the understanding of potential interactions of neuropeptides within specific neuronal structures. Concepts derived from these imaging experiments will offer novel insights into neuropeptide diversity and multiplicity.
Acknowledgements
The authors thank the University of Wisconsin-Biotechnology Center Mass Spectrometry Facility, Dr. Amy Harms, and Dr. Mike Sussman for access to the MALDI-TOF/TOF instrument. The instrument was purchased through an NSF MRI grant (DBI-0520825). Thanks to the Dr. Judd Aiken laboratory for use of their cryostat, the Dr. Maureen Barr laboratory for use of a microscope, and Heidi Behrens from the Li laboratory for critical evaluation of the manuscript. We also thank Dr. Junhua Wang from the Li laboratory for assisting with the microspotting experiment. This work was supported in part by the School of Pharmacy and Wisconsin Alumni Research Foundation at the University of Wisconsin-Madison, a National Science Foundation CAREER award (CHE-0449991), and National Institutes of Health through grant #1R01DK071801. L.L. acknowledges an Alfred P. Sloan Research Fellowship and J.J.S. acknowledges an American Foundation for Pharmaceutical Education (AFPE) predoctoral fellowship. K.N. is supported by a National Institutes of Health Chemistry Biology Interface Training Grant (T32) #GM008505.
References
- 1.Todd PJ, McMahon JM, Short RT, McCandlish CA. Anal. Chem. 1997;69:529A–535A. doi: 10.1021/ac971763g. [DOI] [PubMed] [Google Scholar]
- 2.Altelaar AF, van Minnen J, Jimenez CR, Heeren RM, Piersma SR. Anal. Chem. 2005;77:735–741. doi: 10.1021/ac048329g. [DOI] [PubMed] [Google Scholar]
- 3.Delcorte A, Bour J, Aubriet F, Muller JF, Bertrand P. Anal. Chem. 2003;75:6875–6885. doi: 10.1021/ac0302105. [DOI] [PubMed] [Google Scholar]
- 4.Touboul D, Kollmer F, Niehuis E, Brunelle A, Laprevote O. J. Am. Soc. Mass Spectrom. 2005;16:1608–1618. doi: 10.1016/j.jasms.2005.06.005. [DOI] [PubMed] [Google Scholar]
- 5.Chaurand P, Cornett DS, Caprioli RM. Curr. Opin. Biotechnol. 2006;17:431–436. doi: 10.1016/j.copbio.2006.06.002. [DOI] [PubMed] [Google Scholar]
- 6.Luxembourg SL, Mize TH, McDonnell LA, Heeren RM. Anal. Chem. 2004;76:5339–5344. doi: 10.1021/ac049692q. [DOI] [PubMed] [Google Scholar]
- 7.Jackson SN, Wang HY, Woods AS. Anal. Chem. 2005;77:4523–4527. doi: 10.1021/ac050276v. [DOI] [PubMed] [Google Scholar]
- 8.Sjovall P, Lausmaa J, Johansson B. Anal. Chem. 2004;76:4271–4278. doi: 10.1021/ac049389p. [DOI] [PubMed] [Google Scholar]
- 9.Caprioli RM, Farmer TB, Gile J. Anal. Chem. 1997;69:4751–4760. doi: 10.1021/ac970888i. [DOI] [PubMed] [Google Scholar]
- 10.Crecelius AC, Cornett DS, Caprioli RM, Williams B, Dawant BM, Bodenheimer B. J. Am. Soc. Mass Spectrom. 2005;16:1093–1099. doi: 10.1016/j.jasms.2005.02.026. [DOI] [PubMed] [Google Scholar]
- 11.Chaurand P, Fouchecourt S, DaGue BB, Xu BJ, Reyzer ML, Orgebin-Crist MC, Caprioli RM. Proteomics. 2003;3:2221–2239. doi: 10.1002/pmic.200300474. [DOI] [PubMed] [Google Scholar]
- 12.Skold K, Svensson M, Nilsson A, Zhang X, Nydahl K, Caprioli RM, Svenningsson P, Andren PE. J. Proteome Res. 2006;5:262–269. doi: 10.1021/pr050281f. [DOI] [PubMed] [Google Scholar]
- 13.Hsieh Y, Casale R, Fukuda E, Chen J, Knemeyer I, Wingate J, Morrison R, Korfmacher W. Rapid Commun. Mass Spectrom. 2006;20:965–972. doi: 10.1002/rcm.2397. [DOI] [PubMed] [Google Scholar]
- 14.Hsieh Y, Chen J, Korfmacher WA. J. Pharmacol. Toxicol. Methods. 2006 doi: 10.1016/j.vascn.2006.06.004. in press. [DOI] [PubMed] [Google Scholar]
- 15.Khatib-Shahidi S, Andersson M, Herman JL, Gillespie TA, Caprioli RM. Anal. Chem. 2006;78:6448–6456. doi: 10.1021/ac060788p. [DOI] [PubMed] [Google Scholar]
- 16.Verhaert PD, Prieto Conaway MC, Pekar TM, Miller K. Int. J. Mass Spectrom. 2007;260:177–184. [Google Scholar]
- 17.Altelaar AFM, Taban IM, McDonnell LA, Verhaert PD, de Lange RPJ, Adan RAH, Mooi WJ, Heeren RMA, Piersma SR. Int. J. Mass Spectrom. 2007;260:203–211. [Google Scholar]
- 18.Parkin MC, Wei H, O'Callaghan JP, Kennedy RT. Anal. Chem. 2005;77:6331–6338. doi: 10.1021/ac050712d. [DOI] [PubMed] [Google Scholar]
- 19.Fu Q, Goy MF, Li L. Biochem. Biophys. Res. Commun. 2005;337:765–778. doi: 10.1016/j.bbrc.2005.09.111. [DOI] [PubMed] [Google Scholar]
- 20.Dowell JA, Vander Heyden W, Li L. J. Proteome Res. 2006;5:3368–3375. doi: 10.1021/pr0603452. [DOI] [PubMed] [Google Scholar]
- 21.Kutz KK, Schmidt JJ, Li L. Anal. Chem. 2004;76:5630–5640. doi: 10.1021/ac049255b. [DOI] [PubMed] [Google Scholar]
- 22.Nachman RJ, Russell WK, Coast GM, Russell DH, Miller JA, Predel R. Peptides. 2006;27:521–526. doi: 10.1016/j.peptides.2005.07.022. [DOI] [PubMed] [Google Scholar]
- 23.DeKeyser SS, Li L. Anal. Bioanal. Chem. 2007;387:29–35. doi: 10.1007/s00216-006-0596-x. [DOI] [PubMed] [Google Scholar]
- 24.Neupert S, Predel R, Russell WK, Davies R, Pietrantonio PV, Nachman RJ. Biochem. Biophys. Res. Commun. 2005;337:1860–1864. doi: 10.1016/j.bbrc.2005.10.165. [DOI] [PubMed] [Google Scholar]
- 25.Jimenez CR, Spijker S, de Schipper S, Lodder JC, Janse CK, Geraerts WP, van Minnen J, Syed NI, Burlingame AL, Smit AB, Li K. J. Neurosci. 2006;26:518–529. doi: 10.1523/JNEUROSCI.2566-05.2006. [DOI] [PMC free article] [PubMed] [Google Scholar]
- 26.Rubakhin SS, Churchill JD, Greenough WT, Sweedler JV. Anal. Chem. 2006;78:7267–7272. doi: 10.1021/ac0607010. [DOI] [PMC free article] [PubMed] [Google Scholar]
- 27.Li KW, Hoek RM, Smith F, Jimenez CR, van der Schors RC, van Veelen PA, Chen S, van der Greef J, Parish DC, Benjamin PR. J. Biol. Chem. 1994;269:30288–30292. [PubMed] [Google Scholar]
- 28.Christie AE, Skiebe P, Marder E. J. Exp. Biol. 1995;198:2431–2439. doi: 10.1242/jeb.198.12.2431. [DOI] [PubMed] [Google Scholar]
- 29.Skiebe P, Dietel C, Schmidt M. J. Comp. Neurol. 1999;414:511–532. [PubMed] [Google Scholar]
- 30.Pulver SR, Marder E. J. Comp. Neurol. 2002;451:79–90. doi: 10.1002/cne.10331. [DOI] [PubMed] [Google Scholar]
- 31.Altelaar AF, Klinkert I, Jalink K, de Lange RP, Adan RA, Heeren RM, Piersma SR. Anal. Chem. 2006;78:734–742. doi: 10.1021/ac0513111. [DOI] [PubMed] [Google Scholar]
- 32.Taban IM, Altelaar AF, van der Burgt YE, McDonnell LA, Heeren RM, Fuchser J, Baykut G. J. Am. Soc. Mass Spectrom. 2007;18:145–151. doi: 10.1016/j.jasms.2006.09.017. [DOI] [PubMed] [Google Scholar]
- 33.Jurchen JC, Rubakhin SS, Sweedler JV. J. Am. Soc. Mass Spectrom. 2005;16:1654–1659. doi: 10.1016/j.jasms.2005.06.006. [DOI] [PubMed] [Google Scholar]
- 34.Nusbaum MP, Beenhakker MP. Nature. 2002;417:343–350. doi: 10.1038/417343a. [DOI] [PMC free article] [PubMed] [Google Scholar]
- 35.Marder E, Bucher D. Annu. Rev. Physiol. 2006 doi: 10.1146/annurev.physiol.69.031905.161516. in press. [DOI] [PubMed] [Google Scholar]
- 36.Skiebe P. J. Exp. Biol. 2001;204:2035–2048. doi: 10.1242/jeb.204.12.2035. [DOI] [PubMed] [Google Scholar]
- 37.Li L, Kelley WP, Billimoria CP, Christie AE, Pulver SR, Sweedler JV, Marder E. J. Neurochem. 2003;87:642–656. doi: 10.1046/j.1471-4159.2003.02031.x. [DOI] [PubMed] [Google Scholar]
- 38.Fu Q, Kutz KK, Schmidt JJ, Hsu YW, Messinger DI, Cain SD, de la Iglesia HO, Christie AE, Li L. J. Comp. Neurol. 2005;493:607–626. doi: 10.1002/cne.20773. [DOI] [PubMed] [Google Scholar]
- 39.Fu Q, Li L. Anal. Chem. 2005;77:7783–7795. doi: 10.1021/ac051324e. [DOI] [PubMed] [Google Scholar]
- 40.Bohm H, Dybek E, Heinzel HG. J. Comp. Physiol. [A] 2001;187:393–403. doi: 10.1007/s003590100212. [DOI] [PubMed] [Google Scholar]
- 41.Schwartz SA, Reyzer ML, Caprioli RM. J. Mass Spectrom. 2003;38:699–708. doi: 10.1002/jms.505. [DOI] [PubMed] [Google Scholar]
- 42.Kruse R, Sweedler JV. J. Am. Soc. Mass Spectrom. 2003;14:752–759. doi: 10.1016/S1044-0305(03)00288-5. [DOI] [PubMed] [Google Scholar]
- 43.Skiebe P. J. Comp. Neurol. 1999;403:85–105. [PubMed] [Google Scholar]
- 44.Schwarz TL, Lee GM, Siwicki KK, Standaert DG, Kravitz EA. J. Neurosci. 1984;4:1300–1311. doi: 10.1523/JNEUROSCI.04-05-01300.1984. [DOI] [PMC free article] [PubMed] [Google Scholar]
- 45.Yasuda-Kamatani Y, Yasuda A. Gen. Comp. Endocrinol. 2000;118:161–172. doi: 10.1006/gcen.1999.7453. [DOI] [PubMed] [Google Scholar]
- 46.Huybrechts J, Nusbaum MP, Bosch LV, Baggerman G, De Loof A, Schoofs L. Biochem. Biophys. Res. Commun. 2003;308:535–544. doi: 10.1016/s0006-291x(03)01426-8. [DOI] [PubMed] [Google Scholar]
- 47.Maynard DM. Gen. Comp. Endocrinol. 1961;1:237–263. doi: 10.1016/0016-6480(61)90033-8. [DOI] [PubMed] [Google Scholar]
- 48.Dockray GJ. Exp. Physiol. 2004;89:229–235. doi: 10.1113/expphysiol.2004.027169. [DOI] [PubMed] [Google Scholar]
- 49.Skiebe P, Schneider H. J. Exp. Biol. 1994;194:195–208. doi: 10.1242/jeb.194.1.195. [DOI] [PubMed] [Google Scholar]
- 50.Fu Q, Tang L, Marder E, Li L. J. Neurochem. 2007 doi: 10.1111/j.1471-4159.2007.04482.x. In press. [DOI] [PubMed] [Google Scholar]
- 51.Messinger DI, Bruns EA, Goiney CC, Easton CR, Hsu YA, Day-Bazhaw NM, Savage EE, Stemmler EA, Dickinson PS, Christie AE. Society of Neuroscience Abstract. 2006;32:129.8. [Google Scholar]
- 52.Towle DW, Smith CM. Integr. Comp. Biol. 2006;46:912–918. doi: 10.1093/icb/icl002. [DOI] [PubMed] [Google Scholar]
- 53.Dhillo WS, Bloom SR. Horm. Metab. Res. 2004;11−12:846–851. doi: 10.1055/s-2004-826174. [DOI] [PubMed] [Google Scholar]
- 54.Sandeman D, Sandeman R, Derby C, Schmidt M. Biological Bulletin. 1992:304–326. doi: 10.2307/1542217. [DOI] [PubMed] [Google Scholar]
- 55.Christie AE, Stemmler EA, Peguero B, Messinger DI, Provencher HL, Scheerlinck P, Hsu YW, Guiney ME, de la Iglesia HO, Dickinson PS. J. Comp. Neurol. 2006;496:406–421. doi: 10.1002/cne.20932. [DOI] [PubMed] [Google Scholar]
- 56.Walsh DA, F McWilliams D. Curr. Drug Targets. 2006;8:1031–1042. doi: 10.2174/138945006778019291. [DOI] [PubMed] [Google Scholar]
- 57.Li L, Pulver SR, Kelley WP, Thirumalai V, Sweedler JV, Marder E. J. Comp. Neurol. 2002;444:227–244. doi: 10.1002/cne.10139. [DOI] [PubMed] [Google Scholar]
- 58.Hofer S, Homberg U. J. Exp. Biol. 2006;209:2794–2803. doi: 10.1242/jeb.02307. [DOI] [PubMed] [Google Scholar]
- 59.Schiller J, Suss R, Arnhold J, Fuchs B, Lessig J, Muller M, Petkovic M, Spalteholz H, Zschornig O, Arnold K. Prog. Lipid Res. 2004;43:449–488. doi: 10.1016/j.plipres.2004.08.001. [DOI] [PubMed] [Google Scholar]
- 60.Yasuda-Kamatani Y, Yasuda A. J. Comp. Neurol. 2006;496:135–147. doi: 10.1002/cne.20903. [DOI] [PubMed] [Google Scholar]
- 61.Yasuda A, Yasuda-Kamatani Y, Nozaki M, Nakajima T. Gen. Comp. Endocrinol. 2004;135:391–400. doi: 10.1016/j.ygcen.2003.10.001. [DOI] [PubMed] [Google Scholar]
- 62.Yasuda-Kamatani Y, Yasuda A. Eur. J. Biochem. 2004;271:1546–1556. doi: 10.1111/j.1432-1033.2004.04065.x. [DOI] [PubMed] [Google Scholar]