

Abstract
Poly(propylene fumarate) (PPF) is an important biodegradable and crosslinkable polymer designed for bone tissue-engineering applications. For the first time we report the extensive characterization of this biomaterial including molecular weight dependences of physical properties such as glass transition temperature Tg, thermal degradation temperature Td, density ρ melt viscosity η0, hydrodynamic radius RH, and intrinsic viscosity [η]. The temperature dependence of η0 changes progressively with molecular weight, while it can be unified when the temperature is normalized to Tg. The plateau modulus and entanglement molecular weight Me have been obtained from the rheological master curves. A variety of chain microstructure parameters such as the Mark-Houwink-Sakurada constants K and α, characteristic ratio C∞, unperturbed chain dimension , packing length p, Kuhn length b, and tube diameter a have been deduced. Further correlation between the microstructure and macroscopic physical properties has been discussed in light of recent progress in polymer dynamics to supply a better understanding about this unsaturated polyester to advance its biomedical uses. The molecular weight dependence of Tg for six polymer species including PPF has been summarized to support that Me is irrelevant for the finite length effect on glass transition, while surprisingly these polymers can be divided into two groups when their normalized Tg is plotted simply against Mw to indicate the deciding roles of inherent chain properties such as chain fragility, intermolecular cooperativity, and chain end mobility.
Introduction
The diverse clinical needs for bone regeneration include applications arising from resection of primary and metastatic tumors, bone loss after skeletal trauma, total joint arthroplasty with bone deficiency, spinal arthrodesis, and trabecular voids. Polymeric biomaterials with satisfactory properties in biocompatibility, mechanical properties, osteoinductivity, sterilizability, and handling characteristics are the most attractive substitute for autologous bone or allograft bone. Recently developed injectable materials have fulfilled many design criteria for diverse orthopedic applications. One promising candidate material of this type is poly(propylene fumarate) (PPF) (Scheme 1), an unsaturated linear polyester that can be modified or crosslinked through its fumarate double bonds.1–6 PPF can be crosslinked via radical polymerization by itself or with crosslinkers such as methylmethacrylate, N-vinyl pyrrolidinone (NVP), and biodegradable macromers of PPF-diacrylate or poly(ethylene glycol)-diacrylate.5 PPF degrades by simple hydrolysis of the ester bonds and the degradation time depends on polymer characteristics such as molecular weight, type of crosslinker, and crosslinking density.1–6 Although many efforts1–6 have been made to explore the biomedical applications of PPF-based materials, which often were used in crosslinked form, there still lacks comprehensive physical characterizations and rheological understanding of this polymer in its uncrosslinked form.
Scheme 1.
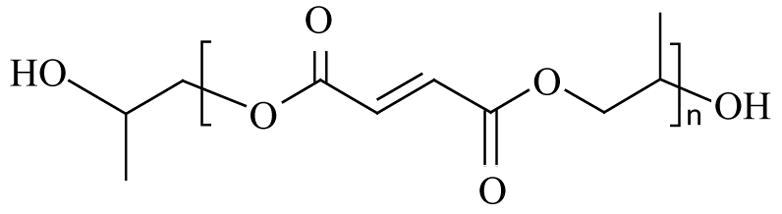
Chemical Structure of PPF
In this work, we report the molecular weight dependence of various important parameters such as glass transition temperature (Tg), thermal degradation temperature (Td), and polymer density ρ Rheological characteristics of PPF including melt viscosity and its temperature dependence, and intrinsic viscosity [η] in tetrahydrofuran at 30 °C have also been assessed. These parameters are crucial in processing PPF and choosing optimal molecular weights to construct bone-tissue engineering scaffolds using both fabrication methods of injection molding and stereolithography. Furthermore, a variety of chain microstructure parameters including the Mark-Houwink-Sakurada constants, characteristic ratio, unperturbed chain dimension, packing length, Kuhn length, and tube diameter have been calculated using the theory in polymer dynamics. Finally, the correlation between the microstructure and macroscopic physical properties will be discussed and the molecular weight dependence of Tg will be further emphasized together with another five polymer species. Therefore, the objective of this work is not only to supply an extensive library of important chain parameters and physical properties of PPF, but also to further examine the validity of state-of-art theoretical work on chain dynamics on unsaturated polyesters and investigate the finite length effect on glass transition using PPF as a model polymer.
Experimental Section
PPF was produced as previously described.6 Briefly, diethyl fumarate (DBF) and an excess amount of 1,2-propane diol were mixed together in a flask with hydroquinone as a crosslinking inhibitor and zinc chloride as a polymerization catalyst. The reaction was first performed to obtain the fumaric diester at 100 °C for 1 hr and then 150 °C for 7 hr. The excess of 1,2-propane diol and the byproduct ethanol were removed. Then the intermediate was transesterified under vacuum to form the linear PPF with 28 different molecular weights by varying the polymerization time or temperature. Polymer fractionation was carried out using methylene chloride solutions with ether as the non-solvent.
Gel Permeation Chromatography (GPC) was performed with a Waters 717 Plus autosampler GPC system (Waters, Milford, MA) connected to a model 515 HPLC pump and model 2410 refractive index detector. Monodisperse polystyrene standards (Polysciences, Warrington, PA) with four molecular weights (474, 6690, 18600, and 38000 g.mol−1) were used to obtain a universal calibration curve for calculating the molecular weights of the polymers herein.
Differential Scanning Calorimetry (DSC) was done on a TA Instruments DSC Q1000 differential scanning calorimeter at a heating rate of 10 °C/min under nitrogen. To keep the same thermal history, each sample was preheated from room temperature to 100 °C and cooled to −90 °C at a cooling rate of 5 °C/min. Then the DSC scan was recorded via heating from −90 °C to 100 °C. Thermogravimetric Analysis (TGA) was done using a TA model Q500 thermal analyst in flowing nitrogen at a heating rate of 20 °C/min.
Linear viscoelastic properties of PPF melts and solutions in DBF were measured by a dynamic mechanical spectrometer (AR2000 rheometer, TA instruments) at frequencies ranging from 0.1 to 628.3 rad/s and at various temperatures between 0 and 100 °C. Oscillatory shear measurements were carried out using a 20 mm diameter parallel plate flow cell with a geometry gap of 1.0 mm to measure the storage and loss moduli G and G″ and the zero-shear viscosity η0 A small strain (γ<0.05) was always used when |G*| was large, and no strain amplitudes were greater than 0.10. The steady state shear viscosities at low shear rate were also measured and the results were consistent with the dynamic viscosity at low frequencies.
Viscosities for the dilute polymer solutions in tetrahydrofuran (THF) and the solvent THF were measured at 30.0±0.05 °C with a calibrated Cannon Ubbelohbe capillary viscometer (Model OC, Cannon Instrument Company) in a water bath equipped with a Lauda ECO-Line Immersion Circulator (Brinkmann Co.). The intrinsic viscosities and hydrodynamic radii of three PPF samples have been characterized using Viscotek’s Size Exclusive Chromatography (SEC) instrument consisting of a Tetra Detector (Refractive Index, UV, Light Scattering, and Viscometry) Array (TDA™) and GPCma™ front-end Chromatography setup with a refractive index increment parameter dn/dc of 0.080 mL.g−1.
Polymer density was measured at 20 °C in weighed GPC vials by comparing the sample to an identical volume of distilled water, which had a density of 0.99821 g.ml−1.7 The molecular characteristics and physical properties for 8 typical PPF samples are shown in Table 1.
Table 1.
Physical Properties of Representative PPF Samples
| No | Mw (g.mol−1) | Mn (g.mol minus;1) | Mw/Mn | Tg (°C) | Td (°C) | ρ (g.cm minus;3)a | η0 (Pa.s) at 40 °C | C1b | C2 (°C)b | [η] (dL minus;1.g)c |
|---|---|---|---|---|---|---|---|---|---|---|
| 1 | 1130 | 800 | 1.61 | −22.4 | 336 | 1.239 | 24 | 6.7 | 121.6 | 0.029 |
| 2 | 1640 | 1160 | 1.42 | −12.5 | 344 | 1.256 | 120 | 6.5 | 97.4 | 0.036 |
| 3 | 2530 | 1460 | 1.73 | 2.8 | 343 | 1.267 | 2370 | 8.8 | 94.2 | 0.045 |
| 4 | 3340 | 1760 | 1.90 | 8.6 | -- | -- | 11600 | 8.8 | 75.7 | -- |
| 5 | 4370 | 2030 | 2.16 | 9.0 | -- | -- | 34400 | 9.8 | 81.3 | -- |
| 6 | 5830 | 2460 | 2.37 | 17.8 | 347 | 1.278 | 230000 | 11 | 81.2 | -- |
| 7 | 7910 | 3460 | 2.29 | 24.2 | 351 | 1.276 | 840000 | 8.7 | 76.9 | 0.086 |
| 8 | 17900 | 11200 | 1.60 | 28.9 | 345 | -- | -- | 9.0 | 70.9 | -- |
Measured at 20 °C.
Reference temperature T0=25 °C for PPF1–6, 40 °C for PPF7, and 50 °C for PPF8.
Intrinsic viscosity was measured in THF at 30.0±0.05 °C.
Results and Discussion
The 28 PPF samples obtained directly from polycondensation have weight-average molecular weights varying from 1110 to 11000 g.mol−1 and a polydispersity between 1.4 and 2.8. Ten relatively monodisperse (polydispersity between 1.21 and 1.78) fractions were obtained from fractionation of PPF10, shown as l0a–l0j in Table SI in Supporting Information. It should be noted that a small fraction of branching or partial crosslinking occurred due to the Ordelt reaction,6,8 i.e., the addition of glycols onto the double bonds of unsaturated segments. New methods, such as transesterification between the diester of fumaric acid and diols, and the use of a less acidic catalyst such as ZnCl2 have been used to reduce the extent of the Ordelt reaction.6 The Ordelt saturation ratio can be calculated from the chemical shifts around 2.9–3.1 ppm and 6.8 ppm in 1H NMR spectra in Figure S1 to be less than 3%, which is in agreement with earlier studies.6,8 No discernible chemical shifts at 37 and 75 ppm belonging to Ordelt saturation can be found in the 13C spectra of any PPF samples in Figure S2. As cited in an earlier paper8i, Piras8k showed that the chain branches caused by Ordelt saturation are mostly monomer short-chain branches. Besides the short-chain branches, only a small fraction (<3 wt.%) due to partial crosslinking can be found in the GPC curves in Figure S3 of PPF5–8 in Table 1. Because both fractions are very small, they can be safely omitted for the eight PPF samples that will be investigated in detail as linear chains.
DSC results show that all the PPF samples are amorphous and there is a single glass transition occurring at different temperatures for different molecular weights. Tg here refers to the mid-point of the glass transition. It is evident in Figure 1a that Tg increases dramatically with the molecular weight from ~−30 °C to ~30 °C when the molecular weight is lower than a critical Mn around 5000 g.mol−1. A similar molecular weight dependence of Tg has been identified for many polymer species.9–12 The thermal degradation temperature Td and polymer density ρ also increase with the molecular weight in a similar fashion. However, the molecular weight dependence for Td and ρ is much weaker than that for Tg, as observed in the inset of Figure 1a when these three parameters are normalized to their asymptotic values. Such difference has been reported for polystyrene (PS),13 1,4-polybutadiene (1,4-PBD),14 and poly(diethylene glycol-co-succinic acid).15 The molecular weight dependence of Tg for PPF is plotted against Mn using the Fox-Flory equation
Figure 1.

(a) Number-average molecular weight dependences of Tg and Td. Inset: physical properties (Tg, Td, and ρ) of PPF normalized to the asymptotic values at infinite molecular weight, (b) Fox-Flory expression of molecular weight dependences of Tg for PPF. Inset: polydispersity of PPF vs. number-average molecular weight.
| (1) |
in Figure 1b. The linear fitting results in a constant A of 45,100 and a glass transition temperature Tg∞ of 31.9 °C extrapolated to infinite molecular weight. Tg vs. 1000/MW is also given for comparison. It can be seen that both lines almost emerge at infinite molecular weight. The inset in Figure 1b shows the polydispersity for all the PPF samples in this study. The samples obtained directly from polycondensation become more polydisperse for higher Mn while those from fractionation maintain a relatively lower constant around 1.5. No significant role of polydispersity was found in Figure 1.
The molecular weight dependence of polymer physical properties may be attributed to the finite length effect usually interpreted by chainend free volume approach.16 For the purpose of simplicity, rheological measurements have been performed on eight representative PPF samples (Table 1) covering the full molecular weight range at various temperatures to obtain information such as zeroshear viscosity η0 and the storage and loss moduli G′ and G″. The time temperature superposition (tTs) was applicable for PPF in the temperature range studied here and the master curves reduced to 40 °C were formed as shown in Figure 2. The C1, C2 values generated in Williams-Landel-Ferry (WLF) equation16
Figure 2.

Master curves of G′ and G″ of PPF3, 7, 8 at a reference temperature of 40 °C. Solid symbols: G′, Open symbols: G″.
| (2) |
are listed in Table 1. In eq 2, aTand bT are horizontal and vertical shift factors in tTs, respectively. Since bT depends very weakly on temperature, it is close to unity and can be ignored safely here. It should be mentioned that the C1, C2 values for PPF7 and 8 in Table 1 are at the reference temperatures of 40 and 50 °C, respectively, in contrast with 25 °C for the others. The correlation between different C1C2 pairs at different reference temperatures T1 and T2 can be described as:16
| (3) |
Therefore, the (C1, C2) values at 25 °C for PPF7 and 8 can be calculated to be (10.8, 61.9) and (13.9, 45.9), respectively. The master curves for PPF8 at 40 °C in Figure 2 were obtained indirectly from those at 50 °C by a horizontal shift factor aT = 30.4. It can be seen from the master curves that almost all the PPF samples are either unentangled or marginally entangled since there is no sufficient plateau regime. In the terminal regime at low frequencies, all the polymers show typical relations in G′ and G″ functions as G′ ∝ ω2 and G″ ∝ ωl.16 As usually expected for the terminal regime at lower frequencies, the glass regime at higher frequencies for different PPF samples also shifts to lower frequency region with increasing molecular weights. It implies that the local segmental motion in PPF varies with molecular weight in the molecular weight range studied here, which is similar to the trend found in low molecular weight PS.12
The measured η0 at 40 °C for seven representative PPF samples are given in Table 1 and the temperature dependence of η0 is shown in Figure 3a, which also varies with molecular weight. A smooth progression with molecular weight is evident in the inset of Figure 3a when the viscosity data were normalized to the values at 40 °C. The temperature dependence for PPF7 with an Mw of 7910 g.mol−1 is the strongest and the viscosity varies as much as 4 orders of magnitude when the temperature changes from 40 to 100 °C. This phenomenon is another manifestation of the molecular weight dependence of Tg. The η0 data in Figure 3a are replotted in Figures 3b and 3c, with the temperature subtracted by and normalized to the corresponding Tg of each PPF, respectively. It can be observed that all the seven PPF samples share the same (T-Tg) and Tg/T dependence. Furthermore, all the data can be well superposed together after vertical shifts by taking out the pure chain length effect on T/Q, shown in the insets of Figures 3b and 3c. Limited by the temperature window of rheological measurements, the melt viscosities at temperatures close to Tg are not reachable. Nevertheless, the identical molecular weight independent fragility m is expected for PPF as also revealed in many polymer species such as polydimethylsiloxane (PDMS)17,18 even in the molecular weight range that shows molecular weight dependent Tg. It should be mentioned here that an unusual increasing fragility with Mw was found in PS,12 particularly when the relaxation times were normalized to a fixed value, up to molecular weights at which Tg becomes invariant. For PS, by considering the low molecular weight polymer as a blend of chain ends and inner repeat units, the results were explained by the coupling model.19
Figure 3.


PPF melt viscosity vs. (a) T, (b) T-Tg, and (c) Tg/T. Inset in (a): viscosities at various temperatures reduced to 40 °C vs. temperature. Inset in (b): viscosities at various temperatures vertically shifted to the data for PPF1 vs. T-Tg by shift factors of 0.582, 0.275, 0.160, and 0.064 for PPF2, 3, 4, and 5–7, respectively. Inset in (c): viscosities at various temperatures vertically shifted to the data for PPF1 vs. Tg/T by shift factors of 0.574, 0.329, 0.197, 0.119, and 0.079 for PPF2, 3, 4, 5, and 6–7, respectively.
Figure 4 shows the molecular weight dependence of the viscosity for seven PPF samples (1–7) at five temperatures. The striking point is that the exponent a in η0 = kMa decreases gradually from as high as 7.0 at 25 °C to 3.1 at 100 °C, with a dramatically increasing k from 3.6 × 10⁻²⁰ to 1.2 × 10⁻¹⁰. Though the strong molecular weight and temperature dependences of viscosity make the iso-friction correction less accurate, the conventional free volume theory can be applied here to render Rouse prediction η0 ∝ M1.0 (dashed line in Figure 4) after adjustment of viscosity at 60 °C for PPF to constant monomeric friction coefficient. It uses the information of C1 and considers the C1 value for PPF8 is in the equation:14
Figure 4.
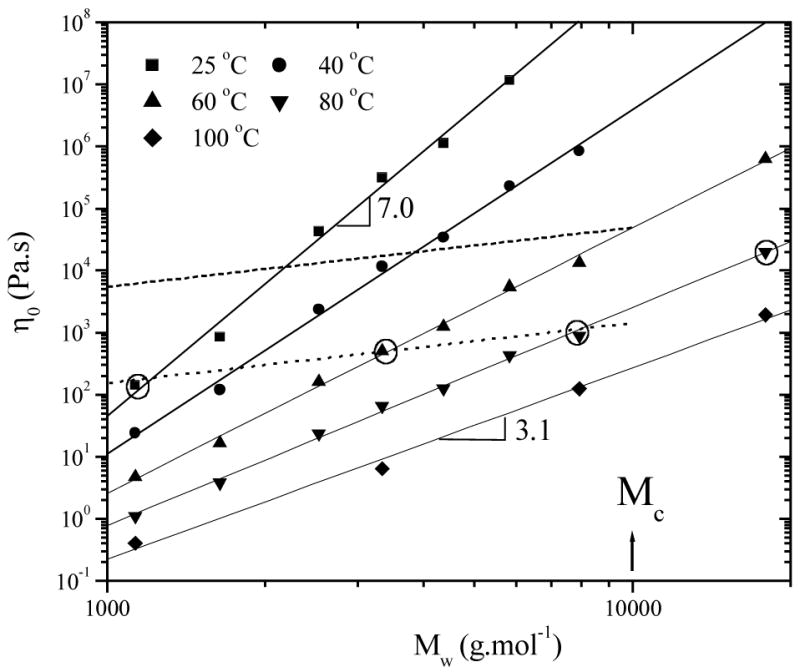
Molecular weight dependence of PPF zero-shear viscosity at various temperatures. The dashed and dotted lines show Rouse prediction η0 ∝ M1.0 using the iso-friction correction approach at 60 °C and the method of a fixed (T-Tg), respectively.
| (4) |
where is the viscosity without free volume effect, ζ∞ and ζ are monomeric friction coefficients for PPF8 and other PPF samples, respectively. It is interesting to note that Rouse prediction η0 ∝ M1.0 can be also achieved when a dotted line was drawn through the data points for PPF1, 4, and 7 (circled) at T=25, 60, and 80 °C, respectively, when (T-Tg) is close (47.4, 51.4, and 55.8 °C). Another data point highlighted in a circle is the viscosity of PPF8 at 80 °C with (T-Tg)=51.1 °C. It is apparently higher than the dotted line though (T-Tg) is close to the others, suggesting that entanglement occurs. The dashed and dotted lines intersect with the solid lines for viscosities at 60 and 80 °C, respectively, both at a critical molecular weight Mc of about 10,000 g.mol−1, marked with an arrow in Figure 4.
The viscosities of PPF in DBF at 25 °C (Figure 5) as well as their Tgs (inset) show a sharp decrease in both terms by adding DBF into PPF because of both plasticization and dilution effects. DEF’s viscosity at 25 °C is 2.12×10⁻³ Pa.s obtained by comparison with toluene (5.6×10~4 Pa.s)7 using a capillary viscometer. It is clear that the higher the PPF molecular weight, the stronger the concentration dependency. When the PPF composition is lower than 60%, no discernible glass transition exists in DSC curves and an exothermal peak of DBF appears around 0 °C. Furthermore, two glass transitions occur at around −26 and −61 °C for PPF7 in DBF at 60% to suggest phase separation. Figure 5 supplies useful information to choose optimal PPF molecular weight and PPF/DEF solution composition to obtain required mechanical properties while satisfying viscosity limitation for operation in PPF scaffold fabrication via stereolithography.20
Figure 5.

Viscosity of PPF/DEF solutions at 25 °C. Inset: Tg for the solutions.
When the solution concentration was in dilute regime, the intrinsic viscosities [η] in Table 1 for PPF1, 3, 7 in THF at 30 °C were obtained from the plot of ηsp/C vs. C, where C is polymer concentration in g.dL−1 and ηsp is specific viscosity. When [η] is plotted against molecular weight (Figure 6a), the constants in Mark-Houwink-Sakurada (MHS) equation [η] = KMα are K = 5.96×10⁻⁴ and α = 0.553. It implies that THF is nearly a 9 solvent for PPF, supported by large Huggins coefficient (RH) values ranging from 0.5 to 1.5.21 Both sets of data from dilute solution viscometry and GPC are consistent with each other. The inset of Figure 6a shows the molecular weight dependence of hydrodynamic radius (RH) of PPF. The slope of 0.59 is a typical value for the linear random coils. The characteristic ratio C∞ for characterizing chain flexibility can be determined from the relation
Figure 6.

(a) Intrinsic viscosity vs. Mw for PPF in THF at 30 °C determined from viscometry (solid circles) and GPC (solid squares). Inset: Hydrodynamic radius (Rh) of three PPF samples as a function of molecular weight. (b) Stockmayer-Fixman plot for PPF in THF at 30 °C.
| (5) |
In the calculation of the mean length l0 of a statistical skeletal unit of PPF, the C=C double bond is counted with the two associated single skeletal bonds (i.e., -C=C-) as one virtual bond because the C=C bond cannot rotate around its own axis.22 Therefore,l0 is 1.82 A using 1.54, 1.36, and 3.91 A for CC, CO, and C=C bonds. The number of statistical skeletal units in a chain, n, can be deduced using
| (6) |
where N is the number of repeating units, n0is the number of skeletal units per each repeating unit, M0.is.the repeating unit molecular weight, and m0is the molecular weight of average skeletal unit. M0 is 156 g.mol−1 and n0 is 6 for PPF. The unperturbed chain dimension can be achieved from Figure 6b of [η]M −1/2 vs. M.1/2 through the Stockmayer-Fixman relationship
| (7) |
where , φ0 represents the Flory constant of 2.5×10²¹ dL.mol−1.cm−3, and B is related to the polymersolvent interaction. The linear fitting in Figure 6 gives [η]M−1/2 =8.07×10⁻⁴ + 0.017M1/2. Therefore, .23 A value of 3.7 for C∞ was obtained to indicate PPF is a freely rotating chain. For comparison purpose, group addition prediction24 gives a larger Kθ value of 1.196×10⁻³ dL.g−3/2.mol1/2 and consequently a greater value of 0.611 Å2.mol.g−1.
The correlation between microscopic chain characteristics such as packing length p and tube diameter a, and macroscopic properties such as plateau modulus and entanglement molecular weight Me has been investigated in the recent 20 years.25–27 The packing length p is defined as the occupied volume of a chain divided by as follows:26
| (8) |
The calculation shows a value of 2.76 Å for p. The Kuhn length b for PPF can be further calculated to be 8.57 Å using21
| (9) |
The segmental dynamics are typically represented by the monomeric friction coefficient, ζ, as mentioned in eq 4. The strong temperature dependence of ζ can be obtained using the information of b and η0 according to Rouse theory expression:16
| (10) |
The ζ results for PPF1–8 are plotted in Figure 7 against both T and T-Tg (inset). Similar to the trend for viscosity in Figure 3, ζ also shows changing temperature dependence with molecular weight and such variations again can be simply unified at fixed T-Tg. The inset of Figure 7 was plotted to show approximately an iso-free volume state; however, it is not satisfactory for PPF1–7 although they differ much from the marginally entangled PPF8 and overlap together without a regular order.
Figure 7.

Monomeric friction coefficients from viscosity as a function of temperature. Inset: Monomeric friction coefficients from viscosity as a function of T-Tg.
Generally there are three major methods to obtain experimentally and two additional approaches based on chain dimension parameters.28 In this study, an experimental value of 0.65 MPa for can be roughly estimated from the master curves in Figure 2. Method v) in ref 28 was applied here to give a semi-empirical value of 0.5 MPa for using the dilute solution viscometry result of Kθ, in contrast with a larger value 1.1 MPa if group addition prediction result of Kθ is applied. Here the experimental value of 0.65 MPa is used for and consequently Me can be calculated to be 4900 g.mol−1 using ,16 where a value of 1.28 g.cm−3 is used for ρ and the temperature effect is omitted. Me can also be approximated from the critical molecular weight Mc in viscosity’s molecular weight dependence by the practical relation of Mc=2~3Me or an expression based on packing length p:27
| (11) |
As mentioned above, Figure 4 indeed shows a characteristic molecular weight Mc= 10,000 g.mol−1 at the intersection of lines with or without iso-friction correction. Therefore, Mc is close to the double of Me of 4900 g.mol−1, confirming the validity of eq 11 given p=2.16 Å as calculated above.
Once Me for PPF is estimated, the tube diameter a and contour length L in the reptation model can be obtained using29,30
| (12) |
Therefore, a is 48.0 Å and L is 9.8× 10 − 3M Å2 mol.g −1 for PPF.
The molecular weight dependence of Tg can be replotted as Tg/Tg∞ vs. Mw in Figure 8 and also vs. M/Me in Figure 8 and also vs M/Me in the inset of Figure 8. Six polymer species including PPF, PS,11,12 PDMS,10 methyl-substituted poly(aryl ether ether ketone) (MePEEK),31 1,4-PBD,14,30,32 and polyisobutylene (PIB)33 are plotted together, for which the entangled molecular weights25 are 4900, 18100, 12000, 1450, 2000, and 5686 g.mol−1, respectively. It can be observed in the inset of Figure 8 that for PS and 1,4-PBD, the critical molecular weight to reach an invariant Tg is close to Me. However, the critical molecular weights for PDMS and PIB are lower than their Mes while those for PPF and Me-PEEK are higher. Apparently Me is not a deciding parameter for the polymer glass transition. When the normalized Tg was plotted as a function of Mw directly, six polymer species can be divided into two groups. PPF, PS, and MePEEK (also PMMA34, not shown) are in the same group with a higher molecular weight to reach the asymptotic value of Tg, while PDMS, PIB, and 1,4-PBD are in another group. It is interesting to note that the former group has sterically-hindering pendant groups while the latter one is symmetric backbone. The correlation between the chain structure, intermolecular cooperativity, and fragility will be helpful to elucidate this phenomenon.35 Chains with less compact and unsymmetrical structure, rigid backbones, or sterically hindering pendent groups have stronger intermolecular cooperativity and larger fragility, which result in high Tg∞ and generally more sensitive molecular weight dependence of Tg.35 All the existing polymer species should be examined in the same way and not necessarily only two groups can be divided into because the chain rigidity can be even higher than the polymers in Figure 8, and the chain end mobility for different polymer species can be also different.35
Figure 8.

Normalized Tg for various polymer species as a function of molecular weight, and molecular weight reduced by Me in the inset.
In summary, to our best knowledge, for the first time we have extensively characterized PPF in terms of molecular weight dependence with 38 molecular weights obtained by the current synthesis and fractionation techniques. A variety of microscopic chain dimensions and macroscopic physical properties for both PPF melts and solutions have been given and correlated, which are informative for practical and theoretical purposes in both fields of biomaterials and polymer dynamics. The importance of understanding chain structure and physical properties in designing novel biomaterials for various tissue engineering applications has been also shown in our recent report36 of a multiblock copolymer polypropylene-co-polycaprolactone (PPF-co-PCL). Both terminal and segmental relaxations as well as zero-shear viscosity and Tg for PPF vary much with molecular weight in the molecular weight range studied here. The temperature dependence of viscosity for various molecular weights can be unified and expressed using the WLF equation when the temperature is normalized to Tg. The molecular weight dependence of Tg for six polymer species including PPF shows the little effect of Me. More interestingly, these six polymer species can be separated into two distinguishable groups when their normalized Tg is plotted simply against Mw to indicate the roles of chain fragility, intermolecular cooperativity, and chain end mobility. The infinite glass transition temperature (31.9 °C) for PPF is between the room temperature and body temperature. It implies that the fabrication of scaffolds for non-force-bearing goals using stronger, entangled PPF without crosslinking could speed up the in vivo biodegradation, while crosslinking is still required to make force-bearing scaffolds.
Supplementary Material
Tables of molecular weights and properties of all the PPF samples, and melt viscosity at various temperatures of eight PPF samples. This material is available free of charge via the Internet at http://pubs.acs.org.
Acknowledgments
This work was funded by the Mayo Foundation and National Institutes of Health (R01 AR45871 and R01 EB003060). We appreciate the technical assistance from James A. Gruetzmacher in our lab and Dr. Wei-sen Wong and Ali Soleymannezhad in Viscotek Corporation. SW thanks Professor Shi-Qing Wang at the University of Akron for suggestions on Figure 8.
References and Notes
- 1.Peter SJ, Miller MJ, Yaszemski MJ, Mikos AG. In: Handbook of Biodegradable Polymers. Domb AJ, Kost J, Wiseman D, editors. Harwood Academic Publishers; Amsterdam: 1997. and the references therein. [Google Scholar]
- 2.Yaszemski MJ, Payne RG, Hayes WC, Langer RS, Aufdemorte TB, Mikos AG. Tissue Eng. 1995;1:41. doi: 10.1089/ten.1995.1.41. [DOI] [PubMed] [Google Scholar]
- 3.Yaszemski MJ, Payne RG, Hayes WC, Langer RS, Mikos AG. Biomaterials. 1996;17:2127. doi: 10.1016/0142-9612(96)00008-7. [DOI] [PubMed] [Google Scholar]
- 4.Domb AJ, Manor N, Elmalak O. Biomaterials. 1996;17:411. doi: 10.1016/0142-9612(96)89657-8. [DOI] [PubMed] [Google Scholar]
- 5.He S, Yaszemski MJ, Yasko AW, Engel PS, Mikos AG. Polymer. 2001;42:1251. [Google Scholar]
- 6.Kharas GB, Kamenetsky M, Simantirakis J, Beinlich KC, Rizzo AMT, Caywood GA, Watson K. J Appl Polym Sci. 1997;66:1123. [Google Scholar]
- 7.Lide DR, editor. Handbook of Chemistry and Physics. 83. CRC Press; Boca Raton: 2002. [Google Scholar]
- 8.(a) Shung AK, Timmer MD, Jo S, Engel PS, Mikos AG. J Biomater Sci Polym Edn. 2002;13:95. doi: 10.1163/156856202753525963. [DOI] [PubMed] [Google Scholar]; (b) Fradet A, Arland P. In: Comprehensive Polymer Science, the Synthesis, Characterization, Reactions and Applications of Polymers. Allen G, Bevington JC, editors. Vol. 5. Pergamon Press; 1989. pp. 331–344. [Google Scholar]; (c) Ordelt Z. Makromol Chem. 1963;63:153. [Google Scholar]; (d) Fradet A, Marechal E. Makromol Chem. 1982;183:319. [Google Scholar]; (e) Paci M, Crescenzi V, Supino N. Makromol Chem. 1982;183:377. [Google Scholar]; (f) Judas D, Fradet A, Marechal E. Makromol Chem. 1984;185:2583. [Google Scholar]; (g) Bellenger V, Mortaigne B, Grenier-Loustalot MF, Verdu J. J Appl Polym Sci. 1992;44:643. [Google Scholar]; (h) Podzimek S, Hyrsl J. J Appl Polym Sci. 1994;55:1351. [Google Scholar]; (i) Yang YS, Pascault JP. J Appl Polym Sci. 1997;64:133. [Google Scholar]; (j) Huang YJ, Jiang WC. Polymer. 1998;39:6631. [Google Scholar]; (k) Piras A. PhD thesis. Université Pierre et Marie Curie (Paris VI); France: 1988. [Google Scholar]
- 9.(a) Boyer RF. Macromolecules. 1974;7:142. [Google Scholar]; (b) Cowie JMG. Eur Polym J. 1975;11:297. [Google Scholar]
- 10.Clarson SJ, Dodgson K, Semlyen JA. Polymer. 1985;26:930. [Google Scholar]
- 11.Minagawa M, Kanoh H, Tanno S, Nishimoto Y. Macromol Chem Phys. 2002;203:2475. [Google Scholar]
- 12.(a) Santangelo PG, Roland CM. Macromolecules. 1998;31:4581. [Google Scholar]; (b) Roland CM, Casalini R. J Chem Phys. 2003;119:1838. [Google Scholar]
- 13.Majeste JC, Monfort JPAIMA, Marin G. Rheol Acta. 1998;37:486. In this reference, they referred Fox and Loshaek’s expression of the density of PS: (FOX, T G; Loshaek, S. J. Polym. Sci 1955, 15, 371). Using this equation, one can calculate that the density of PS for M=500 g.mol−1 remains 96% of that for infinite molecular weight at the temperature of 300K, while Tg drops as much as 30%.
- 14.Colby RH, Fetters LJ, Graessley WW. Macromolecules. 1987;20:2226. [Google Scholar]
- 15.Liu G, Vancso GJJ. Appl Polym Sci. 1994;51:1991. [Google Scholar]
- 16.Ferry JD. Viscoelastic Properties of Polymers. 3. Wiley; New York: 1980. [Google Scholar]
- 17.Roland CM, Ngai KL. Macromolecules. 1992;25:5765. [Google Scholar]
- 18.Roland CM, Ngai KL. Macromolecules. 1996;29:5747. [Google Scholar]
- 19.Rizos AK, Ngai KL. Macromolecules. 1998;31:6217. [Google Scholar]
- 20.Cooke MN, Fisher JP, Dean D, Rimnac C, Mikos AGJ. Biomed Mater Res B Appl Biomater. 2002;64B:65. doi: 10.1002/jbm.b.10485. [DOI] [PubMed] [Google Scholar]
- 21.Rubinstein M, Colby RH. Polymer Physics. Oxford University Press; New York: 2003. [Google Scholar]
- 22.Wu SJ. Polym Sci B Polym Phys. 1989;27:723. [Google Scholar]
- 23.The mean-square radius of gyration for PPF with molecular weight M can be deduced from by .
- 24.van Krevelen DW. Properties of Polymers. 3. Elsevier; Amsterdam: 1990. [Google Scholar]
- 25.Fetters LJ, Lohse DJ, Richter D, Witten TA, Zirkel A. Macromolecules. 1994;27:4639. [Google Scholar]
- 26.Fetters LJ, Lohse DJ, Graessley WW. J Polym Sci B Polym Phys. 1999;37:1023. [Google Scholar]
- 27.Fetters LJ, Lohse DJ, Milner ST, Graessley WW. Macromolecules. 1999;32:6847. [Google Scholar]
- 28.i) (refs 16 and 25); ii) G* at loss minimum in the master curve; iii) crossover modulus Gc or terminal loss peak Gmax by using the empirical relations between and them: or (ref 22); iv) ( Wu S, Becherbauer R. Polymer. 1992;33:509.); and v) (ref 25).
- 29.Doi M, Edwards SF. The Theory of Polymer Dynamics. 2. Clarendon Press; Oxford, England: 1988. [Google Scholar]
- 30.Wang S, Wang SQ, Halasa A, Hsu WL. Macromolecules. 2003;36:5355. [Google Scholar]
- 31.Wang F, Roovers J, Toporowski PM. Macromolecules. 1993;26:3826. [Google Scholar]
- 32.Wang S, von Meerwall ED, Wang SQ, Halasa A, Hsu WL, Zhou JP, Quirk RP. Macromolecules. 2004;37:1641. [Google Scholar]
- 33.Kusy RP. J Polym Sci B Polym Phys. 1987;25:435. [Google Scholar]
- 34.Poly(methyl methacrylate) (PMMA) belongs to the group of PPF, PS, and MePEEK when the Tg’s molecular weight dependence ( Kusy RP, Greenberg AR. Polymer. 1984;25:600.Greenberg AR, Kusy RP. Polymer. 1984;25:927.) is plotted in Figure 8.
- 35.(a) Ngai KL, Roland CM. Macromolecules. 1993;26:6824. [Google Scholar]; (b) Miwa Y, Yamamoto K, Sakaguchi M, Sakai M, Makita S, Shimada S. Macromolecules. 2005;38:832. [Google Scholar]; (c) Dudowicz J, Freed KF, Douglas JF. J Phys Chem B. 2005;109:21285. doi: 10.1021/jp0523266. [DOI] [PubMed] [Google Scholar]
- 36.Wang S, Lu L, Gruetzmacher JA, Currier BL, Yaszemski MJ. Macromolecules. 2005;38:7358. [Google Scholar]
Associated Data
This section collects any data citations, data availability statements, or supplementary materials included in this article.
Supplementary Materials
Tables of molecular weights and properties of all the PPF samples, and melt viscosity at various temperatures of eight PPF samples. This material is available free of charge via the Internet at http://pubs.acs.org.