

Abstract
Investigation of the peptidome of the nervous system containing large, often easily identifiable neurons has greatly benefited from single cell matrix-assisted laser desorption/ionization (MALDI) mass spectrometry (MS) and has led to the discovery of hundreds of novel cell-to-cell signaling peptides. By combining new sample preparation methods and established protocols for bioanalytical mass spectrometry, a high throughput small-volume approach is created that allows the study of the peptidome of a variety of nervous systems. Specifically, approximately single-cell-sized samples are rapidly prepared from thin tissue slices by adhering the tissue section to a glass bead array that is anchored to a stretchable membrane. Stretching the membrane fragments the tissue slice into thousands of individual samples, their dimensions predominately governed by the size of the individual glass beads. Application of MALDI matrix, followed by the repeated condensation of liquid microdroplets on the fragmented tissue, allows for maximal analyte extraction and incorporation into MALDI matrix crystals. During extraction, analyte migration between the pieces of tissue on separate beads is prevented by the underlying hydrophobic substrate and by controlling the size of the condensation droplets. The procedure, while general in nature, may be tailored to the needs of a variety of analyses, producing mass spectra equivalent to those acquired from single cell samples.
INTRODUCTION
Matrix-assisted laser desorption/ionization (MALDI) mass spectrometry (MS), by enabling the direct measurement of a variety of analytes in a wide range of biological samples, has become a mainstream method in bioanalytical chemistry. This success is due, in part, to the unsurpassed capability of MALDI MS to analyze extremely complex and often very small specimens such as brain slices, single cells, and individual organelles. Sample preparation in such cases is relatively straightforward and consists of three steps: sample isolation, transfer onto a sample plate, and the application of a MALDI matrix solution.
An early application of MALDI MS was the analysis of individual, isolated nerves and cells.1 In the course of the past decade, single-cell and direct-tissue MALDI MS has become one of most effective tools in proteome and peptidome investigation. As result, numerous novel peptides have been discovered and identified in range of animals including invertebrates,2, 3 amphibians,4 and mammals.5 For instance, prohormone processing of a number of neuropeptide precursors has been successfully elucidated with this approach in several neurobiological models.3, 6 MALDI MS has been used to study post-translational modifications of peptides,7 measure the peptide profiles of subcellular structures such as neuronal processes,8 and assay the contents of single secretory vesicles.9
Single-cell MALDI MS has particular importance in the investigation of chemically heterogeneous biological systems such as the central nervous system in which many cells specialize in the synthesis of functionally specific, intercellular signaling molecules. These molecules, in the extreme case, may be found in only one or a few cells in an organism.7 Investigation of peptide profiles at the single cell level benefit from high local concentrations of analytes of interest, which would otherwise be difficult to detect due to the low average global concentrations within the tissue as a whole.
Profiling the peptide content of well-defined, single cell samples with MALDI MS allows a number of unique studies. However, it has been difficult to adapt single cell approaches to assaying large numbers of individual cells necessary for a comprehensive investigation of tissue slices or organs, particularly in more complex mammalian systems. Sample preparation for single cell MALDI MS requires considerable expertise and time, is often laborious, and can easily serve as the rate-determining step. Furthermore, it can be quite challenging to accurately record the initial location of isolated cells.
Several techniques have been developed to assist in the analysis of spatially defined, single cell-sized samples with MS, including laser capture microdissection (LCM) and mass spectrometric imaging (MSI).10–14 LCM utilizes a laser and a thermoplastic film to selectively dissect small tissue regions or single cells and has been applied in MALDI MS studies of epithelial cells from cancerous tissues15, 16 and mouse prostate.17 LCM sample isolation and treatment with MALDI matrix are also time-consuming, particularly when thousands of cells have to be analyzed. MSI presents an alternative method for high spatial resolution studies in that an orderly array of locations are interrogated across a sample to create a distribution map of the analyte(s) of interest.18 As a rapidly evolving technique,19–21 recent developments have enabled MSI to reach subcellular spatial resolutions for small molecular weight analytes.22, 23 Molecular ion images of mouse brain,13 human glioma xenografts,24 rat pituitary,25 and mouse epididymis26 have been obtained. Combining MALDI with MSI represents a very powerful tool for high throughput screening and the discovery of biochemical markers for a variety of diseases.27–29 Classic sample preparation methods for MALDI MSI require the application of a wet MALDI matrix solution onto a sample surface. This step allows for the extraction of analytes from the sample and their incorporation into MALDI crystals. Unfortunately, there is a compromise in this step between extraction efficiency and spatial resolution. Exposing the sample to MALDI matrix solution for longer periods of time may increase the amount of analyte extracted from the sample, thereby improving the sensitivity of the technique. However, it also requires a longer time interval during which soluble analytes may migrate farther from their positions of origin within the tissue; analyte redistribution may result in decreased spatial resolution and blurring of the final image.30 This is especially true for smaller, highly soluble neuropeptides, which can be particularly problematic in studies of highly heterogeneous neurological tissues.
Here, we present a technique for the massively parallel preparation of single-cell-sized samples from tissue sections. In this method, a thin tissue section is placed on an array of solid supports mechanically attached to an elastic, hydrophobic membrane. When the membrane is stretched, the tissue is rapidly divided into thousands of pieces, each the size of an individual solid support; this stretching process maintains the relative morphological organization of the intact tissue. Ideally, this results in each tissue piece being attached to an individual solid support and spatially isolated from adjacent pieces. Combining the stretched sample preparation technique with a novel matrix application and analyte extraction protocol permits maximal extraction of analytes while minimizing redistribution, which has not otherwise been reported. Using this approach, the high throughput analysis of signaling peptides in the central nervous system of Aplysia californica with MADLI MS was achieved via the automated acquisition of mass spectra from the separated tissue. These findings may have broad implications for sample preparation and analyses in bioanalytical MS.
EXPERIMENTAL
Substrate Preparation
Substrates for tissue fragmentation were prepared by placing several milligrams of ~38 μm diameter glass beads (Mo-Sci Corp., Rolla, MO) on a square of Parafilm M (Pechiney, Neenah, WI). The beads were then covered with a microscope slide and manually pressed into the Parafilm M layer resulting in a monolayer of beads that forms at bead densities of ~600–800 beads mm−2. Beads may also be patterned at this stage by the positioning of a mask such as an electron microscopy grid (Electron Microscopy Sciences, Hatfield, PA) onto the Parafilm M surface and pressing beads through the mask; arrays of beads, regularly spaced by hydrophobic regions, are formed following mask removal. Excess beads were blown away from the surface using a stream of nitrogen gas. The quality of surface coverage was verified by visual inspection under a dissection microscope (Leica Microsystems, Bannockburn, IL). In order to strengthen attachment of the beads to the Parafilm M, the substrate was placed between two glass slides and positioned between two heated (~60 °C) aluminum blocks for a period of 10–15 seconds. The substrates were then allowed to cool prior to removal of the glass slides. A rough measure of the quality of the mechanical contact between beads and the Parafilm M layer was then determined by dragging a pair of forceps across the bead surface under a dissecting microscope. Beads were considered to be adequately attached to the surface when no array disruption or movement was observed in the bead layer during this test; the individual beads are typically embedded into the Parafilm M layer such that approximately half of the bead is pressed into the Parafilm M.
Tissue Preparation
Aplysia californica (100–500 g) were obtained from Charles Hollahan (Santa Barbara, CA) and kept at 15 °C in an aquarium containing continuously circulating, aerated and filtered seawater prepared according to manufacturer instructions using Instant Ocean salts (Aquarium Systems Inc., Mentor, OH). Animals were anesthetized by the injection of isotonic MgCl2 (~30% to 50% of body wt.) into the body cavity. Both the abdominal ganglia and buccal muscles were dissected and placed in artificial sea water (ASW), containing (in mM) 460 NaCl, 10 KCl, 10 CaCl2, 22 MgCl2, 6 MgSO4, and 10 HEPES, pH 7.8.
For sectioning, surgically dissected ganglia were positioned and rapidly frozen with dry ice on a small piece of buccal muscle affixed to the stage of an HM 550 ultramicrotome (Microm International, Walldorf, Germany). The inclusion of the buccal muscle allows the mechanically stable mounting of small ganglia on the metal stage and eliminates the need for an embedding media (e.g., TissueTek), which can otherwise cause significant suppression of analyte signals acquired from biological samples.30, 31 Thin tissues slices (5–10 μ) were prepared at −20 °C and immediately placed on the previously prepared bead substrates.
The substrate was then stretched manually to fragment the tissue section attached to the array of glass beads. This action is readily reproducible and permits a 16-fold increase of the sample area before the Parafilm M membrane begins to tear. Unless otherwise noted, all samples were stretched to near the tearing point of the Parafilm M membrane. The application of a gentle stream of warm air (~36 °C) to the back of the substrate further aided the stretching process. Following stretching, the substrate is mounted on a glass coverslip to provide mechanical support.
MALDI Matrix Application and Analyte Extraction
Using a commercial airbrush (Badger, Franklin Park, IL), stretched samples were coated with a thin layer of MALDI matrix. The airbrush nozzle was positioned at a distance of ~15 cm from the sample surface and a solution containing 30 mg/mL α-cyano-4-hydroxycinnamic acid (CHCA), or 2,5-dihydroxybenzoic acid (DHB) (both from Sigma-Aldrich, St. Louis, MO), in an 80:20 acetone:water mixture was sprayed onto the sample with multiple passes for ~2 min. In this method of matrix application, it is desirable that the amount of solvent reaching the sample surface be minimized in order to prevent any analyte migration between the separated pieces of tissue section.
To promote analyte extraction and optimize MALDI matrix crystallization, the stretched tissue sections were placed into a homemade, humidity-controlled environmental chamber equipped with a system that enabled adjustment of the sample temperature. This system consisted of a Peltier device (Melcor, Trenton, NJ), a thermocouple connected to a CN77000 temperature controller (Omega, Stamford, CT), and a DC power supply. The relative humidity within the chamber was increased to 85–95% and the samples, placed on top of the Peltier device, were cooled to a temperature below the dew point of water for ~60 sec. Liquid condensation on the islands of tissue pieces adhering to the ~38 μm diameter glass beads was monitored in real time with a CCD camera (DFW-X700, Sony, Tokyo, Japan) attached to a 7× zoom microscope (Edmund Optics, Barrington, NJ). Once the condensation droplets reached a diameter roughly the size of the individual beads, the Peltier device was switched off and allowed to return to ambient temperature while the liquid slowly evaporated from the sample over the course of several min. In some instances, this cooling process was repeated three times in order to increase analyte extraction and optimize the formation of MALDI matrix crystals.
Mass Spectrometry
MALDI mass spectra were acquired using a Voyager DE STR time-of-flight mass spectrometer (Applied Biosystems, Foster City, CA) equipped with delayed ion extraction and a pulsed nitrogen laser (337 nm). The instrument was operated in linear mode with an accelerating voltage of 20 kV. Positively charged ions were detected. Each unsmoothed mass spectrum was the average of 50–400 laser pulses generated at 3 Hz. The size of the laser footprint was determined by measuring the area of a thin layer of CHCA completely ablated by laser irradiation—approximately 100 μ × 200 μm. All mass spectra were calibrated externally.
In the majority of experiments described in this work, the mass spectrometer was operated in the automated autosampler mode. Customization of the search patterns available within the Voyager Biospectrometry Workstation software permits the examination of specific locations of the sample as obtained by the automated identification of beads using the public domain NIH ImageJ program, version 1.36 (developed at the U.S. National Institutes of Health and available on the Internet at http://rsb.info.nih.gov/nih-image/) or selected areas consisting of regularly spaced spots arranged in a rectangular array. External calibration was applied to each spectrum within the acquisition area.
Following automated data acquisition, mass spectra were calibrated and peak lists were formed for each mass spectrum using Visual Basic (VB) macros written in house. A peak list and arbitrary intensity pairs were created for each point within the raster pattern. This information and another VB macro were used to form data arrays of abundance versus position for each peak of interest. These arrays were imported into Sigma Plot (version 6, Systat Software, Inc., Point Richmond, CA), or analysis was performed on a computer using ImageJ to create false color ion images. Additionally, some mass spectra from individual positions within the sample area were analyzed using the Voyager Data Explorer software.
RESULTS AND DISCUSSION
The overall goal of this investigation is to create a method to rapidly, simply, and simultaneously separate a tissue section into thousands of distinct, single-cell-sized pieces, enabling MALDI MS assay of each individual piece to produce the chemical information output inherent to single cell MS analysis. The individual steps required to accomplish this involve preparing tissue sections, fragmenting them into small pieces, applying matrix, extracting analyte, and acquiring mass spectra. Each of these individual steps is described below.
Tissue Section Stretching
In principle, one of the best ways to separate a tissue section into many single cell-sized pieces is to apply destructive forces within the section. For high throughput sampling, these forces should be developed simultaneously and with enough uniformity that the separation is consistent across the tissue section. We introduce an approach called the “stretched sample method” in which these forces are created by the mechanical stretching of an underlying substrate consisting of an array of solid supports attached to an elastic, hydrophobic membrane (Figure 1). The solid supports perform several important roles during this process. They anchor the pieces of the divided tissue to the surface of the Parafilm M substrate, mechanically stabilize the attached pieces, and direct the separating forces developing during manual stretching. As result of this stretched sample method, the tissue section may be rapidly segmented into approximately solid-support-sized samples that are spatially separated. While the procedure is general, it can be tailored to the specific needs of a variety of analyses.
Figure 1.

Schematic of the massively parallel sample preparation using the stretched sample method. (A, B) Pressure and heat are used to form a layer of glass beads on a Parafilm M membrane surface. (C) A thin tissue slice is placed onto the glass bead layer. (D) The Parafilm M membrane is manually stretched. As a result, the tissue slice is fragmented into thousands of spatially isolated pieces. (E) After MALDI matrix application, individual pieces of tissue may then be investigated with MALDI MS.
Here, uniform glass beads are used to provide the solid supports, although solid phase extraction or other chromatography beads can also be employed. Glass beads were selected due to their mechanical stability and the nonporous, hydrophilic nature of the glass surface, well-known for its ability to establish and maintain good mechanical contact with biological tissues. Parafilm M is an excellent choice for the supporting membrane due to its hydrophobic nature and its ability to stretch four-fold along each axis (for a 16-fold increase in area) without breaking, as well as its compatibility with the MALDI MS process.
The success of tissue section fragmentation using the stretched sample method depends on the relative strength of the contact between the glass beads and Parafilm M, the glass beads and the tissue, and the mechanical stability of the tissue slices, which may vary from tissue-to-tissue, and even within a single slice. In fact, the nature and thickness of the tissue slices is found to be as important as the increased internal mechanical stability; in thicker slices (>15–20 μm), the presence of highly filamentous connective tissues result in poor tissue-slice fragmentation. These problems may, however, be overcome by using thinner sections and improving attachment of the tissue to the substrate. By using glass supports to which biological tissues readily adhere, and then gently pressing the slices onto the bead substrates prior to stretching, defects during stretching are significantly reduced. Additionally, stretching the tissue section immediately after deposition onto the substrate surface provides more uniform fragmentation than the stretching of deposited and dried tissue sections (data not shown). As a result of the optimization of these parameters, remarkably consistent fragmentation of thin tissue slices is achieved with the stretched sample method (Figure 2). A field of spatially separated individual tissue pieces attached to glass beads is formed (Figure 2C) with relatively few beads (<1%) forming small, two–three bead clusters. Stretching produces a field of isolated samples in the same relative position to each other, and because the expansion is roughly linear, this allows the location of individual positions in the stretched sample to be registered to their approximate location in the native tissue.
Figure 2.

Tissue sectioning, deposition on the substrate, and stretching. (A) Photograph of the internal space of the cryotome used for tissue sectioning. The frozen abdominal ganglion is positioned on a piece of buccal muscle attached to a metal stage, which is visible in the upper left corner. A prepared substrate and deposited section of abdominal ganglion is located centrally. (B) Microphotograph of an abdominal ganglion section deposited on a glass slide. Cytoplasm and nuclear regions of neurons are visible. (C) Microphotograph of an abdominal ganglion section deposited onto glass bead layer (orange region in the center of view). (D) Following stretching and matrix application, the tissue is largely fragmented into individual bead-sized pieces.
MALDI Matrix Application and Analyte Extraction
MALDI matrix application protocols are adapted from previously reported MSI methods.31 Stretched substrates are attached to a glass coverslip and coated with MALDI matrix using an airbrush. Visual observations support the impression that the MALDI matrix is essentially dry upon impact with the surface, as the matrix appears to amorphous in nature rather than crystalline. Following MALDI matrix application, the specimen is placed into the environmental chamber and analyte extraction is enhanced by simultaneous hydration of the individual tissue pieces, achieved by controlled condensation of solvent on the cooled surface (Figure 3). This procedure results in the formation of small water droplets surrounding individual tissue fragments. The size of the droplets generated by the condensation process is monitored visually and controlled by adjusting sample temperature and relative humidity within the chamber. With multiple iterations of the condensation procedure, it is possible to extract analyte from the tissue for extended periods of time (>15 min), enhancing the MS signal and aiding the formation of large MALDI matrix crystals. The underlying Parafilm M membrane prevents the formation of liquid connections between beads and promotes the contraction of droplets towards the hydrophilic beads during drying, thereby reducing the possiblity of analyte redistribution between different areas of specimen. This is confirmed via real-time visual monitoring of the solvent condensation and drying processes. As a result, it is possible to repeat the condensation/drying cycle multiple times without analyte redistribution which, in turn, enables extended periods of analyte extraction that would not have otherwise been possible. Additionally, the condensation/drying procedure allows the sample to be exposed to different compounds that may be added into the gas phase and condensed onto the sample.
Figure 3.
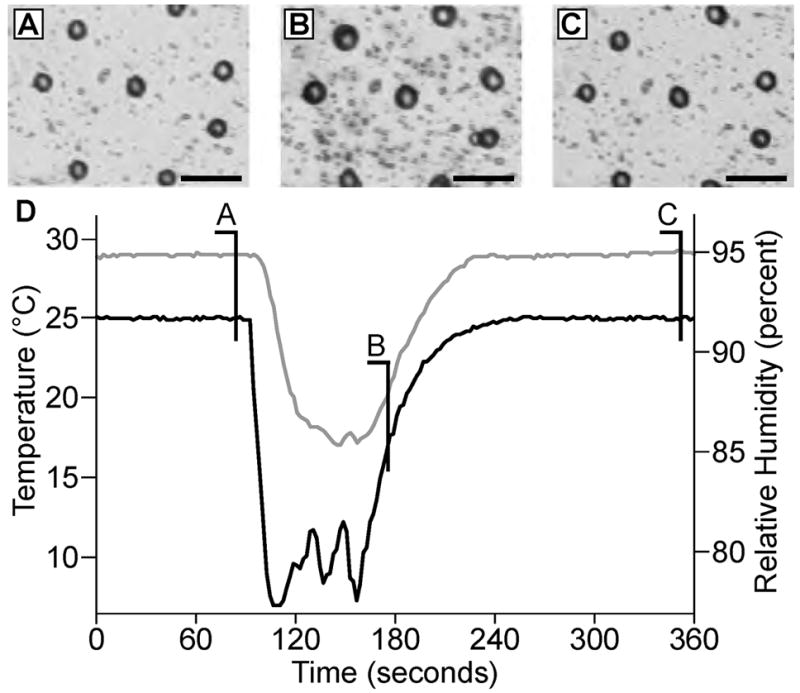
MALDI matrix application/analyte extraction procedures. (A) Microphotographs of a glass bead layer after Parafilm M stretching and DHB application. (B) In order to increase sensitivity and promote analyte extraction from the tissue, the sample is cooled in a humid atmosphere to form small droplets on the glass bead surface. (C) The sample is then allowed to dry over a period of several minutes. (D) Time course of sample temperature (bottom, black line) and humidity (upper, gray line) changes within the sample chamber. (Scalebars = 100 μm.)
To observe the extent of any analyte redistribution that occurs during the condensation step of sample preparation, Parafilm M substrates containing beads with 50-μm wide strips of devoid of beads are prepared using an electron microscopy grid to pattern the surface. A peptide mixture is applied to the regions covered with beads and allowed to dry prior to stretching the substrate and applying the MALDI matrix. Chemical images from a sample prepared in this manner are presented in Figure 4. A background signal at m/z 1204 that arises from the Parafilm M surface coated with MALDI matrix (present in controls without beads or tissue) is detected uniformly across the examined area (Figure 4A). In contrast, a peptide signal is specifically localized to the sample regions loaded with the peptide-coated beads, signifying the absence of detectable analyte redistribution (Figure 4B). The ion images presented in Figure 4 have a spatial resolution of 100 μm as determined by the raster step size used during data acquisition; thus, no clear spacing between the individual 38-μm beads is observed. However, no peptide signal is detected between the areas hosting the glass beads, indicating that analyte redistribution is restricted in this preparation.
Figure 4.
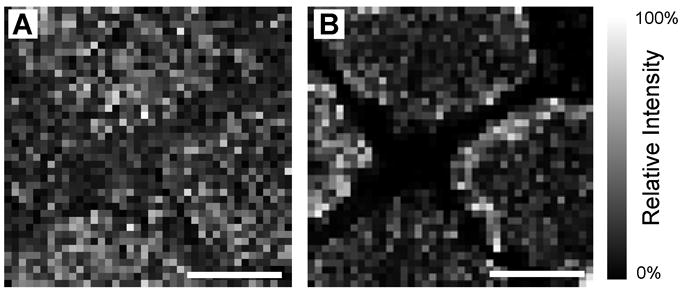
Analyte migration between individual glass beads is restricted by Parafilm M hydrophobic surface. (A) Ion image of background signal (m/z 1204) shows a largely uniform signal intensity distribution across the patterned sample while (B) angiotensin I (m/z 1296) is confined to the region of the stretched substrate which contains beads. (Scalebars = 1 mm.)
MS Investigation of Stretched Tissue Sections
Figure 5 presents a set of representative mass spectra acquired from a 10-μm thick slice of an abdominal ganglion from Aplysia californica prepared with the stretched sample method. A combination of optical and MALDI MS analyses of the sample reveals that each tissue section piece attached to a glass bead contains physiologically relevant peptides. Following stretching, the outline of the original tissue slice is still visible, enabling the border of the tissue section to be noted and marked prior to analysis. Several distinct peptide profiles are detected from different regions of the abdominal ganglion, illustrating the heterogeneity inherent to the nervous system. Specifically, signals attributed to peptides from the R15 neuron, R3–14 neurons, and bag cells are detected within a 3 mm × 3 mm region of stretched sample, corresponding to an approximately 750 μm × 750 μm area of the unstretched tissue. A striking example of sample heterogeneity is presented in the mass spectra obtained from two locations that are initially immediately adjacent to one another, yet present the different peptide profiles shown in Figure 5 C, D. The separation of the tissue section into a large number of small pieces allows for the high throughput detection of different peptide profiles from adjacent tissue regions and cells that might not otherwise be observed in the unstretched sample. Additionally, the insets presented in Figure 5 show the nearly complete absence of salt adducts. The reasons behind this observation are currently under investigation.
Figure 5.

Representative mass spectra (A–E) from a 10-μm thick abdominal ganglion section, prepared using the stretched sample method, demonstrate a wide variation in the peptide content of neurons within a ~750 μm × 750 μm region of ganglion. Microphotograph of the section after stretching is shown in the top center part of this figure with mass spectra linked to the corresponding bead from which the signal arises. (Scalebar = 1 mm.)
The mass spectra acquired from the stretched abdominal ganglion section from Aplysia are remarkably similar to those previously obtained from single cells isolated from the abdominal ganglia of other animals. This illustrates the applicability of the presented method to the high throughput preparation of single-cell-sized samples from tissue sections. In this example, individual cells in the tissue slice are, on average, slightly larger than the individual glass beads. As a result, the tissue is divided into approximately single-cell-sized pieces. Similar results are feasible for fragmentation of sections of tissues and organs from different biological sources as long as glass beads with a diameter similar to the average cell size are used.
Spatial Resolution with the Stretched Sample Approach
Prolonged hydration of biological samples treated with MALDI matrix solution is expected to cause significant redistribution of soluble analytes. The stretched sample method utilizes a hydrophobic Parafilm M substrate to restrict the formation of liquid connections between glass beads with attached tissue pieces. This results in the confinement of analytes to the small region occupied by the bead (Figure 6). As could be expected, a mass spectrum collected from the bead/tissue area shows numerous peptide signals. In contrast, mass spectra acquired 75 μm from the bead center present only chemical noise.
Figure 6.

A microphotograph showing three areas of the Parafilm M surface where mass spectra were acquired, with only the middle region having an individual glass bead with attached tissue piece; the top and bottom adjacent areas are devoid of the beads. On the right are the resulting mass spectra from each region; peptides are only detected in the region with the bead. (Scalebar = 25 μm.)
CONCLUSION
The stretched sample method enables the high throughput MALDI MS analysis of sections of tissues and organs with spatial resolutions similar to the size of the cells composing the biological structures under investigation prepared in a rapid manner as compared to other single cell isolation approaches. The method is based on the capability of a tissue section to adhere to the surface of a glass bead array formed on Parafilm M membrane. By stretching the membrane, the deposited tissue section fragments into small pieces, similar in size to the individual glass beads. As a result, the individual hydrophilic glass beads/tissue pieces are physically and chemically separated by the hydrophobic surface of the Parafilm M membrane, allowing for the simultaneous and individual treatment of each tissue piece with MALDI matrix in preparation for analysis using MALDI MS. Using in silico particle recognition using optical images to produce a map of bead positions in the stretched sample the automated analysis of literally thousands of individual, single cell-sized samples is possible. Additionally, this method can be adapted for mass spectrometric imaging by developing an algorithm to reconstruct the bead paths during the relatively linear stretching process and could be further aided by the use of a patterned substrate. The stretched sample method creates new opportunities for mass spectrometric investigations of morphologically and biochemically complex biological tissues, particularly when only a small number of cells express a unique set of physiologically active compounds such as neuropeptides.
Acknowledgments
This material is based upon work supported by the NIH, through award number P30DA018310 to the UIUC Center on Neuroproteomics on Cell to Cell Signaling, and a NIAAA NRSA training grant to J.C.J. (1F32AA014459); the assistance of Marika O. Christie is gratefully acknowledged.
References
- 1.van Veelen PA, Jimenez CR, Li KW, Wildering WC, Gerearts WP, Tjaden UR, van der Greef J. Organic Mass Spectrom. 1993;28:1542–1546. [Google Scholar]
- 2.Jimenez CR, van Veelen PA, Li KW, Wildering WC, Gerearts WP, Tjaden UR, van der Greef J. J Neurochem. 1994;62:404–407. doi: 10.1046/j.1471-4159.1994.62010404.x. [DOI] [PubMed] [Google Scholar]
- 3.Garden RW, Shippy SA, Li L, Moroz TP, Sweedler JV. Proc Natl Acad Sci USA. 1998;95:3972–3977. doi: 10.1073/pnas.95.7.3972. [DOI] [PMC free article] [PubMed] [Google Scholar]
- 4.van Strien FJ, Jespersen S, van der Greef J, Jenks BG, Roubos EW. FEBS Lett. 1996;379:165–170. doi: 10.1016/0014-5793(95)01503-5. [DOI] [PubMed] [Google Scholar]
- 5.Sweedler JV, Rubakhin SS, Churchill JD, Greenough WT. Program No. 326.162003. 2003 Abstract Viewer and Itinerary Planner. Washington, DC: Society for Neuroscience; 2003. Online. [Google Scholar]
- 6.Neupert S, Predel R. Biochem Biophys Res Commun. 2005;327:640–645. doi: 10.1016/j.bbrc.2004.12.086. [DOI] [PubMed] [Google Scholar]
- 7.Garden RW, Moroz TP, Gleeson JM, Floyd PD, Li L, Rubakhin SS, Sweedler JV. J Neurochem. 1999;72:676–681. doi: 10.1046/j.1471-4159.1999.0720676.x. [DOI] [PubMed] [Google Scholar]
- 8.Rubakhin SS, Greenough WT, Sweedler JV. Anal Chem. 2003;75:5374–5380. doi: 10.1021/ac034498+. [DOI] [PubMed] [Google Scholar]
- 9.Rubakhin SS, Garden RW, Fuller RR, Sweedler JV. Nat Biotechnol. 2000;18:172–175. doi: 10.1038/72622. [DOI] [PubMed] [Google Scholar]
- 10.Iancu TC, Perl DP, Sternlieb I, Lerner A, Leshinsky E, Kolodny EH, Hsu A, Good PF. BioMetals. 1996;9:57–65. doi: 10.1007/BF00188091. [DOI] [PubMed] [Google Scholar]
- 11.Iancu TC, Shiloh H, Raja KB, Simpson RJ, Peters TJ, Perl DP, Hsu A, Good PF. J Pathol. 1995;177:83–94. doi: 10.1002/path.1711770113. [DOI] [PubMed] [Google Scholar]
- 12.Rubakhin SS, Jurchen JC, Monroe EB, Sweedler JV. Drug Discov Today. 2005;10:823–837. doi: 10.1016/S1359-6446(05)03458-6. [DOI] [PubMed] [Google Scholar]
- 13.Stoeckli M, Chaurand P, Hallahan DE, Caprioli RM. Nat Med. 2001;7:493–496. doi: 10.1038/86573. [DOI] [PubMed] [Google Scholar]
- 14.Spengler B, Hubert M, Kaufmann R. Proceedings of the 42nd ASMS Conference on Mass Spectrometry and Allied Topics; Chicago, IL. 1994. [Google Scholar]
- 15.Palmer-Toy DE, Sarracino DA, Sgroi D, LeVangie R, Leopold PE. Clin Chem. 2000;46:1513–1516. [PubMed] [Google Scholar]
- 16.Xu BJ, Caprioli RM, Sanders ME, Jensen RA. J Am Soc Mass Spectrom. 2002;13:1292–1297. doi: 10.1016/S1044-0305(02)00644-X. [DOI] [PubMed] [Google Scholar]
- 17.Todd PJ, Schaaff TG, Chaurand P, Caprioli RM. J Mass Spectrom. 2001;36:355–369. doi: 10.1002/jms.153. [DOI] [PubMed] [Google Scholar]
- 18.Stoeckli M, Farmer TB, Caprioli RM. J Am Soc Mass Spectrom. 1999;10:67–71. doi: 10.1016/S1044-0305(98)00126-3. [DOI] [PubMed] [Google Scholar]
- 19.Crecelius AC, Cornett DS, Caprioli RM, Williams B, Dawant BM, Bodenheimer B. J Am Soc Mass Spectrom. 2005;16:1093–1099. doi: 10.1016/j.jasms.2005.02.026. [DOI] [PubMed] [Google Scholar]
- 20.Jurchen JC, Rubakhin SS, Sweedler JV. J Am Soc Mass Spectrom. 2005;16:1654–1659. doi: 10.1016/j.jasms.2005.06.006. [DOI] [PubMed] [Google Scholar]
- 21.Luxembourg SL, McDonnell LA, Mize TH, Heeren RM. J Proteome Res. 2005;4:671–673. doi: 10.1021/pr049762+. [DOI] [PubMed] [Google Scholar]
- 22.Altelaar AF, van Minnen J, Jimenez CR, Heeren RM, Piersma SR. Anal Chem. 2005;77:735–741. doi: 10.1021/ac048329g. [DOI] [PubMed] [Google Scholar]
- 23.McDonnell LA, Piersma SR, MaartenAltelaar AF, Mize TH, Luxembourg SL, Verhaert PD, van Minnen J, Heeren RM. J Mass Spectrom. 2005;40:160–168. doi: 10.1002/jms.735. [DOI] [PubMed] [Google Scholar]
- 24.Chaurand P, Sanders ME, Jensen RA, Caprioli RM. Am J Path. 2004;165:1057–1068. doi: 10.1016/S0002-9440(10)63367-6. [DOI] [PMC free article] [PubMed] [Google Scholar]
- 25.Caprioli RM, Farmer TB, Gile J. Anal Chem. 1997;69:4751–4760. doi: 10.1021/ac970888i. [DOI] [PubMed] [Google Scholar]
- 26.Chaurand P, Fouchecourt S, DaGue BB, Xu BJ, Reyzer ML, Orgebin-Crist MC, Caprioli RM. Proteomics. 2003;3:2221–2239. doi: 10.1002/pmic.200300474. [DOI] [PubMed] [Google Scholar]
- 27.Maddalo G, Petrucci F, Iezzi M, Pannellini T, Del Boccio P, Ciavardelli D, Biroccio A, Forli F, Di Ilio C, Ballone E, Urbani A, Federici G. Clin Chim Acta. 2005;357:210–218. doi: 10.1016/j.cccn.2005.03.029. [DOI] [PubMed] [Google Scholar]
- 28.Pierson J, Norris JL, Aerni HR, Svenningsson P, Caprioli RM, Andren PE. J Proteome Res. 2004;3:289–295. doi: 10.1021/pr0499747. [DOI] [PubMed] [Google Scholar]
- 29.Stoeckli M, Staab D, Staufenbiel M, Wiederhold KH, Signor L. Anal Biochem. 2002;311:33–39. doi: 10.1016/s0003-2697(02)00386-x. [DOI] [PubMed] [Google Scholar]
- 30.Kruse R, Sweedler JV. J Am Soc Mass Spectrom. 2003;14:752–759. doi: 10.1016/S1044-0305(03)00288-5. [DOI] [PubMed] [Google Scholar]
- 31.Schwartz SA, Reyzer ML, Caprioli RM. J Mass Spectrom. 2003;38:699–708. doi: 10.1002/jms.505. [DOI] [PubMed] [Google Scholar]