

Abstract
Objective
To determine whether mothers' fruit and vegetable intake and mothers' use of pressure in the feeding domain when their daughters were 7 years old predicted picky eating and dietary intake when their daughters were 9 years old, and to examine diet and weight status in picky and nonpicky eaters.
Design/Subjects
Participants were 173 9-year-old non-Hispanic white girls and their mothers. A longitudinal analysis was used to assess maternal influences on picky eating and diet. A cross-sectional analysis was used to examine diet and weight status between picky and non-picky eaters. Measures included maternal feeding practices, daughters' pickiness, mothers' fruit and vegetable intake, daughters' food intake, and weight status.
Statistical Analyses
t tests examined differences between picky and nonpicky eaters. Structural equation modeling examined relationships among mothers' fruit and vegetable intake; child feeding practices; daughters' pickiness; and fruit, vegetable, micronutrient, and fiber intakes.
Results
Mothers consuming more fruits and vegetables were less likely to pressure their daughters to eat and had daughters who were less picky and consumed more fruits and vegetables. Picky eaters consumed fewer fruits and vegetables, but also fewer fats and sweets. All girls consumed low amounts of vitamin E, calcium, and magnesium, but more picky girls were at risk for not meeting recommendations for vitamins E and C and also consumed significantly less fiber. In addition, picky eaters were less likely to be overweight.
Conclusions
Mothers influenced daughters' fruit and vegetable intake via their own patterns of fruit and vegetable intake and by influencing their daughters' tendencies to be picky eaters. Both picky and nonpicky eaters had aspects of their diets that did not meet recommendations. Taken together, these findings suggest that parents should focus less on “picky eating” behavior and more on modeling fruit and vegetable consumption for their children.
Parents are concerned about children's picky eating (1,2) and associated problems such as low fruit and vegetable intake. Although parental concerns about children's picky eating are common, picky eating has not been systematically studied. Definitions of picky eating vary and have sometimes focused on the consumption of a limited variety of foods (3-5), whereas at other times have included things related to the amount of food consumed (6). In this study we characterized the picky eater as a child who consumes an inadequate variety of food.
Although research on picky eating is limited, recent findings indicate that prior food experience plays a role in picky eating. In a recent study, mothers who breastfed their daughters at least 6 months and consumed more vegetables were less likely to have daughters who were picky eaters (7). Fisher and colleagues (8) showed that parents who ate fewer fruits and vegetables were more likely to use pressure or coercion to increase food intake. However, children who were pressured to “eat their vegetables” actually consumed fewer fruits and vegetables. Both the use of pressure as a feeding strategy and picky eating predict lower vegetable consumption (7,8).
Parents also are more likely to pressure a child to eat if they perceive the child to be underweight (9). According to Marchi and Cohen (10), picky eating in early childhood was associated with anorexia nervosa in adolescent girls. Although there are several reports that deal with relationships between pickiness and underweight or energy intake (6,11), the relationships among picky eating, the use of pressure as a child-feeding strategy, and weight status are not well understood. Because low fruit and vegetable consumption has been linked to increased consumption of fats (12), it is possible that picky eaters, who eat fewer fruits and vegetables, are consuming diets higher in fat and energy that may place them at risk for childhood overweight (13).
The aim of this research was to examine predictors of picky eating (including mothers' child-feeding practices, especially pressuring the child to eat), to evaluate picky eating as a predictor of dietary intake patterns, and to investigate possible links between picky eating and girls' weight status.
METHODS
Participants
Participants were from central Pennsylvania and were part of a longitudinal study of the health and development of young girls. There were 192 girls who participated in the study at 7 years of age and 183 girls who participated again when they were age 9. Reasons for attrition included the following: family moved from the area, was no longer interested in participating, or failed to attend data collection session. Complete data were collected from 173 non-Hispanic white girls and their mothers when girls were 7 and 9 years old. Eligibility criteria for girls' participation at the beginning of the study included living with both biological parents, the absence of severe food allergies or chronic medical problems affecting food intake, and the absence of dietary restrictions involving animal products. Families were recruited for participation in the longitudinal study using flyers, newspaper advertisements, and letters of invitation.
Girls and their parents visited the laboratory in the summer. Trained staff interviewed the girls individually, and mothers completed a series of self-report questionnaires.
The study protocol was approved by the Institutional Review Board at The Pennsylvania State University. Parents provided written consent for their daughter's participation in the study.
Design
A longitudinal analysis was used to assess maternal influences on picky eating and diet. A cross-sectional analysis was used to examine diet and weight status between picky and nonpicky eaters.
MEASURES
Maternal pressure to eat more and mothers' dietary intake were measured when girls were 7 years old (7.3±0.3). Daughters' picky eating, daughters' dietary intake, weight status, and body composition were assessed when they were 9 years old (9.3±0.3). Data obtained when the girls were 7 years old were predictors in the model; data from the girls at age 9 were used for outcome measures in the model and for assessing differences between picky and nonpicky eaters.
Daughters' Picky Eating
Daughters' picky eating was assessed when they were 9 years old. Picky eating (three items) is a subscale of the Child Feeding Questionnaire (14). This subscale measures mothers' reports of how they perceive their child's willingness to eat during mealtimes and included three items: (a) my child's diet consists of only a few foods, (b) my child is unwilling to eat many of the foods that our family eats at mealtimes, and (c) my child is fussy or picky about what she eats. High mean scores on the picky eating subscale represent higher levels of picky eating. The internal consistency of items on this subscale was α=.85.
Maternal Pressure to Eat
Maternal pressure to eat was measured when girls were 7 years old. Mothers' use of pressure to encourage their daughters to eat was measured using the pressure-to-eat subscale from the Child Feeding Questionnaire referred to earlier. The pressure-to-eat subscale (four items) measures the extent to which mothers pressure their daughters to consume foods. All items were rated using a 5-point Likert-type scale; responses ranged from disagree to agree. Items were: (a) my child should always eat all of the food on her plate; (b) I have to be especially careful to make sure my child eats enough; (c) if my child says “I'm not hungry,” I try to get her to eat anyway; and (d) if I did not guide or regulate my child's eating, she would eat much less than she should. Cronbach α=.73.
Dietary Intake of Mothers and Daughters
Food Frequency Questionnaire (FFQ)
This questionnaire was completed by mothers only when daughters were 7 years old. The FFQ was developed to measure the usual dietary intake of free-living individuals (15,16). The Kristal FFQ is quantitative and asks both frequency and usual amount consumed from an extensive list of foods. We created the within–food group frequency and variety scores for fruit and vegetable food groups. The within–food group frequency score was based on the frequency of within–food group consumption during a 3-month period. The within–food group variety score was defined as the number of different foods consumed within a particular food group over a 3-month period.
24-Hour Dietary Recall
With the assistance of the Pennsylvania State University Diet Assessment Center, we collected dietary information from the mothers when girls were 7 years old and from the girls at age 9 by administering three 24-hour food recalls, two on weekdays and one on a weekend day, randomly selected within a 2-week period. During each multiple-pass recall, mothers helped their daughters report food intake from the previous day. Participants were aware of the general time during which these calls would be made, but not of the exact time or date. For the mothers and daughters, 3-day food group intake (including vegetables, fruit, dairy, meat, grain, fats, and sweets), as well as nutrient, fiber, and energy intakes were estimated using a computer-assisted Nutrition Data System for Research (Nutrient Database version 12A, Food Database version 4.02_31, release date 2001, Nutrition Coordinating Center, University of Minnesota, Minneapolis). Food portion posters (2D Food Portion Visual, Nutrition Consulting Enterprises, Framing-ham, MA) were used to assist in the estimation of food amounts.
The total energy, macronutrient, micronutrient, and fiber values were assessed using dietary reference intakes (DRIs) (17-21). Girls' intakes at age 9 were compared with the Recommended Dietary Allowances (RDAs) (18-21) for 9- to 13-year-old girls. For calcium, mean intakes were compared with Adequate Intake (AI) recommendations (21). The prevalence of inadequate nutrient intakes was determined using the Estimated Average Requirement (EAR) cutpoint method (22) for nutrients with an established EAR. Nutrient intake estimates were based on foods consumed and do not include intake from supplements. The size of food servings was based on US Department of Agriculture (USDA) Food Guide Pyramid guidelines for the appropriate age group (22). The mean of the following micronutrients were used to provide a single micronutrient score that was used in the structural equation model: calcium; iron; folate; vitamins A, C, E, and B-6; magnesium; and zinc.
The sum weight of all foods consumed was calculated, including those contained in mixed dishes. Nutrition Data System summary file data containing each food consumed were edited to conduct food group analyses (23). Editing involved summing ingredient gram weights into a single whole-food weight that was assigned to food groups according to the Food Guide Pyramid. The number of servings was calculated from gram weights of whole foods consumed and was based on closely matched serving sizes used by the Food Guide Pyramid (22). One summary variable was created to represent combined fruit and vegetable intake for girls.
Weight Status and Body Composition
Body mass index
At age 9, girls' heights and weights were measured in triplicate by a trained staff member following procedures described by Gordon and colleagues (24). Body mass index (BMI) scores were generated based on height and weight measurements (calculated as kg/m2). Three height and weight measurements were collected for mothers and fathers when girls were 9 years old, and were used to calculate parents' BMIs. Girls' BMI values were converted to BMI percentiles using the Centers for Disease Control and Prevention's 2000 Growth Charts, and girls were classified as overweight if their BMI percentile was more than 85 and obese if their BMI percentile was more than 95 (25).
Dual-energy X-ray Absorptiometry
Girls' body compositions, including body fat percentage, were assessed at age 9 using dual-energy x-ray absorptiometry. Whole-body scans were obtained using the Hologic QDR 4500W (S/N 47261) (Hologic, Inc, Bedford, MA) in the array scan mode. Scans were then analyzed using whole-body software, QDR4500 Whole Body Analysis (Hologic, Inc).
Statistical Analyses
We used complete data from 173 cases and calculated descriptive statistics for all variables used in the model and subsequent analyses. The maternal pressure-to-eat data were skewed, therefore we normalized using a log transformation. Due to skewed results, we used a median split of the pickiness data when t tests were calculated. Data from the FFQ and 24-hour recall were used to create a single variable to represent frequency of maternal consumption of fruits and vegetables and variety using principal components analysis. Similarly, we used principal components analysis to create a single fruit and vegetable intake variable for girls. We used χ2 to assess differences in the proportion of picky and nonpicky eaters who did not meet recommendations for specified nutrients and the proportion of girls who were at risk for overweight.
Structural equation modeling software, Amos 4 (SPSS, Inc, Chicago, IL) (26), assessed a model that represented relationships among various predictors of picky eating and fruit and vegetable intake in girls. Structural equation modeling is a statistical procedure that tests the extent to which a theoretical model of proposed relationships among variables matches the observed pattern of relationships that exists in a data set. More importantly in our case, the structural equation modeling approach is also used as an alternative way of analyzing a series of regressions for modeling associations among variables of interest. We used three common fit indexes to evaluate the fit of the proposed models: the χ2 test, the Comparative Fit Index, and the Normed Fit Index (27). A small χ2 value is indicative of good fit, but the χ2 test is sensitive to sample size where N approaches 200 and can make trivial differences seem significant. For this reason, other indexes are typically used. The Normed Fit Index has values ranging from 0.00 to 1.00, and values nearing 0.95 have been proposed to indicate a good fit. The Comparative Fit Index compares the hypothesized model with the actual data and has values that range from 0.00 to 1.00 with values more than 0.95 indicating a good fit. Although we reported the traditional fit indexes, the path coefficients were most salient for interpreting our data. Path coefficients in the model can be interpreted as standardized regression weights.
RESULTS
For the total sample, as shown in Table 1, girls' mean daily energy intake was within the recommended range for 9-year-olds and they met recommendations for macro-nutrient intake. Dietary fiber was less than recommended levels; none of the girls met recommendations (17). Girls' mean intakes of most vitamins and minerals met recommendations except for vitamin E, calcium, and magnesium, which were less than recommended levels (see Table 2). Girls' vitamin and mineral intakes were compared EARs to determine the prevalence of inadequate nutrient intakes. Many girls had inadequate intakes of vitamin E and magnesium. As shown in Table 3, on average, girls consumed fewer than the seven servings of fruits and vegetables per day suggested by the Dietary Guidelines for Americans (22), and fewer than the 3.5 servings a day that Krebs-Smith and colleagues reported being consumed by this age group (28). When potatoes in the form of french fries and potato chips were excluded from the analyses, servings of vegetables were even less. Table 3 also indicates that girls in the sample consumed, on average, fewer than the recommended servings of grains and meat. Mothers' total fruit and vegetable intakes (including french fries and potato chips) were also less than the recommended seven servings per day (22).
Table 1.
Energy, macronutrient, and dietary fiber recommended and actual intakes in 9-year-old girls classified as picky or nonpicky eaters
|
Nutrient Intakea |
||||
|---|---|---|---|---|
| Recommendationb | Total sample (N=173) | Nonpicky (n=90) | Picky (n=83) | |
| Energy (kcal) | 1,500−2,400d | 1,804.6±330.5 | 1,837.6±374.5y | 1,777.6±283.1y |
| Fat (% of energy) | 32−35 | 31.8±4.6 | 31.9±4.6y | 31.7±4.7y |
| Carbohydrate (% of energy) | 45−65 | 55.9±5.9 | 57.1±5.6y | 55.7±6.2y |
| Protein (% of energy) | 10−30 | 13.9±2.5 | 13.7±2.2y | 14.0±2.8y |
| Dietary fiber (g) | 26 | 11.9±3.5 | 12.7±3.6y | 11.2±3.3z |
Mean±standard deviation.
Based on Dietary Reference Intake (17) for girls age 9−13 years.
c SD=standard deviation.
We created an Energy Estimate Requirements range for girls 9 through 18 years, where we used girls' mean age, weight and height, and physical activity coefficients (sedentary, low active, active, and very active). The range of values in Energy Estimate Requirements reflects possible differences in the physical activity coefficients of participants (17).
Values with different letters indicate significant differences between nonpicky and picky eaters' food group intake, P<.01.
Values with different letters indicate significant differences between nonpicky and picky eaters' food group intake, P<.01.
Table 2.
Dietary recommendations, mean intakes, and percent of 9-year-old girls at risk for inadequate intakes classified as picky and nonpicky eaters
|
Nutrient Intakea |
Girls at Riskb |
||||||
|---|---|---|---|---|---|---|---|
| Recommendationc | Total sample (N=173) | Nonpicky (n=90) | Picky (n=83) | Total sample (n=173) | Nonpicky (n=90) | Picky (n=83) | |
| Vitamin A (μg RAEe) | 600 | 694.9±285.5 | 718.1±288y | 669.7±282y | 15 | 12 | 18 |
| Vitamin C (mg) | 45 | 72.4±40.1 | 78.0±39y | 67.0±39y | 20 | 12 | 28* |
| Vitamin E (mg) | 11 | 6.0±2.0 | 6.8±2.3y | 5.6±1.5z | 92 | 88 | 98* |
| Folate (μg) | 300 | 315.9±88.7 | 330±87y | 303±92z | 23 | 23 | 30 |
| Vitamin B-6 (mg) | 1.0 | 1.4±0.4 | 1.4±4.1y | 1.5±.49y | 5 | 6 | 5 |
| Calcium (mg) | 1,300 | 905.5±302.5 | 905±288y | 911±320y | NAf | NA | NA |
| Iron (mg) | 8 | 12.4±3.8 | 12.9±3.8y | 12.0±3.9y | <1 | 0 | 1 |
| Zinc (mg) | 8 | 8.8±2.6 | 9.0±2.6y | 8.7±2.6y | 27 | 21 | 30 |
| Magnesium (mg) | 240 | 213.0±50.0 | 213.7±52.7y | 212.3±47.3y | 43 | 41 | 46 |
Mean±standard deviation.
At risk cut-offs using Estimated Average Requirements cut-point method for nutrients (50).
Recommendations based on the Dietary Reference Intakes for girls aged 9−13 years. Adequate Intake value listed for calcium; other nutrients listed as Recommended Dietary Allowances (18-21).
d SD=standard deviation.
RAE=retinol activity equivalents.
NA=not available. Percent of a population with inadequate intakes cannot be assessed for nutrients with Adequate Intake values (50).
Values with different letters indicate significant difference within nutrient group comparisons at P<.05.
Values with different letters indicate significant difference within nutrient group comparisons at P<.05.
Significant difference within nutrient group comparisons at P<.05.
Table 3.
Recommended, actual food group intakes, and percentage of 9-year-old girls meeting the recommendations classified as picky or nonpicky eaters
| Recommended No. of Servingsb |
No. of Servingsa |
% Meeting Recommendations |
|||||
|---|---|---|---|---|---|---|---|
| Total sample (N=173) | Nonpicky (n=90) | Picky (n=83) | Total sample (N=173) | Nonpicky (n=90) | Picky (n=83) | ||
| Grains | 9 | 6.1±1.7 | 6.3±1.8y | 5.9±1.6y | 6 | 8 | 4 |
| Vegetables | 4 | 1.0±0.8 | 1.7±.89y | 1.3±.72z | <1 | 1 | 0 |
| Fruit | 3 | 1.3±1.0 | 1.5±1.1y | 1.0±0.94z | 6 | 9 | 2* |
| Dairy | 2−3 | 2.8±1.3 | 2.8±1.2y | 2.9±1.3y | 36 | 36 | 37 |
| Meat | 2 | 1.4±0.6 | 1.5±0.63y | 1.4±0.59y | 20 | 22 | 18 |
| Fats and Sweets | NAd | 5.3±2.5 | 5.8±2.8y | 4.9±2.1z | NA | NA | NA |
Mean±standard deviation.
Recommendations are from the Food Guide Pyramid (22) for girls 6 years and older.
cSD=standard deviation.
NA=not applicable.
Values with different letters indicate significant difference between picky and nonpicky eaters' nutrient intake at P<.05, except for fruit at P<.01 and vegetables at P<.001.
Values with different letters indicate significant difference between picky and nonpicky eaters' nutrient intake at P<.05, except for fruit at P<.01 and vegetables at P<.001.
Significant difference within nutrient group comparisons between picky and nonpicky eaters' nutrient intake at P<.05.
One fourth of mothers gave picky eating scores of 3 or more to their daughters, in which 5 indicates maximum pickiness (mean=1.9±1.1, range=0−5.0); however, we categorized picky eaters using a median split of the data. Differences between picky and nonpicky eaters' mean energy, macronutrient, and fiber intakes are presented in Table 1. Picky eaters had lower energy intakes than girls who were not picky eaters; however, this difference was not significant between the two groups. Both groups consumed less fiber than recommended; however, picky girls' fiber intake was significantly less than the nonpicky girls' fiber intake. Table 2 reveals that picky eaters had significantly lower intakes of vitamin E and folate, and significantly more picky eaters were at risk for inadequate intakes of vitamins C and E. Table 3 indicates that picky eaters also had significantly lower intakes of fruits, vegetables, fats, and sweets. Except for the dairy group, the percentage of girls meeting the recommendations of the Food Guide Pyramid was less among the picky eaters. The percentage of girls consuming the recommended number of servings of fruit and vegetables at age 9 was low; none of the picky girls met the recommendations for vegetables and only 2% met the recommendations for fruit servings.
Information about weight status and body composition of the entire sample and each subgroup of girls is presented in Table 4. Picky eaters had significantly lower BMIs, t=2.10 (P<.05), and significantly less body fat, t=1.97 (P< .05). In addition, Figure 1 shows that a higher proportion (43%) of nonpicky eaters are overweight and obese using the 85th and 95th percentile cutoffs for BMI (25), χ2=12.30, P<.01. Only one girl in the sample was underweight (<5th percentile cutoff), and she was not a picky eater. There were no differences between the groups in maternal or paternal BMI.
Table 4.
Body mass index and body fat percentage in 9-year-old girls classified as nonpicky and picky eatersyz
|
Total Sample |
Nonpicky |
Picky |
||||
|---|---|---|---|---|---|---|
| N | Mean±SDa | n | Mean±SD | n | Mean±SD | |
| BMIb | 173 | 18.4±3.1 | 90 | 18.9±3.4y | 83 | 17.9±2.7z |
| Body fat %c | 164 | 26.7±7.1 | 82 | 27.8±7.4y | 82 | 25.6±6.6z |
SD=standard deviation.
BMI=body mass index; calculated as kg/m2.
Body fat percentage assessed using dual-energy x-ray absorptiometry. Not all participants provided consent for dual-energy x-ray absorptiometry, hence the total sample was reduced.
Values with different letters are significantly different at P<.05.
Values with different letters are significantly different at P<.05.
Figure 1.

Structural equation model of influences on girls' fruit and vegetable (F&V), micronutrient, and fiber intake (N=173). Path coefficients in the model can be interpreted as standardized regression weights. The path coefficients are adjusted for the presence of other relationships in the model. aIncludes calcium, iron, folate, vitamin A, vitamin C, vitamin E, vitamin B-6, magnesium, and zinc. bSignificance values: *P=.05, **P=.01, ***P=.001.
Figure 2 presents the structural equation model that examined the relationship among predictors of fruit and vegetable intake and the subsequent effect on micronutrient and fiber intake in girls. The model's path coefficients showed that mothers with higher fruit and vegetable intake had daughters who consumed more fruits and vegetables. Mothers who consumed fewer fruits and vegetables were likely to pressure their daughters to eat and to have daughters who were picky eaters. Girls who consumed more fruits and vegetables had higher micro-nutrient and fiber intakes. Path coefficients in the model can be interpreted as standardized regression weights, and in structural equation modeling the path coefficients are adjusted for the presence of other relationships in the model. Several fit indexes show that the hypothesized model is an adequate representation of the relationships among variables. Although the χ2 value was significant (χ2=63.59, df=8, P<.05), the Comparative Fit Index and Normed Fit Index revealed that the model provided a very good fit of the data (Comparative Fit Index=0.96; Normed Fit Index=0.95) and the R2=20.
Figure 2.
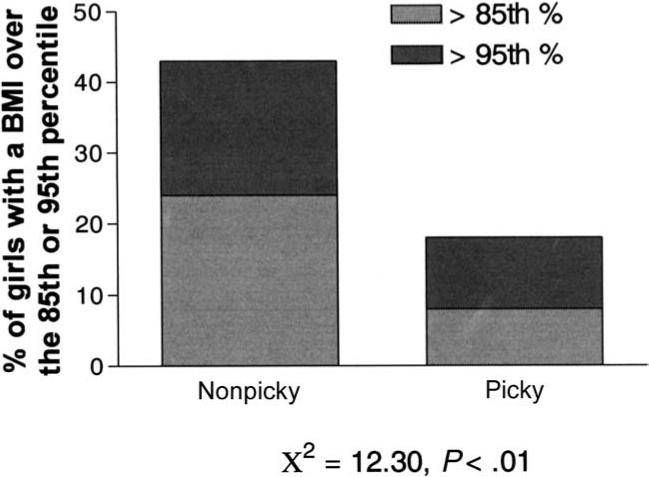
Proportion of 9-year-old girls classified as nonpicky and picky eaters with a body mass index (BMI) more than the 85th and 95th percentiles (25).
DISCUSSION
Regardless of whether girls were classified as picky eaters, most girls consumed less-than-recommended amounts of grains, fruits, vegetables, and meats; however, picky girls consumed significantly fewer servings of fruits, vegetables, fats, and sweets than girls who were not picky eaters. Fiber intake followed the same pattern. These results suggest that picky eaters did not consume more fats and sweets to compensate for lower fruit and vegetable intake.
The micronutrient intakes of both groups were similar in that they consumed inadequate quantities of vitamin E, calcium, and magnesium. Although most girls met recommendations for dairy intake, consuming the recommended number of dairy servings does not ensure adequate calcium intake, and among these girls, consumption of calcium-rich vegetables was low and did not contribute substantially to calcium intake, which is important in the prevention of osteoporosis (29-31). Despite the similarities in micronutrient intake, significantly more picky eaters were at risk of not meeting recommendations for vitamins C and E.
The findings also show that picky eaters consumed significantly less fiber than nonpicky eaters. However, girls in both groups consumed less fiber than recommended, possibly placing them at greater risk for long- and short-term health problems associated with low fiber intake, including constipation. Whereas nearly all girls were obtaining the recommended intake for many micronutrients, probably due to their consumption of fortified foods such as cereal (32), they did not obtain needed fiber and other potentially beneficial substances, such as phytochemicals.
Results of the structural equation modeling revealed that mothers directly influenced their daughters' fruit and vegetable intake by modeling and by making fruits and vegetables available; they indirectly affected fruit and vegetable consumption by pressuring their picky daughters to eat, which predicted higher levels of pickiness and lower fruit and vegetable intake. Picky girls tended to consume less total energy, had significantly lower BMIs and body fat, and were less likely to be overweight. Although picky eating might compromise children's nutrient intake in environments where food is scarce, these findings suggest that in today's industrialized environments, where a wide variety of palatable, energy-dense foods are readily and cheaply available, picky eating might be less problematic than previously thought and could help children maintain a healthful weight.
The finding that picky eaters are less likely to be overweight diverges from previous studies, which reported no differences in growth and weight status of picky toddlers and preschool children (4,33). It is possible, however, that the persistence of picky-eating behavior over time could have long-term effects on weight status that are not evident until children are older. In the present study, in which the incidence of overweight is high, the picky girls were not underweight, but they did have significantly lower BMIs than nonpicky girls. This contradicts the previous finding of no relationship between picky eating and fat mass or fat-free mass in preteen children (34), but it is consistent with the findings of another study, which reported that picky girls had a lower weight status (10). The difference in energy intake between picky eaters and their nonpicky counterparts was not statistically significant. However, over time substantial weight gain can result even when intake exceeds expenditure by small amounts, such as the 50 kcal/day difference noted in the present study, a value well within the margin of measurement error (35,36). This small difference between groups could, if it persisted over time, produce the differences in weight status we noted in the picky and nonpicky eaters.
In this study, children who were pressured to eat more by their parents consumed fewer fruits and vegetables, suggesting that mothers who modeled fruit and vegetable intake were less likely to use pressure. In contrast to the negative effects of pressure, making foods more available, accessible, and increasing children's familiarity with foods can increase acceptance and intake (37-39). The present findings contribute to the growing evidence that parental modeling of fruit and vegetable intake (8,40) and making fruits and vegetables available and accessible (41) promote fruit and vegetable consumption. These findings are also consistent with previous research indicating that pressuring children to eat a particular food actually reduces their liking and intake of that food (42-47). Although there is some evidence that parents believe that pressuring children to eat a food is an effective strategy for promoting intake (48), recent work by Batsell and colleagues (44) indicates that 69% of college students reported being pressured to eat foods as children, and that these incidents resulted in persistent food dislikes. The relationship between maternal use of pressure to eat when girls were 7 and girls' picky eating at age 9 provides stronger evidence that the use of parental pressure in feeding may promote both picky eating and lower fruit and vegetable consumption in girls.
Though both experimental research and retrospective findings suggest that pressure to eat is associated with food rejections and aspects of picky eating (44,47), the causal direction of these relationships has not been established. It seems likely that, as in many areas of parent-child interaction, influence between parent and child is bidirectional (49). Although parents' use of pressure may promote picky eating in a child, the child's initial weight status or eating style may also elicit the parents' use of pressure as a feeding strategy; children perceived to be too thin or children who parents think are not eating enough may elicit parental pressure to eat more (9). It seems that pressure can exacerbate existing problems, such as promoting dislikes for foods that parents want children to eat, and perhaps reducing fruit and vegetable intake (8,44).
CONCLUSIONS
These data indicate that the diets of picky and nonpicky eaters were more similar than they were different and suggest that increasing fruit and vegetable intake among all children should continue to be a major focus of interventions. Anticipatory guidance should provide parents with strategies that promote children's acceptance of a variety of foods, especially fruits and vegetables, particularly increasing availability and modeling fruit and vegetable intake, while discouraging parents from labeling the child as a picky eater or pressuring children to eat. To decrease parental use of pressure in child feeding, clinicians should address parental anxieties about the adequacy of the child's intake by emphasizing the child's normal growth and pointing out that pressuring children to eat is not an effective strategy for promoting children's intake of healthful foods.
Acknowledgments
We thank Shelly Mannino for her assistance with the nutrition analysis. This research was supported in part by National Institutes of Health (NIH) Grant No. RO1 HD32973, The National Dairy Council, services provided by the General Clinical Research Center NIH Grant M01 RR10732, and the Diet Assessment Center of The Pennsylvania State University. Dr Galloway was supported by NIH NRSA Grant No. HD 08626.
References
- 1.Tinsley BJ, Parke RD. The historical and contemporary relationship between developmental psychology of pediatrics: A review and empirical survey. In: Fitzgerald HE, Lester BM, Yogman MW, editors. Theory and Research in Behavioral Pediatrics. Plenum Press; New York, NY: 1984. pp. 1–30. [Google Scholar]
- 2.Li Y, Shi A, Wan Y, Hotta M, Ushijima H. Child behavior problems: Prevalence and correlates in rural minority areas of China. Pediatrics Int. 2001;43:651–661. doi: 10.1046/j.1442-200x.2001.01446.x. [DOI] [PubMed] [Google Scholar]
- 3.Pliner P, Hobden K. Development of a scale to measure the trait of food neophobia in humans. Appetite. 1992;19:105–120. doi: 10.1016/0195-6663(92)90014-w. [DOI] [PubMed] [Google Scholar]
- 4.Carruth BR, Skinner JD, Houck K, Moran J, Colletta F, Ott D. The phenomenon of “picky eater”: A behavioral marker in eating patterns of toddlers. J Am Coll Nutr. 1998;17:180–186. doi: 10.1080/07315724.1998.10718744. [DOI] [PubMed] [Google Scholar]
- 5.Potts HW, Wardle J. The list heuristic for studying personality correlates of food choice behaviour: A review and results from two samples. Appetite. 1998;30:79–92. doi: 10.1006/appe.1997.0087. [DOI] [PubMed] [Google Scholar]
- 6.Rydell AM, Dahl M, Sundelin C. Characteristics of school children who are choosy eaters. J Genet Psychol. 1995;156:217–229. doi: 10.1080/00221325.1995.9914818. [DOI] [PubMed] [Google Scholar]
- 7.Galloway AT, Lee Y, Birch LL. Predictors and consequences of food neophobia and pickiness in children. J Am Diet Assoc. 2003;103:692–698. doi: 10.1053/jada.2003.50134. [DOI] [PMC free article] [PubMed] [Google Scholar]
- 8.Fisher JO, Mitchell DC, Smiciklas-Wright H, Birch LL. Parental influences on young girls' fruit and vegetable, micronutrient, and fat intakes. J Am Diet Assoc. 2002;102:58–64. doi: 10.1016/s0002-8223(02)90017-9. [DOI] [PMC free article] [PubMed] [Google Scholar]
- 9.Francis LA, Hofer SM, Birch LL. Predictors of maternal child-feeding style: Maternal and child characteristics. Appetite. 2001;37:231–243. doi: 10.1006/appe.2001.0427. [DOI] [PubMed] [Google Scholar]
- 10.Marchi M, Cohen P. Early childhood eating behaviors and adolescent eating disorders. J Am Acad Child Adolesc Psychiatry. 1990;29:112–117. doi: 10.1097/00004583-199001000-00017. [DOI] [PubMed] [Google Scholar]
- 11.Jacobi C, Agras WS, Bryson S, Hammer LD. Behavioral validation, precursors, and concomitants of picky eating in childhood. J Am Acad Child Adolesc Psychiatry. 2003;42:76–84. doi: 10.1097/00004583-200301000-00013. [DOI] [PubMed] [Google Scholar]
- 12.Dennison BA, Rockwell HL, Baker SL. Fruit and vegetable intake in young children. J Am Coll Nutr. 1998;17:371–378. doi: 10.1080/07315724.1998.10718778. [DOI] [PubMed] [Google Scholar]
- 13.Fisher JO, Birch LL. Fat preferences and fat consumption of 3-to 5-year-old children are related to parental adiposity. J Am Diet Assoc. 1995;95:759–764. doi: 10.1016/S0002-8223(95)00212-X. [DOI] [PubMed] [Google Scholar]
- 14.Birch LL, Fisher JO, Grimm-Thomas K, Markey CN, Sawyer R, Johnson SL. Confirmatory factor analysis of the Child Feeding Questionnaire: A measure of parental attitudes, beliefs and practices about child feeding and obesity proneness. Appetite. 2001;36:201–210. doi: 10.1006/appe.2001.0398. [DOI] [PubMed] [Google Scholar]
- 15.Kristal AR, Patterson RE, Shattuck AS, Vizenor NC. Nutrient databases for food frequency questionnaires.. 23rd National Nutrient Databank Conference; Washington, DC. April 16, 1999. [Google Scholar]
- 16.Patterson RE, Kristal AR, Tinker LF, Carter RA, Bolton MP, Agurs-Collins T. Measurement characteristics of the Women's Health Initiative food frequency questionnaire. Ann Epidemiol. 1999;9:178–187. doi: 10.1016/s1047-2797(98)00055-6. [DOI] [PubMed] [Google Scholar]
- 17.Institute of Medicine, Food and Nutrition Board . Dietary Reference Intakes for Energy, Carbohydrates, Fiber, Fat, Fatty Acids, Cholesterol, Protein, and Amino Acids. National Academy Press; Washington, DC: 2002. [DOI] [PubMed] [Google Scholar]
- 18.Institute of Medicine, Food and Nutrition Board . Dietary Reference Intakes for Vitamin A, Vitamin K, Arsenic, Boron, Chromium, Copper, Iodine, Manganese, Molybdenum, Nickel, Silicon, Vanadium, and Zinc. National Academy Press; Washington, DC: 2001. [PubMed] [Google Scholar]
- 19.Institute of Medicine, Food and Nutrition Board . Dietary Reference Intakes for Vitamin C, Vitamin E, Selenium, and Carotenoids. National Academy Press; Washington, DC: 2000. [PubMed] [Google Scholar]
- 20.Institute of Medicine, Food and Nutrition Board . Dietary Reference Intakes for Thiamin, Riboflavin, Niacin, Vitamin B6, Folate, Vitamin B12, Pantothenic Acid, Biotin, and Choline. National Academy Press; Washington, DC: 1998. [PubMed] [Google Scholar]
- 21.Institute of Medicine, Food and Nutrition Board . Dietary Reference Intakes for Calcium, Phosphorus, Magnesium, Vitamin D, and Fluoride. National Academy Press; Washington, DC: 1997. [PubMed] [Google Scholar]
- 22.US Department of Agriculture, US Department of Health and Human Services . Nutrition and your Health: Dietary Guidelines for Americans. 5th ed. US Government Printing Office; Washington, DC: 2000. [Google Scholar]
- 23.Mitchell DC. Database requirements to meet food grouping needs. J Food Composit Anal. 2001;14:279–285. [Google Scholar]
- 24.Gordon CC, Chumlea WC, Roche TG. Stature, recumbent length, and weight. In: Lohman TG, Roche AF, Martorell R, editors. Anthropometric Standardization Reference Manual. Human Kinetics Books; Champaign, IL: 1988. pp. 3–8. [Google Scholar]
- 25.Kuczmarski RJ, Ogden CL, Grummer-Strawn LM, Flegal MK, Guo SS, Wei R, Mei Z, Curtin LR, Roche AF, Johnson CL. CDC growth charts: United States. Advance data from vital and health statistics. National Center for Health Statistics; Hyattsville, MD: 2000. Report No. 314. [PubMed] [Google Scholar]
- 26.Arbuckle JL, Wothke W. AMOS 4.0 user's guide. Smallwaters; Chicago, IL: 1999. [Google Scholar]
- 27.Byrne BM. Structural equation modeling with AMOS: Basic concepts, applications, and programming. Lawrence Erlbaum Associates, Inc; Mahwah, NJ: 2001. [Google Scholar]
- 28.Krebs-Smith SM, Cook AD, Subar AF, Cleveland L, Friday J, Kahle LL. Fruit and vegetable intakes of children and adolescents in the United States. Arch Pediatr Adolesc Med. 1996;150:81–86. doi: 10.1001/archpedi.1996.02170260085014. [DOI] [PubMed] [Google Scholar]
- 29.Heaney RP, Matkovic V. Inadequate peak bone mass. In: Riggs BL, Melton LJI, editors. Osteoporosis: Etiology, Diagnosis, and Management. Lippincott-Raven Publishers; Philadelphia, PA: 1995. pp. 115–131. [Google Scholar]
- 30.Matkovic V, Ilich JZ. Calcium requirements for growth: Are current recommendations adequate? Nutr Rev. 1993;51:171–180. doi: 10.1111/j.1753-4887.1993.tb03097.x. [DOI] [PubMed] [Google Scholar]
- 31.Weaver CM. The growing years and prevention of osteoporosis in later life. Proc Nutr Soc. 2000;59:303–306. doi: 10.1017/s0029665100000331. [DOI] [PubMed] [Google Scholar]
- 32.Berner LA, Clydesdale FM, Douglass JS. Fortification contributed greatly to vitamin and mineral intakes in the United States, 1989−1991. J Nutr. 2001;131:2177–2183. doi: 10.1093/jn/131.8.2177. [DOI] [PubMed] [Google Scholar]
- 33.Carruth BR, Skinner JD. Revisiting the picky eater phenomenon: neophobic behaviors of young children. J Am Coll Nutr. 2000;19:771–780. doi: 10.1080/07315724.2000.10718077. [DOI] [PubMed] [Google Scholar]
- 34.Nicholls D, Wells JC, Singhal A, Stanhope R. Body composition in early onset eating disorders. Eur J Clin Nutr. 2002;56:857–865. doi: 10.1038/sj.ejcn.1601403. [DOI] [PubMed] [Google Scholar]
- 35.Hill JO, Wyatt HR, Reed GW, Peters JC. Obesity and the environment: Where do we go from here. Science. 2003;299:853–855. doi: 10.1126/science.1079857. [DOI] [PubMed] [Google Scholar]
- 36.Nestle M. Increasing portion sizes in American diets: More calories, more obesity. J Am Diet Assoc. 2003;103:39–40. doi: 10.1053/jada.2003.50007. [DOI] [PubMed] [Google Scholar]
- 37.Birch LL, Marlin DW. I don't like it; I never tried it: Effects of exposure on two-year-old children's food preferences. Appetite. 1982;3:353–360. doi: 10.1016/s0195-6663(82)80053-6. [DOI] [PubMed] [Google Scholar]
- 38.Sullivan SA, Birch LL. Infant dietary experience and acceptance of solid foods. Pediatrics. 1994;93:271–277. [PubMed] [Google Scholar]
- 39.Birch LL. Psychological influences on the childhood diet. J Nutr. 1998;128(suppl 2):S407–S410. doi: 10.1093/jn/128.2.407S. [DOI] [PubMed] [Google Scholar]
- 40.Birch LL, Fisher JO. Development of eating behaviors among children and adolescents. Pediatrics. 1998;101:539–549. [PubMed] [Google Scholar]
- 41.Nicklas TA, Baranowski J, Cullen KW, Rittenberry L, Olvera N. Family and child-care provider influences on preschool children's fruit, juice, and vegetable consumption. Nutr Rev. 2001;59:224–235. doi: 10.1111/j.1753-4887.2001.tb07014.x. [DOI] [PubMed] [Google Scholar]
- 42.Birch LL, Birch D, Marlin D, Kramer L. Effects of instrumental eating on children's food preferences. Appetite. 1982;3:125–134. doi: 10.1016/s0195-6663(82)80005-6. [DOI] [PubMed] [Google Scholar]
- 43.Newman J, Taylor A. Effect of a means-end contingency on young children's food preferences. J Exp Child Psychol. 1992;64:200–216. doi: 10.1016/0022-0965(92)90049-c. [DOI] [PubMed] [Google Scholar]
- 44.Batsell RW, Brown AS, Ansfield ME, Paschall GY. “You will eat all of that!”: A retrospective analysis of forced consumption episodes. Appetite. 2002;38:211–219. doi: 10.1006/appe.2001.0482. [DOI] [PubMed] [Google Scholar]
- 45.Birch LL, Marlin D, Rotter J. Eating as the “means” activity in a contingency: Effects on young children's food preference. Child Dev. 1984;55:532–539. [Google Scholar]
- 46.Birch LL, McPhee L, Shoba BC, Steinberg L, Krehbiel R. “Clean up your plate”: Effects of child feeding practices on the conditioning of meal size. Learn Motiv. 1987;18:301–317. [Google Scholar]
- 47.Fisher JO, Mitchell DC, Smiciklas-Wright H, Birch LL. Maternal milk consumption predicts the trade-off between milk and soft drinks in young girls' diets. J Nutr. 2001;131:246–250. doi: 10.1093/jn/131.2.246. [DOI] [PMC free article] [PubMed] [Google Scholar]
- 48.Casey R, Rozin P. Changing children's food preferences: Parent opinions. Appetite. 1989;12:171–182. doi: 10.1016/0195-6663(89)90115-3. [DOI] [PubMed] [Google Scholar]
- 49.Holden GW, Miller PC. Enduring and different: A meta-analysis of the similarity in parents' child rearing. Psychol Bull. 1999;125:223–254. doi: 10.1037/0033-2909.125.2.223. [DOI] [PubMed] [Google Scholar]
- 50.Institute of Medicine, Food and Nutrition Board . Dietary Reference Intakes Applications in Dietary Assessment. National Academy Press; Washington, DC: 2000. [Google Scholar]