

Abstract
OBJECTIVE
To examine the effects of overweight and normal-weight mothers' restriction in child feeding on daughters' eating in the absence of hunger (EAH) and body mass index (BMI) change from age 5 to age 9 y.
DESIGN
Longitudinal study of the health and development of young girls.
SUBJECTS
A total of 91 overweight and 80 normal-weight mothers and their daughters, assessed when daughters were ages 5, 7, and 9 y.
MEASUREMENTS
Measures included maternal restriction of daughters' intake at age 5 y, and daughters' EAH and BMI change from age 5 to 9 y.
RESULTS
There were no overall differences in the level of restriction that overweight and normal-weight mothers used. However, overweight mothers' restrictive feeding practices when daughters were age 5 y predicted daughters' EAH over time, and higher EAH scores were associated with greater BMI change from age 5 to 9 y. These relationships did not hold for daughters of normal-weight mothers.
CONCLUSION
More adverse effects of restriction on daughters' EAH, and links between EAH and BMI change were only noted among daughters of overweight mothers. These findings highlight the need for a better understanding of factors that contribute to within-group variation in eating behavior and weight status.
Keywords: children, energy balance, eating style, gene–environment, parents
Introduction
Familial resemblance in weight is well established, and results from an interplay of genetic and environmental factors.1-4 Maternal weight status is one of the strongest predictors of childhood,5-7 and adult adiposity.8-10 Over half of the US population is currently overweight,11 and overweight parents are likely to have overweight children,2,4,12 making further increasing secular trends in childhood overweight probable.13 Although a certain degree of weight gain is a result of genetic predispositions expressed in a particular environment, overweight in children with overweight mothers may result in part from lifestyle factors that differ from those experienced by children in normal-weight families.
Families can be characterized as obesigenic based on obesity-promoting dietary and activity patterns, and parental weight status may moderate children's responses to the environmental contexts of eating.14,15 Children with a genetic predisposition for overweight may have additional risk factors for overweight, including a heightened responsiveness to food cues, or eating in the absence of hunger (EAH).16-18 EAH in the presence of palatable foods is a relatively stable characteristic in children, and shares behavioral characteristics with disinhibited eating.19 Fisher and Birch19 followed 192, 5-y-old girls over a period of 2 y to examine whether EAH tracked over time, increased the risk of girls being overweight at age 7 y, and was associated with parents' restrictive feeding practices. Results confirm that parents' use of restriction in child feeding when girls were 5 y old predicted girls' EAH at age 7 y; this problematic eating behavior was stable over a 2-y period and increased girls' likelihood of being overweight at age 7 y. While previous cross-sectional studies provide evidence for adverse short-term effects of restriction on child eating, recent studies from our laboratory provide evidence for the possible long-term effects of restriction on girls' eating behavior and weight status.16,19 This is the first study to examine the modulating influence of maternal weight status on maternal restriction in predicting daughters' EAH and girls' weight trajectory over time.
The effects of maternal overweight on children's eating environments are not yet well understood, but one possibility is that maternal overweight may moderate the effects of other aspects of the feeding environment, such as the effects of child-feeding practices. For example, it is possible that restriction in child feeding may produce different outcomes for children of overweight mothers, who may be predisposed to excessive weight gain as a result of the genetic and environmental influence conferred by maternal overweight, in comparison to children of normal-weight mothers.
Relationships among maternal restriction of daughters' intake, and daughters' EAH and change in body mass index (BMI) were examined using longitudinal data to test the model presented in Figure 1. Other versions of this model have been tested in previous studies16,19,20 using either cross-sectional data or short-term longitudinal data. The aims of the present study were to corroborate and extend previous work by (a) investigating the long-term influence of maternal restriction of daughters' intake at age 5 y on daughters' EAH across ages 5−9 y, (b) examining the influence of daughters' EAH on BMI change from age 5 to 9 y, and (c) assessing maternal weight status as a moderator of these relationships.
Figure 1.

Previous studies have tested vanations of this model, which proposes that maternal restriction influences daughters' eating in the absence of hunger, which is linked with higher weight status or greater increases m weight. While some studies have examined contemporaneous relations between maternal restriction and girls' EAH and weight status, longitudinal studies have examined how these factors influence children's risk for later problems with energy balance.
Research method and procedures
Participants
Participants were part of a longitudinal study of the health and development of young girls living in central Pennsylvania. At entry into the study, participants included 197, non-Hispanic, Caucasian 5-y-old girls (5.4±0.3) and their parents, of whom 192 families were reassessed 2 y later when girls were 7 y old (7.3±0.3). A third assessment with 183 families was carried out 2 y later, 4 years after the initial assessment, when girls were 9 y old (9.34±0.3). Only data collected from mothers and daughters were used in this study. Eligibility criteria for daughters' participation at the time of recruitment included living with both biological parents, the absence of severe food allergies or chronic medical problems affecting food intake, and the absence of dietary restrictions involving animal products; families were not recruited based on weight status or concern about weight. On average, mothers were in their mid-30s at the time of recruitment (35.4±4.8 y). Of the 183 families who returned for reassessment when girls were 9 y old, 171 families had complete data for analyses. The main reasons for excluding dyads from analyses were if daughters experienced problems that would affect their food intake during the free access procedure (see description of this procedure in the following section). Examples of such problems include low caloric intakes prior to the free access procedure (breakfast, lunch, and snack intake <400 kcal at age 5 and 7 y; intake <535 kcal at age 9 y), demonstrating an inability to be left alone during the procedure, allergies to snack foods used in the procedure, or reported nausea. The Pennsylvania State University Institutional Review Board approved all study procedures, and parents provided consent for their family's participation before the study began.
Girls' measures
Girls' weight status
Girls' height and weight measurements were obtained in order to calculate BMI scores. Height and weight were measured by a trained staff member following the procedures described by Lohman et al.21 Children were dressed in light clothing and measured without shoes. Height was measured in triplicate to the nearest 10th of a cm using a Shorr Productions stadiometer (Irwin Shorr, Olney, MD, USA). Weight was measured in triplicate to the nearest 10th of a kg using a Seca Electronic Scale (Seca Corp., Burmingham, UK). BMI (weight (kg)/height (m)2) scores were generated based on height and weight measurements. Age- and sex-specific BMI z-scores were calculated using the Centers for Disease Control and Prevention Growth Chart data.22 BMI change from age 5 to 9 y was calculated as the difference between daughters' BMI score at age 9 y and BMI at age 5 y; negative scores indicate a decrease in BMI from age 5 to 9 y, and positive scores indicate an increase in BMI from age 5 to 9 y. Absolute BMI change has been suggested as the index of choice for estimating body fatness in children, particularly when the age range of the sample is narrow.23
Free access procedure: eating in the absence of hunger
This procedure measured girls' responsiveness to the presence of palatable foods in the absence of hunger. Following a self-selected standard lunch, each girl was interviewed individually in a quiet room. Girls first indicated the extent to which they were hungry using three cartoon figures depicting an empty stomach, half empty stomach, and full stomach. To minimize the influence of hunger on the assessment of snack food intake, cases where girls who had low caloric intakes prior to the snack session and who indicated they had an empty stomach after lunch were not included in these analyses. Next, a rank-order food preference assessment was performed to ensure that each girl had an opportunity to taste each snack food. In this procedure, the child takes small tastes of foods and places them in front of cartoon-faces depicting ‘yummy’, ‘yucky’, and ‘just okay’. Following the preference assessment, the girl was shown various toys that were available for a play session. Generous portions of 10 sweet or savory snack foods, varying in fat content, were presented during the procedure: popcorn (6 g), potato chips (58 g), pretzels (39 g), nuts (44 g), fig bars (51 g), chocolate chip cookies (66 g), fruit-chew candy (66 g), chocolate bars (66 g), ice cream (168 g), and frozen yogurt (168 g). The girl was told that she could play with the toys or eat any of the foods while the experimenter did some work in the adjacent room. The experimenter then left the room for 10 min. Manufacturers' information was used to convert gram weight consumption of each food into energy intake. Energy intake during the free access procedure was calculated by summing the total energy content of all of the snack foods consumed during this period, and this provided a measure of EAH. High energy intake during the free access session characterizes children who may have a compromised ability to regulate energy intake, evidenced by their consumption of relatively large quantities of food in the absence of hunger. Daughters' average intake across ages 5, 7, and 9 y was calculated and used in all analyses.
Maternal measures
Maternal restrictive child-feeding style
Maternal restriction in child feeding was measured using the Restriction subscale from the Child Feeding Questionnaire (CFQ) developed by Birch et al.24 This scale contains eight items that assess the extent to which mothers restrict their child's access to foods (eg ‘I intentionally keep some foods out of my child's reach’). All items were measured using a 5-point Likert-type scale, with each point on the scale represented by a word anchor. Internal consistency scores for items on this scale were 0.78, 0.85, and 0.84 when daughters were age 5, 7, and 9 y, respectively.
Maternal weight status
Mothers' height and weight measurements were used to determine BMI scores using procedures described above for calculating BMI in girls.
Statistical analyses
All variables were either normally distributed or were transformed to improve normality and reduce skewness. Logarithmic transformations were performed on mothers' BMI variable. Spearman correlations were used to identify covariates, and to examine relations among predictor and outcome variables using the SAS version 8.2 software package (SAS Institute Inc., Cary, NC, USA). Because we were specifically interested in examining differences between overweight and normal-weight mothers, we used the widely accepted cutoff for defining overweight (BMI≥25 kg/m2)25 to divide the sample into two groups; overweight (N = 91) and normal-weight (N = 80) mothers. Path analysis was used to assess associations for overweight and normal weight mothers in a model assessing the indirect effect of maternal restriction when daughters were age 5 y on daughters' BMI change from age 5 to 9 y through effects on daughters' EAH over time. Models were examined using the AMOS version 5 software package (Smallwaters Corp., Chicago, IL, USA). Several widely accepted fit indices were used to assess the extent to which our hypothesized model provided an acceptable fit to the data: chi-square (χ2) values, the comparative fit index (CFI), the Tucker–Lewis index (TLI), and the root mean square error of approximation (RMSEA).26
In addition to these indices, χ2 difference tests were used to examine the moderating effect of maternal BMI, by examining whether path coefficients were significantly different between overweight and normal-weight mothers. Baron and Kenny27 defined a moderator as a variable that ‘affects the strength and/or relation between an independent or predictor variable and a dependent or criterion variable.’ The authors presented a multiple-group analysis with a dichotomous moderator and continuous outcome variable as one approach to testing moderation effects. Regression paths were constrained to be equal across models for overweight and normal-weight mothers. A significant difference in χ2 under such constraints provides evidence of a moderating effect of maternal weight status, suggesting that relationships may be different for overweight and normal-weight mothers. Significance for all relationships was determined at a level of P≤0.05.
Results
Maternal and child characteristics: differences between overweight and normal-weight mothers
Mean values for maternal variables are listed in Table 1. Overweight mothers had significantly higher BMI scores at study entry than normal-weight mothers (F = 160.1, P<0.001). Both normal-weight and overweight mothers reported similar levels of education, averaging approximately 14 y. Equal numbers of families in the overall sample (both normal-weight and overweight mothers combined) reported incomes in the following ranges at study entry: $20 000−35 000, $35 000−50 000, and above 50 000. On average, overweight mothers reported significantly lower family incomes in comparison to normal-weight mothers (F = 6.3, P<0.01). Thus, income was included as a covariate in the model predicting daughters' EAH over time and BMI change. There were no significant differences in age at study entry or the level of restriction used between overweight and normal-weight mothers at any point in time.
Table 1.
Maternal characteristics: differences between overweight and normal-weight mothers (means (s.d.))
| Variables | Overweighta(N = 91) | Normal weight (N = 80) |
|---|---|---|
| Maternal education time 1 (y)b | 14.4 (2.4) | 14.7 (2.2) |
| Family income time 1 ($1000)b | <$35* | $35−50 |
| Maternal ageb (y) | 35.5 (4.7) | 35.6 (4.8) |
| Maternal BMIb (kg/m2) | 30.3 (5.7)* | 21.9 (1.6) |
| Maternal restriction (age 5 y) | 2.9 (0.8) | 3.0 (0.9) |
| Maternal restriction (age 7 y) | 2.6 (0.9) | 2.8 (0.9) |
| Maternal restriction (age 9 y) | 2.6 (0.9) | 2.6 (0.9) |
Overweight defined as BMI ≥25 kg/m2.
Variable was measured at study entry, when daughters were age 5 y.
Means are significantly different between groups at P<0.05.
Differences in daughters' EAH and BMI across normal-weight and overweight mothers are shown in Table 2. Daughters of normal-weight mothers had significantly higher EAH energy intakes at age 5 y (F = 6.9, P<0.01), while there were no differences in EAH scores at ages 7 and 9 y. Figure 2 reveals that daughters of overweight mothers showed greater increases in EAH energy intake from age 5 to 9 y (132.3±168.3 vs 65.9±136.6; F = 7.9, P<0.01). Daughters of overweight mothers did not have significantly higher BMI scores at age 5 y, but had significantly higher BMI scores at age 7 y (F = 5.5, P<0.05) and age 9 y (F = 11.6, P<0.001). As shown in Figure 3, daughters of overweight mothers showed a greater increase in BMI from age 5 to 9 y, compared to daughters of normal-weight mothers (3.3±2.5 vs 2.0±1.9; F = 14.2, P<0.001).
Table 2.
Child characteristics: differences between daughters of overweight and normal-weight mothers (means (s.d.))
| Variables | Overweighta(N = 81) | Normal weight (N = 78) |
|---|---|---|
| Daughters' EAH (age 5 y) | 104.8 (86.3) | 141.9 (97.6)* |
| Daughters' EAH (age 7 y) | 180.2 (129.9) | 175.4 (118.2) |
| Daughters' EAH (age 9 y) | 237.1 (162.6) | 207.8 (128.2) |
| Daughters' BMI (age 5 y)b | 16.2 (1.7) | 15.8 (1.6) |
| Daughters' BMI (age 7 y)b | 17.1 (2.7)* | 16.3 (2.1) |
| Daughters' BMI (age 9 y)b | 19.5 (3.6)* | 17.8 (2.9) |
Overweight defined as BMI≥25 kg/m2.
The corresponding BMI percentiles based on the CDC 2000 growth charts are 65.7 and 56.9 at age 5 y, 66.6 and 54.7 at age 7 y, and 73.8 and 57.9 at age 9 y for daughters of overweight and normal-weight mothers, respectively. EAH: eating in the absence of hunger.
Means are significantly different between groups at P<0.05.
Figure 2.
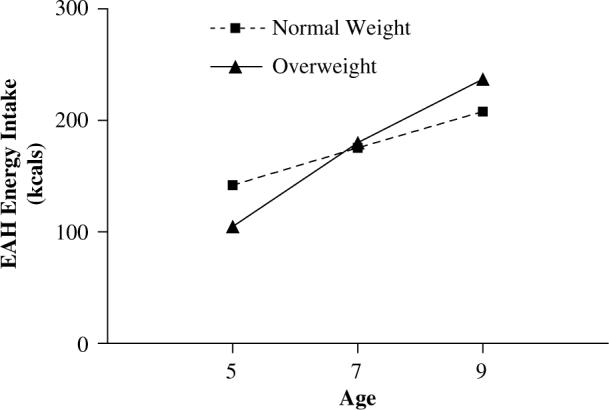
EAH energy intakes when girls were 5, 7, and 9 y. Daughters of overweight mothers had a significantly greater increase in EAH energy intake from age 5 to 9 y compared to daughters of normal-weight mothers (132.3±168.3 vs 65.9±136.6, F = 7.9, P<0.01).
Figure 3.
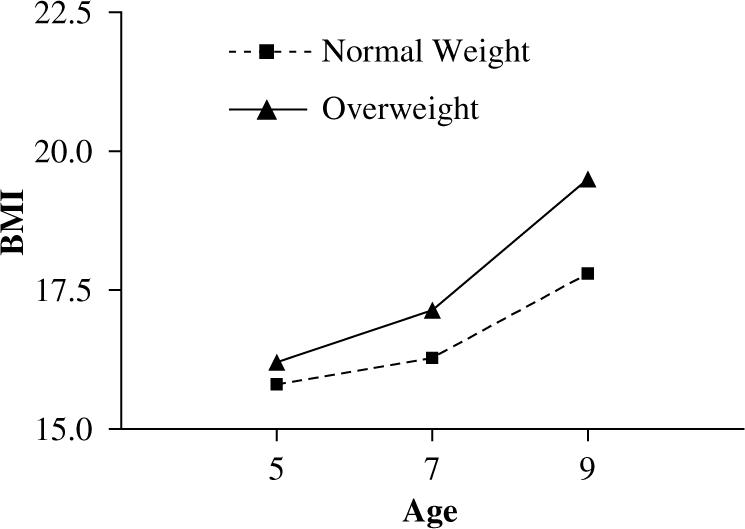
Daughters' BMI change from age 5 to 9 y. Daughters of overweight mothers were not significantly heavier at age 5 y, but were significantly heavier at age 9 y, and showed a significantly greater increase in BMI from age 5 to 9 y compared to daughters of normal-weight mothers (3.3±2.5 vs 2.0±1.9; F = 14.2, P<0.001).
Associations among maternal restriction, daughters' EAH, and daughters' BMI
Mothers' restriction of daughters' intake at age 5 y was related to daughters' BMI z-score at age 5 y, but only in normal-weight (P<0.05) mothers (see Table 3). Daughters' BMI z-score at age 5 y was related to EAH over time, but only in daughters of overweight mothers (P<0.05). Given these findings, as well as previous findings reporting associations between daughters' weight status, maternal restriction, and daughters' EAH,16,19,20 girls' BMI z-score at age 5 y was included as a covariate in order to account for its influence on variables in the path model.
Table 3.
Associations between daughters' BMI z-score at age 5 y and maternal restriction at age 5 y and daughters' EAH over time for overweighta (N = 91) and normal-weight (N = 80) mothers
|
Daughters' BMI z-score (age 5 y) |
||
|---|---|---|
| Overweight | Normal weight | |
| Maternal restriction | 0.09 | 0.28* |
| Daughters' EAHb | 0.25* | 0.10 |
Overweight defined as BMI≥25 Kg/m2.
Average scores were created for EAH across daughters' ages 5, 7, and 9 y. EAH: eating in the absence of hunger.
P<0.05.
The modulating effect of maternal BMI
Results of the path analysis are shown in Figure 4; models were adjusted for daughters' BMI z-score at age 5 y and family income at study entry. After stratifying the model by maternal BMI at study entry, the saturated model provided an excellent fit to the data (χ2[4] = 0.2, P = 0.99; TLI>1.0; CFI>1.0; RMSEA = 0.00). Both regression coefficients were significant for overweight mothers; neither was significant for normal-weight mothers. Overweight mothers' use of restriction when daughters were age 5 y was associated with higher EAH intakes in daughters across ages 5−9 y. The results of the χ2 test revealed that the association between maternal restriction and daughters' EAH over time was significantly different between overweight and normal-weight mothers ( = 8.45, P≤0.01). In daughters of overweight mothers, higher EAH intakes over time were associated with greater BMI change from age 5 to 9 y. The association between girls' EAH and BMI change from age 5 to 9 y also significantly differed between groups ( 5.88, P≤0.05). The final model R2 for EAH was 0.26 for daughters of overweight mothers, and 0.12 for daughters of normal-weight mothers. The final R2 for BMI change was 0.28 for daughters of overweight mothers and 0.14 for daughters of normal-weight mothers.
Figure 4.
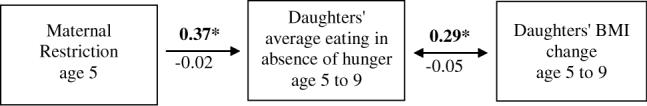
Indirect relation between maternal restriction of daughters' intake at age 5 y and daughters' BMI change from age 5 to 9 y, through daughters' EAH overtime, adjusted for daughters' BMI z-score at age 5 y and family income at study entry. Girls' BMI z-score at age 5 y and family income were allowed to covary with maternal restriction at age 5 y. Average scores across daughters' ages 5, 7, and 9 y were calculated for daughters' EAH. Estimates above the arrows (in bold type face) are for overweight mothers; estimates below the arrows are for normal-weight mothers. Significant relations (P<0.05) are denoted with an asterisk (*). Overweight mothers' restriction of daughters' intake at age 5 y predicted daughters' EAH scores over time, which in turn was associated with greater BMI change from age 5 to 9 y, these relations were not significant in normal-weight mothers. The final model R2 for daughters' EAH was 0 26 for overweight mothers and 0.12 for normal-weight mothers. The final model R2 for daughters' BMI change was 0.28 for overweight mothers and 0.14 for normal-weight mothers.
Discussion
The results of this study revealed that maternal restriction of daughters' intake at age 5 y was linked to daughters' EAH across ages 5−9 y, and daughters' EAH over time was associated with greater increases in BMI from age 5 to 9 y. These relationships were only significant for overweight mothers and their daughters, suggesting that for daughters of overweight mothers, restriction in child feeding may increase daughters' risk for overweight by promoting daughters' overeating in response to the presence of palatable foods. Previous studies from our laboratory have investigated relationships among parental restriction, children's EAH, and contemporaneous weight status,20,28 and risk for later problematic eating behavior and overweight in young girls.16,19 These studies have provided evidence for the adverse effects of maternal restriction on children's short-term problematic eating behaviors, and the stability of these eating behaviors over time, at least among middle-class Caucasian girls and their mothers. Further, they suggest that early maternal restriction may place children at risk for developing overweight, via effects on their overeating in response to external cues, such as the presence of palatable food. This study extends previous findings, revealing that relationships among maternal restriction, girls' EAH, and increase in BMI from age 5 to 9 y may differ depending on maternal weight status, which is one of the strongest predictors of children's risk for overweight.
Children's eating behavior and body weight are shaped by an interplay of genetic predispositions and environmental experiences.29-31 Genetic predispositions determine: (a) whether there are individual differences in responses to similar environments, known as gene–environment interactions, and (b) whether individuals with certain predispositions choose environments that nurture their dispositions.32 In daughters who have a propensity to be heavier—due to the genetic and environmental influences of having an overweight mother—elevated weight status may interact, or coact, with daughters' overeating style, leading to excessive weight gain over time. EAH characterizes girls who may overeat in response to external cues, such as the sensory properties of food. These findings emphasize the need to understand factors that are central to the emergence of individual differences in food intake in early childhood.
Do overweight and normal-weight mothers create different eating environments for daughters? The results of the present study corroborate those reported by Wardle et al,33 providing no evidence to support the notion that overweight or obese parents use a different feeding style with their children. Although the mean levels of maternal restriction were not different between overweight and normal-weight mothers, maternal weight status moderated the effects of maternal restriction on daughters' EAH, which was linked to daughters' increase in BMI over a 4-y period. Similar levels of maternal restriction in overweight and normal-weight mothers had different effects on their daughters' eating behavior and weight status. This interaction of weight status with the impact of maternal restriction produced increasingly different behavioral phenotypes from age 5 to 9 y in daughters of overweight and normal-weight mothers. While we provide evidence for a differential association between maternal restriction of daughters' eating behavior and weight status depending on maternal weight status, our results do not signify causality. It is possible that children in overweight families who demonstrate greater weight increases may eat more in the absence of hunger, which may elicit a response from parents to restrict their food intake in order to stem the development of overweight.
We know that parents contribute both genetic and environmental influences that may foster the development of overweight and behaviors that promote overweight in children.24,34 Treuth et al35 examined predictors of body fat gain in nonobese prepubertal girls with a predisposition to obesity through overweight parents. The authors found that compared to girls with two lean parents, girls with two obese parents showed significantly greater increases in fat mass over a 2-y period. Increases in fat mass and body fat percentage were predicted by energy expenditure and low levels of physical fitness. This study by Treuth et al35 suggests that fat gain in daughters with a predisposition to obesity, through overweight parents, may be mediated in part by physiological factors that influence fat gain. The results of the present study, however, suggest that fat gain in daughters of overweight mothers may be partly explained by behavioral risk factors for obesity.
Overweight parents can provide obesigenic environments for children; families where parents are overweight have lower levels of physical activity, and unhealthy dietary intakes15,36-38 relative to normal-weight parents. Using data from the sample used in the present study, Davison and Birch15 found that daughters in obesigenic families, characterized by relatively low levels of physical activity and relatively high energy intakes, gained more weight during middle childhood compared to daughters of nonobesigenic families. In another study from the same sample, in daughters with one or two overweight parents, television viewing was associated with more frequent snacking, and daughters' fat intake from energy-dense snacks was associated with greater weight gain from age 5 to age 9 y.37 Taken together, the results of these studies, in combination with the present findings, reveal that there are several aspects of the family environment, including parents' own eating and activity patterns, and child-feeding practices, which shape the development of children's eating behavior and weight status. These parental behaviors are a result of the coaction of genes and environment, shaping children's environments, and in tandem with children's predispositions, parental behaviors shape children's phenotypes for eating behavior, activity, and weight status.
Genetic and environmental influences on eating behavior, food choice, and body weight are well founded.1,39-44 The literature describing characteristic differences in children of overweight and nonoverweight parents is scant, and this literature is limited to descriptions of risk for overweight and obesity,2,45,46 and differences in energy expenditure and metabolic rate.47-50 Of the few studies outlining environmental and behavioral characteristics of families that place children at risk for developing problems with energy balance, Wardle et al38 found that children living with overweight or obese parents had higher preferences for fatty foods, lower preferences for vegetables, and exhibited aspects of a disinhibited eating style. Thus, parental overweight may provide both predispositions and the context for obesigenic eating behaviors and activity patterns in children. These findings emphasize the need for a better understanding of factors that influence eating behavior and weight status within high-risk groups, such as families with overweight parents.
The demographics of our sample limit our ability to generalize our findings to other socioeconomic, ethnic, and racial groups, and to boys. This is particularly problematic given the prevalence of obesity among black and Hispanic children, compared to non-Hispanic Caucasian children.13 While a majority of studies examining relationships among parental child-feeding practices and child eating and weight were conducted primarily with Caucasian, middle-class samples, recent focus group findings suggest that this group is more likely to use feeding practices in response to concerns about child overweight, rather than underweight, which appears to be more common in low-income black and Hispanic mothers.51 It would be advantageous to examine these relationships among more diverse populations.
The results of this study revealed that similar levels of restriction of daughters' intake used by overweight and normal-weight mothers were linked to different outcomes in daughters who have different predispositions to overweight, as indexed by maternal weight status. In daughters with overweight mothers, maternal restriction of daughters' intake at age 5 y was linked to daughters' average EAH intake across ages 5−9 y, which in turn was associated with greater BMI change from age 5 to 9 y. This is problematic, as EAH and overweight appear to be enduring traits for some children. Because there is evidence for the intergenerational transmission of problematic eating styles, particularly from mothers to daughters,52-54 mothers should be advised to model healthy eating and physical activity behaviors for children, such that early problems are not sustained through adolescence and adulthood. Our findings suggest that one approach to identifying girls as targets for preventive intervention is to focus on daughters of overweight mothers. Interventions that promote lifestyle changes in both physical activity and eating behaviors should be explored, and should focus on modifying family environments.
Acknowledgements
We thank all of the families who participated in this research study, as well as every staff member working diligently to collect these data. The services provided by the General Clinical Research Center of the Pennsylvania State University were appreciated. This research was supported by NIH Grants HD32973, NIH HD32973-03S1, and M01 RR10732.
References
- 1.Maes HH, Neale MC, Eaves LJ. Genetic and environmental factors in relative body weight and human adiposity. Behav Genet. 1997;27:325–351. doi: 10.1023/a:1025635913927. [DOI] [PubMed] [Google Scholar]
- 2.Lake JK, Power C, Cole TJ. Child to adult body mass index in the 1958 British birth cohort: associations with parental obesity. Arch Dis Child. 1997;77:376–381. doi: 10.1136/adc.77.5.376. [DOI] [PubMed] [Google Scholar]
- 3.Sorensen TI, Stunkard AJ. Does obesity run in families because of genes? An adoption study using silhouettes as a measure of obesity. Acta Psychiatr Scand Suppl. 1993;370:67–72. doi: 10.1111/j.1600-0447.1993.tb05363.x. [DOI] [PubMed] [Google Scholar]
- 4.Whitaker RC, Wright JA, Pepe MS, Seidel KD, Dietz WH. Predicting obesity in young adulthood from childhood and parental obesity. N Engl J Med. 1997;337:869–873. doi: 10.1056/NEJM199709253371301. [DOI] [PubMed] [Google Scholar]
- 5.Danielzik S, Langnasek K, Must M, Spethmann C, Muller MJ. Impact of parental BMI on the manifestation of overweight 5–7 year old children. Eur J Nutr. 2002;41:132–138. doi: 10.1007/s00394-002-0367-1. [DOI] [PubMed] [Google Scholar]
- 6.Maffeis C, Talamini G, Tato L. Influence of diet, physical activity and parents' obesity on children's adiposity: a four-year longitudinal study. Int J Obes Relat Metab Disord. 1998;22:758–764. doi: 10.1038/sj.ijo.0800655. [DOI] [PubMed] [Google Scholar]
- 7.Strauss RS, Knight J. Influence of the home environment on the development of obesity in children. Pediatrics. 1999;103:e85. doi: 10.1542/peds.103.6.e85. [DOI] [PubMed] [Google Scholar]
- 8.Noble RE. The incidence of parental obesity in overweight individuals. Int J Eat Disord. 1997;22:265–271. doi: 10.1002/(sici)1098-108x(199711)22:3<265::aid-eat5>3.0.co;2-l. [DOI] [PubMed] [Google Scholar]
- 9.Parsons TJ, Power C, Manor O. Fetal and early life growth and body mass index from birth to early adulthood in 1958 British cohort: longitudinal study. BMJ. 2001;323:1331–1335. doi: 10.1136/bmj.323.7325.1331. [DOI] [PMC free article] [PubMed] [Google Scholar]
- 10.Williams S. Overweight at age 21: the association with body mass index in childhood and adolescence and parents' body mass index. A cohort study of New Zealanders born in 1972–1973. Int J Obes Relat Metab Disord. 2001;25:158–163. doi: 10.1038/sj.ijo.0801512. [DOI] [PubMed] [Google Scholar]
- 11.Flegal KM, Carroll MD, Ogden CL, Johnson CL. Prevalence and trends in obesity among us adults, 1999–2000. JAMA. 2002;288:1723–1727. doi: 10.1001/jama.288.14.1723. [DOI] [PubMed] [Google Scholar]
- 12.Safer DL, Agras WS, Bryson S, Hammer LD. Early body mass index and other anthropometric relationships between parents and children. Int J Obes Relat Metab Disord. 2001;25:1532–1536. doi: 10.1038/sj.ijo.0801786. [DOI] [PubMed] [Google Scholar]
- 13.Ogden CL, Flegal KM, Carroll MD, Johnson CL. Prevalence and trends in overweight among us children and adolescents, 1999–2000. JAMA. 2002;288:1728–1732. doi: 10.1001/jama.288.14.1728. [DOI] [PubMed] [Google Scholar]
- 14.Fogelholm M, Nuutinen O, Pasanen M, Myohanen E, Saatela T. Parent–child relationship of physical activity patterns and obesity. Int J Obes Relat Metab Disord. 1999;23:1262–1268. doi: 10.1038/sj.ijo.0801061. [DOI] [PubMed] [Google Scholar]
- 15.Davison KK, Birch LL. Obesigenic families: parents' physical activity and dietary intake patterns predict girls' risk of overweight. Int J Eat Disord. 2002;26:1186–1193. doi: 10.1038/sj.ijo.0802071. [DOI] [PMC free article] [PubMed] [Google Scholar]
- 16.Birch LL, Fisher JO, Davison KK. Learning to overeat: maternal use of restrictive practices promotes girls' eating in the absence of hunger. Am J Clin Nutr. 2003;78:215–220. doi: 10.1093/ajcn/78.2.215. [DOI] [PMC free article] [PubMed] [Google Scholar]
- 17.Costanzo PR, Woody EZ. Externality as a function of obesity in children: pervasive style or eating-specific attribute? J Pers Soc Psychol. 1979;37:2286–2296. doi: 10.1037//0022-3514.37.12.2286. [DOI] [PubMed] [Google Scholar]
- 18.Johnson SL, Birch LL. Parent's and children's adiposity and eating style. Pediatrics. 1994;94:653–661. [PubMed] [Google Scholar]
- 19.Fisher J, Birch L. Eating in the absence of hunger and overweight in girls at 5 and 7 y of age. Am J Clin Nutr. 2002;76:226–231. doi: 10.1093/ajcn/76.1.226. [DOI] [PMC free article] [PubMed] [Google Scholar]
- 20.Birch LL, Fisher JO. Mothers' child-feeding practices influence daughters' eating and weight. Am J Clin Nutr. 2000;71:1054–1061. doi: 10.1093/ajcn/71.5.1054. [DOI] [PMC free article] [PubMed] [Google Scholar]
- 21.Lohman TG, Roche AF, Martorell R. Anthropometric standardization reference manual. Human Kinetics Books; Champaign, IL: 1988. [Google Scholar]
- 22.Kuczmarski RJ, Ogden CL, Guo SS, Grummer-Strawn LM, Flegal KM, Mei Z, Wei R, Curtin LR, Roche AF, Johnson CL. CDC growth charts: United States. Advance data from vital health statistics. National Center for Health Statistics; Hyattsville, MD: 2000. [PubMed] [Google Scholar]
- 23.Field AE, Laird NM, Steinberg E, Fallon E, Semega-Janneh M, Yanovski JA. Which metric of relative weight best captures body fatness in children? Obes Res. 2003;11:1345–1352. doi: 10.1038/oby.2003.182. [DOI] [PubMed] [Google Scholar]
- 24.Birch LL, Fisher JO, Grimm-Thomas K, Markey CN, Sawyer R, Johnson SL. Confirmatory factor analysis of the Child Feeding Questionnaire: a measure of parental attitudes, beliefs and practices about child feeding and obesity proneness. Appetite. 2001;36:201–210. doi: 10.1006/appe.2001.0398. [DOI] [PubMed] [Google Scholar]
- 25.National Institutes of Health . Clinical guidelines on the identification, evaluation, and treatment of overweight and obesity in adults. 1998. pp. 1–228. [Google Scholar]
- 26.Maruyama GM. Basics of structural equation modeling. Sage Publications Inc.; Thousand Oaks, CA: 1998. [Google Scholar]
- 27.Baron RM, Kenny DA. The moderator–mediator variable distinction in social psychological research: conceptual, strategic, and statistical considerations. J Pers Soc Psychol. 1986;51:1173–1182. doi: 10.1037//0022-3514.51.6.1173. [DOI] [PubMed] [Google Scholar]
- 28.Fisher JO, Birch LL. Restricting access to foods and children's eating. Appetite. 1999;32:405–419. doi: 10.1006/appe.1999.0231. [DOI] [PubMed] [Google Scholar]
- 29.Schlundt DG. Obesity: a biogenetic or biobehavioral problem. Int J Obes Relat Metab Disord. 1990;14:815–828. [PubMed] [Google Scholar]
- 30.Faith MS, Johnson SL, Allison DB. Putting the behavior into the behavior genetics of obestiy. Behav Genet. 1997;27:423–439. doi: 10.1023/a:1025648316652. [DOI] [PubMed] [Google Scholar]
- 31.de Castro JM. Behavioral genetics of food intake regulation in free-living humans. Nutrition. 1999;15:550–554. doi: 10.1016/s0899-9007(99)00114-8. [DOI] [PubMed] [Google Scholar]
- 32.Plomin R, DeFries JC, Loehlin JC. Genotype–environment interaction and correlation in the analysis of human behavior. Psychol Bull. 1977;84:309–322. [PubMed] [Google Scholar]
- 33.Wardle J, Sanderson S, Guthrie C, Rapoport L, Plomin R. Parental feeding style and the intergenerational transmission of obesity risk. Obes Res. 2002;10:453–462. doi: 10.1038/oby.2002.63. [DOI] [PubMed] [Google Scholar]
- 34.Dowda M, Ainsworth B, Addy CL, Saunders R, Riner W. Environmental influences, physical activity, and weight status in 8-to-16-year-olds. Arch Pediatr Adolesc Med. 2001;155:711–717. doi: 10.1001/archpedi.155.6.711. [DOI] [PubMed] [Google Scholar]
- 35.Treuth MS, Butte NF, Sorkin JD. Predictors of body fat gain in nonobese girls with a familial predisposition to obesity. Am J Clin Nutr. 2003;78:1212–1218. doi: 10.1093/ajcn/78.6.1212. [DOI] [PubMed] [Google Scholar]
- 36.Burke V, Beilin LJ, Dunbar D. Family lifestyle and parental body mass index as predictors of body mass index in Australian children: a longitudinal study. Int J Obes Relat Metab Disord. 2001;25:147–157. doi: 10.1038/sj.ijo.0801538. [DOI] [PubMed] [Google Scholar]
- 37.Francis LA, Lee Y, Birch LL. Parental weight status and girls' television viewing, snacking, and body mass indexes. Obes Res. 2003;11:143–151. doi: 10.1038/oby.2003.23. [DOI] [PMC free article] [PubMed] [Google Scholar]
- 38.Wardle J, Guthrie C, Sanderson S, Birch LL, Plomin R. Food and activity preferences in children of lean and obese parents. Int J Obes Relat Metab Disord. 2001;25:971–977. doi: 10.1038/sj.ijo.0801661. [DOI] [PubMed] [Google Scholar]
- 39.van den Bree MBM, Eaves LJ, Dwyer JT. Genetic and environmental influences on eating patterns of twins aged ≥50 y. Am J Clin Nutr. 1999;70:456–465. doi: 10.1093/ajcn/70.4.456. [DOI] [PubMed] [Google Scholar]
- 40.Faith MS, Keller KL, Johnson SL, Pietrobelli A, Matz PE, Must S, Jorge MA, Cooperberg J, Heymsfield SB, Allison DB. Familial aggregation of energy intake in children. Am J Clin Nutr. 2004;79:844–850. doi: 10.1093/ajcn/79.5.844. [DOI] [PubMed] [Google Scholar]
- 41.Bulik CM, Sullivan PF, Kendler KS. Genetic and environmental contributions to obesity and binge eating. Int J Eat Disord. 2003;33:293–298. doi: 10.1002/eat.10140. [DOI] [PubMed] [Google Scholar]
- 42.Keller KL, Pietrobelli A, Faith MS. Genetics of food intake and body composition: lessons from twin studies. Acta Diabetol. 2003;40:S95–S100. doi: 10.1007/s00592-003-0038-6. [DOI] [PubMed] [Google Scholar]
- 43.de Castro JM. Eating behavior: lessons from the real world of humans. Nutrition. 2000;16:800–813. doi: 10.1016/s0899-9007(00)00414-7. [DOI] [PubMed] [Google Scholar]
- 44.Grilo CM, Pogue-Geile MF. The nature of environmental influences on weight and obesity: a behavior genetics analysis. Psychol Bull. 1991;110:520–537. doi: 10.1037/0033-2909.110.3.520. [DOI] [PubMed] [Google Scholar]
- 45.Frisancho AR. Prenatal compared with parental origins of adolescent fatness. Am J Clin Nutr. 2000;72:1186–1190. doi: 10.1093/ajcn/72.5.1186. [DOI] [PubMed] [Google Scholar]
- 46.Locard E, Mamelle N, Billette A, Miginiac M, Munoz F, Rey S. Risk factors of obesity in a five year old population: parental versus environmental factors. Int J Obes Relat Metab Disord. 1992;16:721–729. [PubMed] [Google Scholar]
- 47.Bandini LG, Must A, Spadano J, Dietz WH. Relation of body composition, parental overweight, pubertal stage, and race-ethnicity to energy expenditure among premenarcheal girls. Am J Clin Nutr. 2002;76:1040–1047. doi: 10.1093/ajcn/76.5.1040. [DOI] [PubMed] [Google Scholar]
- 48.Treuth MS, Butte NF, Wong WW. Effects of familiar predisposition to obesity on energy expenditure in multiethnic prepubertal girls. Am J Clin Nutr. 2000;71:893–900. doi: 10.1093/ajcn/71.4.893. [DOI] [PubMed] [Google Scholar]
- 49.Treuth MS, Butte NF, Puyau M, Adolph A. Relations of parental obesity status to physical activity and fitness of prepubertal girls. Pediatrics. 2000;106:U29–U36. doi: 10.1542/peds.106.4.e49. [DOI] [PubMed] [Google Scholar]
- 50.Wurmser H, Laessle R, Jacob K, Langhard S, Uhl H, Angst A, Muller A, Pirke KM. Resting metabolic rate in preadolescent girls at high risk of obesity. Int J Obes Relat Metab Disord. 1998;22:793–799. doi: 10.1038/sj.ijo.0800662. [DOI] [PubMed] [Google Scholar]
- 51.Sherry B, McDivitt J, Birch LL, Cook F, Sanders S, Prish J, Francis LA, Scanlon KS. Attitudes, practices, and concerns about child feeding and child weight status among socioeconomically diverse Caucasian, Hispanic, and African American mothers. J Am Diet Assoc. 104:215–221. doi: 10.1016/j.jada.2003.11.012. [DOI] [PubMed] [Google Scholar]
- 52.Cutting TM, Fisher JO, Grimm-Thomas K, Birch LL. Like mother, like daughter: familial patterns of overweight are mediated by mothers' dietary disinhibition. Am J Clin Nutr. 1999;69:608–613. doi: 10.1093/ajcn/69.4.608. [DOI] [PubMed] [Google Scholar]
- 53.Jacobi C, Agras WS, Hammer LD. Predicting children's reported eating disturbances at 8 years of age. J Am Acad Child Adolesc Psychiatry. 2001;40:364–372. doi: 10.1097/00004583-200103000-00017. [DOI] [PubMed] [Google Scholar]
- 54.Pike KM, Rodin J. Mothers, daughters, and disordered eating. J Abnorm Psychol. 1991;100:198–204. doi: 10.1037//0021-843x.100.2.198. [DOI] [PubMed] [Google Scholar]