

Abstract
Milk intake constitutes an important source of dietary calcium for young girls but declines throughout childhood. Recent work shows that the intake of soft drinks may contribute to this decline. Influences on the apparent tradeoff between soft drinks and milk in young girls’ diets are not well described. The objective of this research was to test a model depicting maternal beverage choices as predictors of their daughters’ milk and soft drink intake. A structural equation model describing maternal influences on daughters’ milk, soft drink and calcium intakes was tested using data from 180 non-Hispanic, white families with 5-y-old daughters. Mothers’ calcium, milk and soft drink intakes were evaluated as predictors of their daughters’ intakes. Mothers’ and daughters’ soft drink intakes were also examined as predictors of their own milk and calcium intakes. The model provided a good fit to the data, revealing mother-daughter similarities in beverage intake. Mothers who drank milk more frequently had daughters who drank milk more frequently and drank fewer soft drinks. For both mothers and daughters, soft drink consumption was negatively related to both milk and calcium intake. This research provides evidence that mothers’ beverage choices influence the tradeoff between milk and soft drinks in their daughters’ diets. In particular, mothers’ milk and soft drink intakes may affect their daughters’ calcium adequacy in early childhood by influencing the frequency with which their daughters consume those beverages.
Keywords: soft drink intake, milk intake, calcium, maternal beverage choices
Calcium intake during the first decades of life has a functional role in the prevention of osteoporosis among females by influencing peak bone mass (Matkovic 1992, Matkovic and Ilich 1993, National Institutes of Health 1994, Recker et al. 1992). During childhood and young adulthood, dietary calcium intake, as well as consumption of milk, is positively associated with bone mineral content or bone mineral density in females (Cadogan et al. 1998, Chan 1991, Lee et al. 1993a, Lutz and Tesar 1990, Matkovic and Ilich 1993, Recker et al. 1992, Sentipal et al. 1991, Teegarden et al. 1999, Welten et al. 1995). Furthermore, bone mineral density is responsive to calcium supplementation in young females, particularly those with low spontaneous calcium intakes (Johnston et al. 1992, Lee et al. 1993b, Lloyd et al. 1993). Finally, lifetime milk consumption, particularly during adolescence, is associated with bone mineral density in premenopausal and postmenopausal women (Chumlea and Guo 1997, Halioua and Anderson 1989, Murphy et al. 1994, Soroko et al. 1994). Survey data indicate that although calcium intakes among females tend to be adequate during childhood, consumption drops well below recommended levels by adolescence (Albertson et al. 1997, Eck and Hackett-Renner 1992, Fleming and Heimbach 1994). Identifying environmental factors that predict young girls’ calcium intake before this period may shed light on potential areas for dietary intervention among families where girls are most at risk for inadequate intake.
Milk intake plays an important role in achieving adequate calcium intake, contributing approximately two thirds or more of total calcium intake for infants and toddlers and more than half of total calcium intake for adolescent girls (Albertson et al. 1997, Fleming and Heimbach 1994). Recent work indicates that the contribution of milk intake to calcium adequacy may be compromised by children’s intake of soft drinks. “Soft drinks” refers to a broad category of beverages that includes carbonated beverages and all noncarbonated beverages such as fruit punch or fruit-aids (not 100% juice). Harnack et al. (1999) found that carbonated soft drinks intake may displace milk in the diet; preschool, school-age and adolescent children with carbonated soft drink intakes of >266 mL/d (9 fl oz/d) were 2.9–3.9 times more likely to consume <237 mL (8 fl oz) of milk/d. These findings are of particular relevance because soft drink intake has increased dramatically among children during the past two decades (Borrud et al. 1997) and milk intake in the United States has declined (Putman and Gerrior 1997). Furthermore, several reports indicate that excessive carbonated soft drink intake increases the risk of bone fractures in young girls (Wyshak and Frisch 1994, Wyshak 2000). A recent evaluation of National Health and Nutrition Examination Survey III (1988–1994) data indicates that regular carbonated soft drink consumption constitutes ~2.4% of energy intakes and noncarbonated beverages containing little juice constitutes an additional 3.6% of energy intakes for 2- to 5-y-old children (Troiano et al. 2000).
One recent report noted mother-daughter similarities in milk and dairy product intakes (Grove et al. 1999). No studies to date, however, have investigated the extent to which family factors may influence the apparent tradeoff between young girls’ milk and soft drink intake. Mothers may have an influential role in their daughters’ patterns of milk and soft drink intake by deciding what type of beverages are available at meals and snacks where mother and daughter are present. Mothers may also shape their daughters’ choices by serving as a role model for when milk is typically consumed.
The main objective of this research was to determine whether a tradeoff between milk and soft drink intake could be described among young girls as a function of their mothers’ beverage choices. Soft drink consumption was evaluated because for young children, both noncarbonated drinks, such as fruit punches and fruit-aids, and regular carbonated beverages are frequently consumed (Troiano et al. 2000, U.S. Department of Agriculture 1999) and may represent common alternatives to milk intake. Structural equation modeling was used to test a model describing relationships between mothers’ and daughters’ milk, soft drink and calcium intakes. This model controlled for the influence of mothers’ and daughters’ energy intakes on their calcium, milk and soft drink consumption, as well as for mother-daughter similarities in energy intakes.
SUBJECTS AND METHODS
Participants
Participants were 197 girls (5-y-olds; mean age 5.4 ± 0.0 y; age range 4.6–6.4 y) and their mothers. Eligibility criteria for girls’ participation included living with both biological parents, the absence of severe food allergies or chronic medical problems affecting food intake and the absence of dietary restrictions involving animal products. Families were recruited for participation in the study using flyers and newspaper advertisements. Age-eligible female children throughout several counties in central Pennsylvania received mailings and follow-up telephone calls. On average, mothers were in their mid-30s (mothers’ mean age 35.4 ± 0.3 y). Almost two thirds of mothers (63%) were currently employed, reporting an average of 20 h of work/wk. Twenty-nine percent of reported family incomes were below $35,000, 35% were between $35,000 and $50,000 and 36% were above $50,000. Mothers were well educated, with roughly one third reporting high school diplomas as the highest degree completed, 48% reporting an associate’s, technical or bachelor’s degree as the highest degree obtained and 15% reported a postgraduate degree as the highest degree obtained. Mothers were slightly overweight, with mean body mass index scores (weight/height) of 25.8 ± 0.4 kg/m2. Girls’ average weight-for-height percentile scores (mean 62 ± 26%, range 6–99%) indicated that the sample was slightly above the median relative to age- and gender-specific reference data (Hamill et al. 1979).
Measures
Maternal dietary intake
Mothers’ typical energy, calcium, milk and sweetened beverage intakes were measured using a quantitative food frequency questionnaire (FFQ) (Kristal et al. 1999, Patterson et al. 1999). Each mother completed a FFQ regarding her dietary intake during the past 3-mo period. Energy and calcium intakes were calculated using information from categorical responses regarding food type and food preparation, frequency of intake and portion size. This FFQ has been shown to estimate energy intake within 10% of dietary recall and record methods (Patterson et al. 1999). The frequency of mothers’ soft drink intake was measured using a category described as “regular soft drinks, soda pop (not diet), and Kool-Aid.” Milk and regular soft drink intakes were expressed in terms of the frequency of medium servings per week, where medium servings of milk and soft drink were 237 mL (8 fl oz) and 355 mL (12 fl oz), respectively. Mothers’ frequency of diet soft drink intake was measured using a 9-point scale, where 1 was never or less than once a month and 9 was >2 times/d.
Daughter dietary intake
Children’s energy, calcium, milk and soft drink intakes were measured using three 24-h recalls. Recalls were collected from 196 girls, with mothers acting as the primary source of information in the presence of their daughters. Interviews were conducted by trained staff at The Pennsylvania State Diet Assessment Center using the computer-assisted Nutrition Data System (NDS) (Version 2.6, Nutrient Database Version 12, Food Database 27; Nutrition Coordinating Center, University of Minnesota, Minneapolis, MN, release date 1996). Two weekdays and 1 weekend d during the summer were randomly selected over a 2-wk period that was chosen by the parent. Food portion posters (2D Food Portion Visual; Nutrition Consulting Enterprises, Framingham, MA) were used as a visual aid for estimating amounts of foods eaten. Nutrient data were averaged across 3 d to obtain an estimate of average energy and calcium intakes. Food group analysis was conducted on NDS summary file data to determine the average daily frequency of milk and soft drink consumption. Soft drinks included both caloric carbonated and noncarbonated beverages containing little if any fruit juice; caloric carbonated beverages constituted ~48% of all soft drinks. Diet carbonated soft drinks was not included in this analysis due to the low frequency with which it was consumed by girls (27 of 196 girls).
Statistical analysis
Complete data on all variables were obtained from 184 mother-daughter pairs. Four cases were removed for having extreme values (>4 SD) on mothers’ calcium, milk and soft drink variables. Thus, 180 cases were retained for statistical analyses. Descriptive statistics were generated for all variables included in the structural model. Structural equation modeling with LISREL (Version 8.20) was used to test the model shown in Figure 1, describing relationships between mother and daughter calcium, milk and soft drink intakes. This statistical technique provides a comprehensive test of fit for a series of relationships among variables. Each construct in the model was measured using a single variable so the measurement error for each was constrained to zero. Variances were estimated for each construct shown in Figure 1 as well as that for daughters’ energy intake; variances for mothers’ energy intake and income were not estimated, because both were considered exogenous variables. Indicators of a good model fit were 1) a nonsignificant χ2 value, indicating that the model was not different than the structure of the observed data and 2) a value of >0.90 for the Non-Normed Fit Index (NNFI) and the Comparative Fit Index (CFI), as well as 3) a value of <0.05 for the root mean square error of approximation (RMSEA) (Byrne 1999).
FIGURE 1.
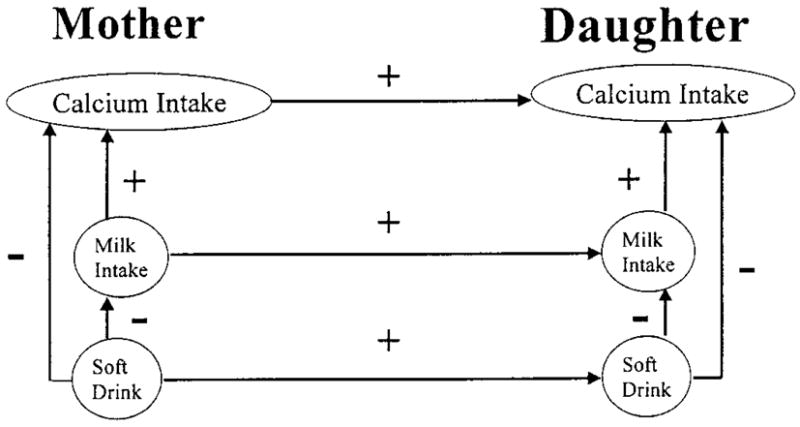
Hypothesized model depicting relationships between mothers’ and daughters’ calcium, milk and soft drink intakes and showing maternal influences on daughters’ beverage consumption where mothers’ milk and soft drink intakes predict daughters’ intakes of those beverages. Mothers’ and daughters’ soft drink intakes are also hypothesized to negatively predict their own milk and calcium intakes.
RESULTS
Descriptive statistics are provided in Table 1. Mothers’ and daughters’ energy intakes were ~19% and ~16% below age-and gender-appropriate recommended dietary allowances, respectively (Food and Nutrition Board 1999, National Research Council, Food and Nutrition Board 1989) but were roughly similar to mean energy intakes among similarly aged females in the National Health and Examination Survey (NHANES) III, 1988–1991 (McDowell et al. 1994). Mothers’ calcium intakes were 15% below Dietary Reference Intakes (DRI) (1000 mg/d) but were ~8% higher than those reported for similarly aged women in NHANES III (Alaimo et al. 1994) and approximately one fourth higher than the mean amount consumed by similarly aged women in the Continuing Survey of Food Intakes by Individuals (CSFII), 1994–1996 (U.S. Department of Agriculture 1998). Daughters, however, had average calcium intakes that were slightly above the 800 mg/d DRI for 4- to 5-y-old children and were similar to those average values reported in NHANES III (Alaimo et al. 1994) and those reported for 3- to 5-y-old children in CSFII, 1994–1996 (U.S. Department of Agriculture 1999).
TABLE 1.
Descriptive statistics for mothers’ and daughters’ dietary energy, calcium, milk and soft drink consumption
| Measure | n | Means 6 SD (range) | |
|---|---|---|---|
| Mother | Energy, kJ/d | 180 | 7418 ± 2757 (1856–15,092) |
| Calcium, mg/d | 180 | 852 ± 397 (151–1928) | |
| Milk, n/wk1 | 148 | 6 ± 6 (0–16) | |
| Soft drink, n/wk1 | 119 | 5 ± 6 (0–16) | |
| Diet soft drink, n/wk1,2 | 85 | 6 ± 2 (1–9) | |
| Daughter | Energy, kJ/d | 180 | 6318 ± 1347 (3477–10,996) |
| Calcium, mg/d | 180 | 810 ± 302 (259–2011) | |
| Milk, n/d3 | 159 | 1.5 ± 1.0 (0–4.3) | |
| Soft drink, n/d3 | 165 | 1.5 ± 1.0 (0–4.3) |
Average frequency for those mothers who reported consuming the beverage.
Diet soft drink consumption on a 1-to-9 point scale describing frequency, where 6 corresponds to 3 to 4, 355-mL (12 oz) servings/wk.
Average frequency for those daughters who reported consuming the beverage.
Eighty-two percent of mothers reported drinking milk, and 66% reported drinking nondiet soft drinks. Of the mothers who reported that they consumed milk (n = 148) and nondiet soft drinks (n = 119), the average frequency of milk intake per week was 6 medium (237 mL; 8 fl oz) servings of milk per week and the average frequency for soft drinks was 6 medium (355 mL; 12 fl oz) servings per week. In addition, 47% of mothers reported drinking diet soft drinks, where the average frequency of diet soft drink consumption was a 6 on a 9-point scale, corresponding to a frequency of three or four 12-oz servings per week. Eighty-eight percent of girls reported drinking milk, and 91% of girls reported drinking soft drinks. Girls who reported consuming those beverages drank milk (n = 159) and soft drinks (n = 165), on average, 1.5 times/d. Girls’ average daily milk intake was 314 ± 185 g, constituting ~94% of that amount reported for 3- to 5-y-old children in the Continuing Survey of Food Intake by Individuals, 1994–1996 (U.S. Department of Agriculture 1999).
Structural equation modeling was used to test a model detailing relationships among mothers’ and daughters’ milk and soft drink intakes. This model controlled for mother-daughter similarities in energy intake as well as for any influences of energy intake on mothers’ and daughters’ calcium, milk and soft drink intakes. The initial model fit the data structure well (Table 2). A nonsignificant χ2 value indicated that the initial specified model structure was not different from the underlying data structure. Furthermore, the NNFI, RM-SEA and CFI fit indices provided further evidence that the initial model had an excellent fit to the data, using generally accepted cutoffs (NNFI and CFI >0.90, RMSEA <0.05) (Byrne 1999). Modification indices from the initial model indicated that the fit of the model would be improved by including the relationship between mothers’ milk intake and daughters’ soft drink intake in the model. As a result, an adjusted model that included this relationship was tested and compared with the initial model. Comparison of the fit statistics showed a significant improvement in the fit of the model (change in χ2 = 7.22, df = 1, P < 0.01).
TABLE 2.
Fit statistics for the initial and adjusted models (see Figure 2) describing relationships among mothers’ and daughters’ intake of calcium, milk and soft drinks (n = 180)
| χ2 | df | P-value | NNFI1 | CFI2 | RMSEA3 | |
|---|---|---|---|---|---|---|
| Initial model | 24.07 | 20 | 0.24 | 0.99 | 0.99 | 0.03 |
| Adjusted model | 16.85 | 19 | 0.60 | 1.00 | 1.00 | 0.00 |
| Δχ2 | 7.22 | 1 | 0.01 |
Non-Normed Fit Index, with acceptable values >0.90.
Comparative Fit Index, with acceptable values >0.90.
Root-mean-square error of approximation, with acceptable values <0.05.
The adjusted model is presented in Figure 2. Path coefficients in this standardized solution can be interpreted as standardized regression weights, and all path coefficients in the model were statistically significant (parameter value ≥1.98 critical value) unless otherwise indicated. Mothers’ and daughters’ calcium intakes were positively associated with their frequency of milk intake and negatively associated with their frequency of soft drink consumption. In other words, mothers and daughters who drank more milk and fewer soft drinks tended to have higher calcium intakes. In addition, girls’ consumption of soft drink beverages was negatively associated with their milk intakes. In descriptive terms, daughters who drank >1 serving of soft drink beverages each day consumed 106 g less milk (234 versus 330 g, P < 0.01) and ~150 mg less calcium (744 versus 890 mg, P < 0.01) per day than did the girls who drank ≤1 serving of soft-drink beverages each day.
FIGURE 2.
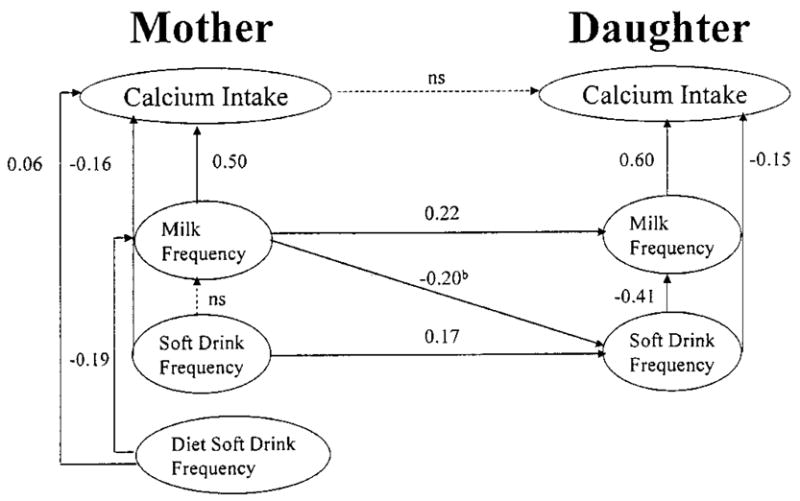
Final model with standardized path coefficients showing relationships between mothers’ and daughters’ calcium, milk and soft drink intakes (n = 180). Controlling for mother-daughter similarities in energy intake, and the influence of mother and daughter energy intakes on their calcium, milk and soft drink intakes. b Path added to model based on post hoc modification indices.
Finally, daughters’ intake of milk and soft drink were directly influenced by their mothers’ intakes of those beverages. Mothers with more frequent intakes of regular soft drink had daughters with more frequent intakes of soft drink beverages. In addition, mothers’ milk intake had a positive influence on their daughters milk intake. Post hoc modification indices showed that the fit of the model was improved by taking the negative relationship between mothers’ milk and daughters’ soft drink intakes into account; mothers who consumed milk more frequently tended to have daughters who consumed soft drinks less frequently. The adjusted model explained 84 and 12% of the variance in mothers’ calcium and milk intake and 66 and 26% of the variance in daughters’ calcium and milk intake.
DISCUSSION
Survey data indicate that milk intake among young girls decreases and soft drink intake increases, particularly carbonated beverages, from middle childhood into adolescence (Borrud et al. 1997, Troiano et al. 2000, U.S. Department of Agriculture 1999). The findings of this research are consistent with two previous studies (Guenther 1986, Harnack et al. 1999), indicating that young girls’ intake of soft drinks, including caloric carbonated and noncarbonated beverages, may displace milk from their diets. In this study, girls who drank >1 serving of soft drinks each day had calcium intakes that were >100 mg lower than the mean amount reported for 3- to 5-y-old children in CSFII, 1994–1996 (U.S. Department of Agriculture 1999). This research provides new evidence that this apparent tradeoff between milk and soft drinks in young girls’ diets reflects in part their mothers’ own beverage choices. In this study, mothers with higher calcium intakes tended to drink more milk and fewer soft drinks. In turn, these mothers had daughters who tended to drink more milk and fewer soft drinks and to have higher calcium intakes. The model tested explained the majority of variation in girls’ calcium intakes and more than a fourth of the variation in girls’ milk intakes.
Mothers’ own milk intake may serve as a protective factor for adequate calcium intake in their daughters by increasing opportunities to consume milk and decreasing opportunities to consume soft drinks. In this case, mothers’ relative preferences for milk and soft drinks may dictate her beverage choices as well as the types of beverages that she makes available to her daughter at various eating occasions. For instance, mothers who prefer milk may be less likely to buy soft drinks and less likely to offer soft drinks as options for their daughters’ snacks or meals. In addition, young girls may learn to imitate their mothers’ beverage intake patterns through the repeated experience of watching their mothers select and consume those beverages.
These findings have relevance for osteoporosis prevention because mothers’ own dietary behaviors may have direct bearing on their daughters’ consumption of calcium-rich beverages during periods of development before the attainment of peak bone mass. Retrospective reports show similarities in mother-daughter bone mineral density and lifetime milk intakes (Halioua and Anderson 1989, Ulrich 1996). In addition, calcium intake shows some tracking across childhood (Singer et al. 1995, Stein et al. 1991) and young adulthood (Teegarden et al. 1999, Welten et al. 1997), implying young girls’ beverage consumption in childhood may serve as a basis for dietary behaviors that persist into young adulthood. This research indicates that maternal influences on their daughters’ patterns of beverage intake may begin in early childhood.
Several limitations may qualify the interpretation of these results, including the use of two different dietary assessment measures to quantify mothers’ and daughters’ beverage intakes. It is likely that differences between the FFQ and dietary recall methods introduced measurement error in comparing mother and child intakes, potentially underestimating the size of those relationships. Mothers’ and daughters’ average energy and calcium intakes were roughly similar to nationwide data (Alaimo et al. 1994, McDowell et al. 1994, U.S. Department of Agriculture 1998 and 1999), however, suggesting that these measures provided reasonable estimates of group intake. Collecting dietary data solely during the summer months constitutes another potential source of bias, providing a lower estimate of milk intake and upper estimate of soft drink intake (Guenther 1986). Finally, girls’ beverage intake may represent a marker of more broad dietary behaviors that influence girls’ calcium and micronutrient intakes (Harnack et al. 1999, Johnson et al. 1998).
In conclusion, these findings indicate that mothers’ beverage choices may exert a formative environmental influence on young girls’ calcium adequacy from an early age. This study provides the first evidence that mothers’ own beverage consumption patterns may determine the extent to which young girls’ intake of milk and calcium is displaced by soft drinks. This research suggests that interventions aimed at increasing young girls’ calcium intake should target mothers’ as well as daughters’ beverage consumption. Longitudinal data are needed to evaluate the extent to which mother-daughter similarities in milk and soft drink intake contribute to calcium tracking and bone mineral density during childhood.
Footnotes
Supported, in part, by the National Dairy Council and NIH HD32973.
LITERATURE CITED
- Alaimo K, McDowell MA, Briefel RR, et al. Advance data from Vital and Health Statistics, No. 258. National Center for Health Statistics; Hyattsville, MD: 1994. Dietary Intake of Vitamins, Minerals, and Fiber of Persons Ages 2 Months and Over in the United States: Third National Health and Nutrition Examination Survey, Phase 1, 1988–1991. [PubMed] [Google Scholar]
- Albertson AM, Tobelmann RC, Marquart L. Estimated dietary calcium intake and food sources of adolescent females: 1980–92. J Adolesc Health. 1997;20:20–26. doi: 10.1016/S1054-139X(96)00179-6. [DOI] [PubMed] [Google Scholar]
- Borrud L, Wilinson EC, Mickle S. Community Nutrition Institute 1997. 1997. What we eat: U.S. Department of Agriculture survey food consumption changes; pp. 4–5. [Google Scholar]
- Byrne BM. Structural Equation Modeling with LISREL, PRELIS, and SIMPLIS: Basic Concepts, Applications, and Programming. Lawrence Erlbaum Associates; Mahwah, NJ: 1999. [Google Scholar]
- Cadogan J, Eastell R, Jones N, Barker ME. Milk intake and bone mineral acquisition in adolescent girls: randomized, controlled intervention trial. Br Med J. 1998;315:1255–60. doi: 10.1136/bmj.315.7118.1255. [DOI] [PMC free article] [PubMed] [Google Scholar]
- Chan GM. Dietary calcium and bone mineral status of children and adolescents. Am J Dis Child. 1991;145:631–634. doi: 10.1001/archpedi.1991.02160060049019. [DOI] [PubMed] [Google Scholar]
- Chumlea WC, Guo SS. Proceedings: CERIN Symposium Nutrition & Personnes Agees au Rapports Recommandes. Paris, France: 1997. Milk consumption in childhood and bone mineral density in adulthood: The FELS longitudinal study; pp. 125–133. [Google Scholar]
- Eck LH, Hackett-Renner C. Calcium intake in youth: Sex, age, and racial differences in NHANES II. Prev Med. 1992;21:473–482. doi: 10.1016/0091-7435(92)90054-l. [DOI] [PubMed] [Google Scholar]
- Fleming KH, Heimbach JT. Consumption of calcium in the U.S.: Food sources and intake levels. J Nutr. 1994;124:1426S–1430S. doi: 10.1093/jn/124.suppl_8.1426S. [DOI] [PubMed] [Google Scholar]
- Food and Nutrition Board. Dietary Reference Intakes for Calcium, Phosphorus, Magnesium, Vitamin D, and Fluoride. National Academy Press; Washington, D.C: 1999. [PubMed] [Google Scholar]
- Grove TM, Douglass JS, Heimbach JT, DiRenzo DB, Miller GD. Evaluation of maternal consumption of dairy products and its influence upon daughters’ diets. FASEB J. 1999;13:A549. [Google Scholar]
- Guenther PM. Beverages in the diets of American teenagers. J Am Diet Assoc. 1986;86:493–499. [PubMed] [Google Scholar]
- Halioua L, Anderson JJB. Lifetime calcium intake and physical activity habits: Independent and combined effects on the radial bone of healthy pre-menopausal Caucasian women. Am J Clin Nutr. 1989;39:534–41. doi: 10.1093/ajcn/49.3.534. [DOI] [PubMed] [Google Scholar]
- Hamill VV, Drizd TA, Johnson CL, Reed RB, Roche AF, Moore WM. Physical growth: National Center for Health Statistics percentiles. Am J Clin Nutr. 1979;32:607–629. doi: 10.1093/ajcn/32.3.607. [DOI] [PubMed] [Google Scholar]
- Harnack L, Stang J, Story M. Soft drink consumption among US children and adolescents: Nutritional consequences. J Am Diet Assoc. 1999;99:436–441. doi: 10.1016/S0002-8223(99)00106-6. [DOI] [PubMed] [Google Scholar]
- Johnson RK, Panely C, Wang MQ. The association between noon beverage consumption and the diet quality of school-age children. J Child Nutr Mgmt. 1998;22:95–100. [Google Scholar]
- Johnston CC, Miller JZ, Slemenda CW, Reister TK, Hui S, Christian JC, Peacock M. Calcium supplementation and increases in bone mineral density in children. N Engl J Med. 1992;327:82–87. doi: 10.1056/NEJM199207093270204. [DOI] [PubMed] [Google Scholar]
- Kristal AR, Patterson RE, Shattuck AS, Vizenor NC. Nutrient databases for food frequency questionnaires. Proceedings of the 23rd National Nutrient Databank Conference; Washington, D.C. April 16, 1999.1999. [Google Scholar]
- Lee WTK, Leung SSF, Lui SSH, Lau J. Relationship between long-term calcium intake and bone mineral content of children aged from birth to 5 years. Br J Nutr. 1993a;70:235–248. doi: 10.1079/bjn19930120. [DOI] [PubMed] [Google Scholar]
- Lee WTK, Leung SSF, Wang SH, Xu Y, Zeng W, Lau J, Oppenheimer SJ, Cheng JCY. Double-blind controlled calcium supplementation and bone mineral accretion in children accustomed to low calcium diet. Am J Clin Nutr. 1993b;70:235–248. doi: 10.1093/ajcn/60.5.744. [DOI] [PubMed] [Google Scholar]
- Lloyd T, Andon MB, Rollings N, Martel JK, Landis R, Demers LM, Eggli DF, Kieselhorst K, Kulin HE. Calcium supplementation and bone mineral density in adolescent girls. J Am Med Assoc. 1993;270:841–844. [PubMed] [Google Scholar]
- Lutz J, Tesar R. Mother-daughter pairs: spinal and femoral bone densities and dietary intakes. Am J Clin Nutr. 1990;52:872–877. doi: 10.1093/ajcn/52.5.872. [DOI] [PubMed] [Google Scholar]
- Matkovic V. Calcium and peak bone mass. J Int Med. 1992;231:151–160. doi: 10.1111/j.1365-2796.1992.tb00518.x. [DOI] [PubMed] [Google Scholar]
- Matkovic V, Ilich JZ. Calcium requirements for growth: Are current recommendations adequate? Nutr Rev. 1993;51:171–180. doi: 10.1111/j.1753-4887.1993.tb03097.x. [DOI] [PubMed] [Google Scholar]
- McDowell MA, Briefel RR, Alaimo K, et al. Advance data from Vital and Health Statistics No. 255. National Center for Health Statistics; Hyattsville, MD: 1994. Energy and Macronutrient Intakes of Persons Ages 2 Months and Over in the United States: Third National Health and Nutrition Examination Survey, Phase 1, 1988–91. [PubMed] [Google Scholar]
- Murphy S, Khaw KT, May H, Compston JE. Milk consumption and bone mineral density in middle aged and elderly women. Br Med J. 1994;308:939–941. doi: 10.1136/bmj.308.6934.939. [DOI] [PMC free article] [PubMed] [Google Scholar]
- NIH Consensus Development Conference. Optimal Calcium Intake National Institutes of Health Consensus Development Conference statement; June 6–8, 1994.1994. [Google Scholar]
- National Research Council, Food and Nutrition Board. Recommended Dietary Allowances. 10. National Academy Press; Washington, D.C: 1989. [Google Scholar]
- Patterson RE, Kristal AR, Carter RA, Fels-Tinker L, Bolton MP, Agurs-Collins T. Measurement characteristics of the Women’s Health Initiative Food Frequency Questionnaire. Ann Epidemiol. 1999;9:178–187. doi: 10.1016/s1047-2797(98)00055-6. [DOI] [PubMed] [Google Scholar]
- Putman J, Gerrior S. Americans consuming more grains, and vegetables, less saturated fat. Food Consumpt. 1997:2–12. [Google Scholar]
- Recker RR, Davies M, Hinders SM, Heaney RP, Stegman MR, Kimmel DB. Bone gain in young adult women. J Am Med Assoc. 1992;268:2403–2408. [PubMed] [Google Scholar]
- Sentipal JM, Wardlaw GM, Mahan J, Matkovic V. Influence of calcium intake and growth indexes on vertebral bone mineral density in young females. Am J Clin Nutr. 1991;54:425–428. doi: 10.1093/ajcn/54.2.425. [DOI] [PubMed] [Google Scholar]
- Singer MR, Moore LL, Garrahie EJ, Ellison RC. The tracking of nutrient intake in young children: The Framingham Children’s Study. Am J Public Health. 1995;85:1673–1677. doi: 10.2105/ajph.85.12.1673. [DOI] [PMC free article] [PubMed] [Google Scholar]
- Soroko S, Hobrook TL, Edelstein S, Barret-Connor E. Lifetime milk consumption and bone mineral density in older women. Am J Public Health. 1994;84:1319–1322. doi: 10.2105/ajph.84.8.1319. [DOI] [PMC free article] [PubMed] [Google Scholar]
- Stein AD, Shea S, Basch CE, Contento IR, Zybert P. Variability and tracking of nutrient intakes of preschool children based on multiple administrations of the 24-hour dietary recall. Am J Epidemiol. 1991;134:1427–1437. doi: 10.1093/oxfordjournals.aje.a116048. [DOI] [PubMed] [Google Scholar]
- Teegarden D, Lyle RM, Proulx WR, Johnston CC, Weaver CM. Previous milk consumption is associated with greater bone density in young women. Am J Clin Nutr. 1999;69:1014–1017. doi: 10.1093/ajcn/69.5.1014. [DOI] [PubMed] [Google Scholar]
- Troiano RP, Briefel RR, Carroll MD, Bialostosky K. Energy and fat intake of children and adolescents in the United States: Data from the National Health and Nutrition Examination Surveys. Am J Clin Nutr. 2000;72(5 Suppl):1343S–1353S. doi: 10.1093/ajcn/72.5.1343s. [DOI] [PubMed] [Google Scholar]
- Ulrich CM, Georgiou CC, Snow-Harter CM, Gillis DE. Bone mineral density in mother-daughter pairs: Relations to lifetime exercise, lifetime milk consumption, and calcium supplements. Am J Clin Nutr. 1996;63:72–79. doi: 10.1093/ajcn/63.1.72. [DOI] [PubMed] [Google Scholar]
- U.S. Department of Agriculture, Agricultural Research Service. Nationwide Food Surveys Report No. 96–2. 1998. Food and Nutrient Intakes by Individuals in the United States, by Sex and Age, 1994–1996; p. 197. [Google Scholar]
- U.S. Department of Agriculture, Agricultural Research Service. Food and nutrient intakes by children, 1994–96, online 1999 [Google Scholar]
- Welten DC, Kemper HCG, Post GB, Staveren WAV. A meta-analysis of the effect of calcium intake on bone mass in young and middle aged females and males. J Nutr. 1995;125:2802–2813. doi: 10.1093/jn/125.11.2802. [DOI] [PubMed] [Google Scholar]
- Welten DC, Kemper HCG, Post GB, Staveren WAV, Twisk JWR. Longitudinal development and tracking of calcium and dairy intake from teenage to adult. Eur J Clin Nutr. 1997;51:612–618. doi: 10.1038/sj.ejcn.1600454. [DOI] [PubMed] [Google Scholar]
- Wyshak G. Teenaged girls, carbonated beverage consumption, and bone fractures. Arch Pediatr Adolesc Med. 2000;154:610–613. doi: 10.1001/archpedi.154.6.610. [DOI] [PubMed] [Google Scholar]
- Wyshak G, Frisch RE. Carbonated beverages, dietary calcium, the dietary calcium/phosphorus ration, and bone fractures in girls and boys. J Adolesc Health. 2000;15:210–215. doi: 10.1016/1054-139x(94)90506-1. [DOI] [PubMed] [Google Scholar]