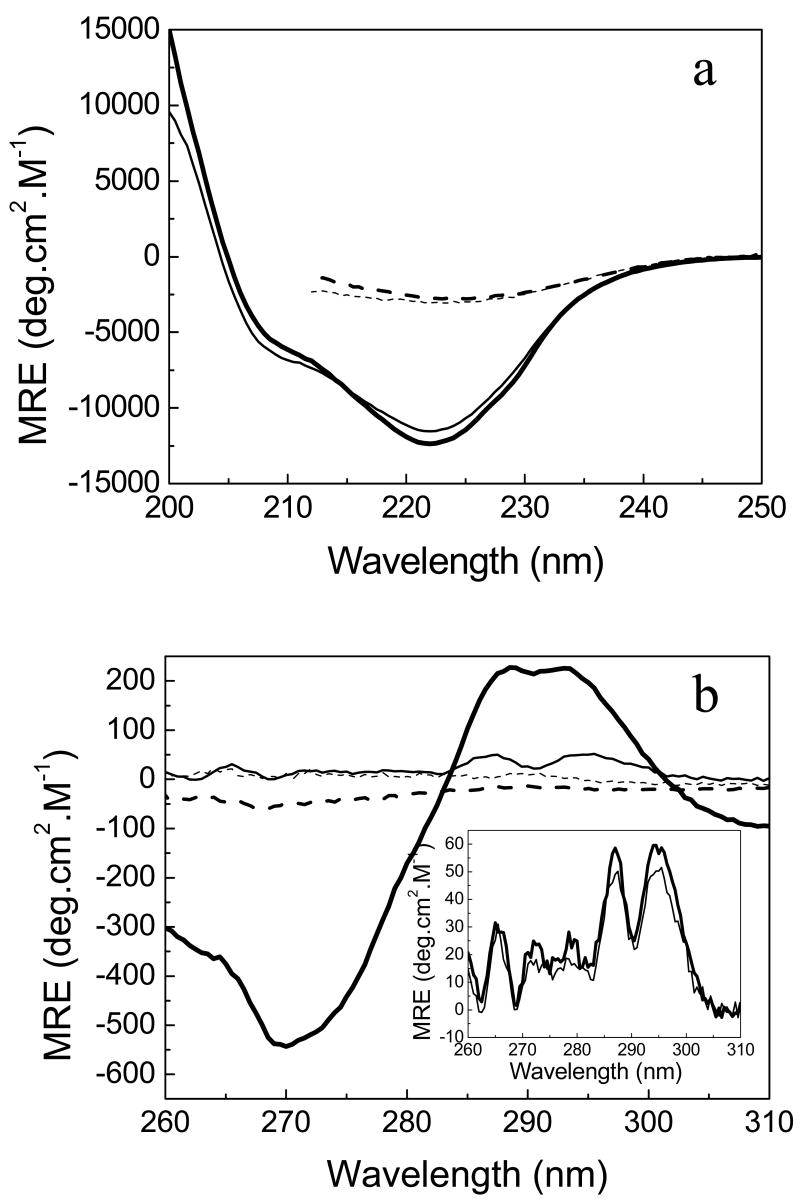
FIGURE 1.
Spectroscopic comparison of H. pylori apo (thin lines) and holoflavodoxin (thick lines) in EPPS 50 mM, pH 9.0 under native conditions, at 25°C (continuous lines) and thermally-unfolded at 90 °C (dashed line). Far-UV circular dichroism (a) and near-UV CD (b). The insert in (b) compares the near-UV CD spectrum of apoflavodoxin at pH 9 (thin line) with that at pH 7.0 (thick line). The different spectra of both the apoprotein and holoprotein at pH 7.0 are very similar to the corresponding ones at pH 9.0 (not shown).

