

A crystal of the N-terminal domain of a plant NADPH oxidase was obtained and X-ray diffraction data were collected on a synchrotron beamline to a maximum resolution of 2.4 Å.
Keywords: NADPH oxidases, EF-hand motifs, Rac small GTPase
Abstract
Respiratory burst oxidase homologue (Rboh), which is found in the plasma membrane, is a generator of reactive oxygen species (ROS) in plants. Many studies have indicated that the ROS produced by Rboh play critical roles in various cellular activities, including plant defence against pathogens. Crystals of the N-terminal domain of Oryza sativa RbohB (OsRbohB) have been obtained. The crystals belonged to space group P212121, with unit-cell parameters a = 60.4, b = 72.2, c = 118.9 Å. An intensity data set was collected to 2.4 Å resolution.
1. Introduction
In plants, the reactive oxygen species (ROS) produced by NADPH oxidase play critical roles in various cellular activities (Foreman et al., 2003 ▶; Kwak et al., 2003 ▶; Sagi et al., 2004 ▶), including defence against pathogens (Torres et al., 2002 ▶; Yoshioka et al., 2003 ▶). The rapid increase in oxygen consumption to generate ROS is called a respiratory burst. A plant NADPH oxidase named Rboh (respiratory burst oxidase homologue) is a homologue of the catalytic subunit known as NOX2/gp91phox (NADPH oxidase 2/glycoprotein 91 kDa phagocyte oxidase) of mammalian phagocyte NADPH oxidase (Groom et al., 1996 ▶; Keller et al., 1998 ▶). The phagocyte NADPH oxidase consists of two plasma-membrane proteins, gp91phox and p22phox, and forms a multi-protein complex containing cytosolic regulatory factors (p47phox, p67phox and p40phox) and the small GTPase Rac (Babior, 2004 ▶). In sharp contrast, no homologues of these regulatory factors apart from Rac have been found in plants (Gu et al., 2004 ▶; Torres & Dangl, 2005 ▶). Furthermore, unlike the mammalian gp91phox, Rboh possesses an extended N-terminal domain including two EF-hand motifs (EF1 and EF2). In tomato and tobacco, the activity of Rboh is directly regulated by Ca2+ through the N-terminal domain (Sagi & Fluhr, 2001 ▶). Recently, it has been shown that Ca2+ binding to the EF-hand motifs of the N-terminal domain is required for the activation of ROS production by Arabidopsis thaliana RbohC (AtRbohC/RHD2; Takeda et al., 2008 ▶). An Oryza sativa homologue of mammalian Rac (OsRac1) functions as a positive regulator of NADPH oxidase activation (Kawasaki et al., 1999 ▶) and recent work has clearly demonstrated that the GTP-bound form of OsRac1 interacts directly with the N-terminal domain of OsRbohB (Wong et al., 2007 ▶). These studies suggest that the N-terminal domain plays a key role in the regulation of Rboh. Crystal structure analyses of Rboh are therefore of great importance in order to better understand the function of Rboh in signal transduction in plants.
However, no structural studies of Rboh have been conducted to date. Here, we report the crystallization and preliminary crystallographic study of the N-terminal domain of OsRbohB as a first step toward understanding the regulatory mechanism in atomic detail.
2. Materials and methods
2.1. Protein expression
The N-terminal domain of OsRbohB composed of residues 138–313 (OsRbohB138–313) contains two EF-hand motifs and has been shown to interact with the GTP-bound form of Rac (Wong et al., 2007 ▶); therefore, this region was selected for crystallographic analysis. The cDNA coding for OsRbohB138–313 was subcloned into pET-32c plasmid (Novagen). OsRbohB138–313 was expressed in Escherichia coli strain BL21 (DE3) Codon Plus RIL (Stratagene) as a thioredoxin-fused protein with a 6×His tag. Cells were grown at 310 K in Luria–Bertani (LB) medium containing 0.2%(w/v) glucose, 50 µg ml−1 ampicillin and 34 µg ml−1 chloramphenicol. When the absorbance at 660 nm (OD660) of the cell culture reached 0.5, isopropyl β-d-1-thiogalactopyranoside (IPTG) was added to a concentration of 0.5 mM to induce expression. Cells were grown for an additional 3 h at 298 K following IPTG induction and were harvested by centrifugation at 5000g for 10 min at 277 K. The cell pellet was stored at 193 K.
2.2. Protein preparation
Cells expressing OsRbohB138–313 were suspended in buffer I [50 mM HEPES–NaOH pH 7.5 containing 400 mM KCl, 2 mM CaCl2, 10%(v/v) glycerol and 7 mM 2-mercaptoethanol] and then disrupted by sonication on ice. The cell lysate was clarified by centrifugation at 15 000 rev min−1 (Hitachi Himac 20B2, rotor 14) for 30 min at 277 K. The supernatant was loaded onto a DEAE Sepharose Fast Flow (GE Healthcare) column and the flowthrough fraction was loaded onto a Ni–NTA agarose (Qiagen) column. The column was washed with buffer I containing 10 mM imidazole and equilibrated with buffer II (20 mM HEPES–NaOH pH 7.5 containing 50 mM KCl, 2 mM CaCl2 and 7 mM 2-mercaptoethanol). The fusion protein was cleaved using EnterokinaseMax (Invitrogen) for 3 h at 300 K on the Ni–NTA agarose column. The cleaved protein was eluted from the column, loaded onto a HiTrapQ HP column (GE Healthcare) equilibrated with buffer II and eluted with a KCl linear gradient. As the final step of purification, gel filtration was performed using Superdex75 (GE Healthcare) with buffer III [5 mM HEPES–NaOH pH 7.5 containing 50 mM KCl, 2 mM CaCl2 and 1 mM dithiothreitol (DTT)]. The molecular weight of OsRbohB138–313 was estimated from a calibration curve.
Purified protein was concentrated to 16 mg ml−1 using Amicon Ultra centrifugal filter devices (10 000 Da molecular-weight cutoff; Millipore). The homogeneity of the purified protein was confirmed by SDS–PAGE (Fig. 1 ▶). The concentrated protein solution was divided into 20–40 µl aliquots in micro-tubes and immediately frozen in liquid nitrogen. The frozen protein was stored at 193 K until use.
Figure 1.
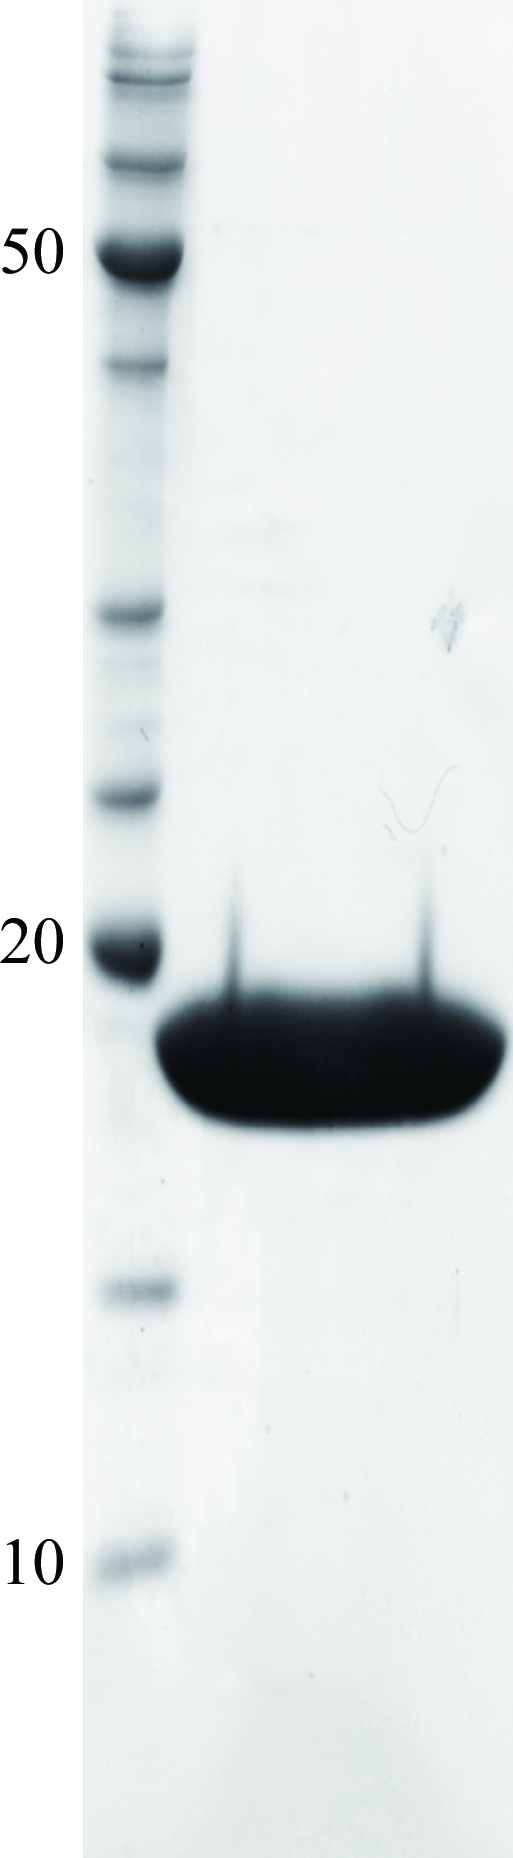
An SDS–PAGE gel of purified OsRbohB138–313. Molecular-weight markers (kDa) are shown on the left.
2.3. Crystallization
Initial screening of crystallization conditions was carried out by the hanging-drop vapour-diffusion method using commercial crystallization screening kits from Hampton Research. The protein concentration in the initial screening was 10 mg ml−1. Thin plate-shaped crystals of OsRbohB138–313 were obtained within a few weeks in several conditions from the PEG/Ion Screen (Hampton Research) at 293 K. To optimize the crystallization conditions, the pH range, the molecular weight of the polyethylene glycol (PEG), the salt used and the protein concentration were varied. Finally, crystals suitable for X-ray experiments were obtained using 0.1 M HEPES–NaOH buffer pH 7.0 containing 0.6 M sodium thiocyanate, 13%(w/v) PEG 8000 and 10 mM DTT. The optimized protein concentration was 16 mg ml−1.
2.4. X-ray data collection
Crystals for X-ray diffraction studies were transferred stepwise into a cryoprotective solution consisting of 0.1 M HEPES–NaOH buffer pH 7.0 containing 0.6 M sodium thiocyanate, 13%(w/v) PEG 8000, 10 mM DTT and 30%(v/v) ethylene glycol for flash-cooling. X-ray diffraction data were collected from the crystal at 100 K using an ADSC Quantum315 detector installed on beamline BL41XU at SPring-8 (Harima, Japan). All data were processed using the HKL-2000 program suite (Otwinowski & Minor, 1997 ▶).
3. Results and discussion
From the SDS–PAGE gel, the purity of the protein was sufficient for crystallization (Fig. 1 ▶ a). The theoretical molecular weight of OsRbohB138–313 containing three extra residues (Ala-Met-Gly) originating from the pET-32c vector is 19 850.58 Da. The purified protein was eluted from a gel-filtration column at a position corresponding to the homodimer (molecular weight of ∼39.3 kDa; Fig. 2 ▶) which is virtually the same as the calculated value (MW 39.7 kDa). The elution profile strongly suggests that OsRbohB138–313 forms a homodimer.
Figure 2.

Elution profile of gel filtration using Superdex75. The molecular weight of OsRbohB138–313 was estimated to be 39.3 kDa from a calibration curve. Bars indicate the positions of molecular-weight markers (bovine serum albumin, 66.2 kDa; ovalbumin, 44.0 kDa; chymotrypsinogen A, 19.9 kDa; ribonuclease A, 15.4 kDa).
The crystal obtained from the optimized crystallization conditions (Fig. 3 ▶) was used for X-ray diffraction study. This crystal belonged to space group P212121, with unit-cell parameters a = 60.4, b = 72.2, c = 118.9 Å. It seems probable that the asymmetric unit of the crystal contains two molecules of OsRbohB138–313 with a V M value of 3.27 Å3 Da−1 (Matthews, 1968 ▶), although the self-rotation function shows no clear peaks. This corresponds to 62.3% solvent content by volume, which is reasonable for protein crystals. In contrast, assumption of two dimers in the asymmetric unit gave a V M value of 1.6 Å3 Da−1, which is low for protein crystals, but we could not estimate the number of molecules. A full set of X-ray diffraction data was collected to 2.4 Å resolution with a completeness of 97.7%. The crystallographic data and intensity data-processing statistics are summarized in Table 1 ▶. The crystal diffracts beyond 2.4 Å resolution (Fig. 4 ▶), but the diffraction data were processed to 2.4 Å resolution as the completeness was rather low for the outer shell above 2.4 Å. As OsRbohB138–313 shows 17% sequence identity to human calcineurin B (PDB code 1aui; Kissinger et al., 1995 ▶), molecular replacement using human calcineurin B as a search model has been attempted, but so far without success. Structural analysis by the multi-wavelength anomalous diffraction method using selenomethionine-labelled protein is in progress.
Figure 3.

A crystal of OsRbohB138–313. The scale bar indicates 0.2 mm.
Table 1. X-ray diffraction data of the N-terminal domain of OsRbohB.
Values in parentheses are for the outer resolution shell (2.49–2.40 Å).
| Beamline (SPring-8) | BL41XU |
| Detector | ADSC Quantum315 |
| Wavelength (Å) | 1.0000 |
| Temperature (K) | 100 |
| Oscillation range (°) | 180 (180 × 1° images) |
| Exposure time (s) | 5.0 |
| Space group | P212121 |
| Unit-cell parameters (Å) | a = 60.4, b = 72.2, c = 118.9 |
| Resolution range (Å) | 50.0–2.4 |
| No. of reflections (total/unique) | 137001/20590 |
| Data completeness (%) | 97.7 (86.0) |
| Average I/σ(I) | 16.3 (6.0) |
| Rmerge† (%) | 4.8 (23.4) |

 , where I(hkl) is the intensity of reflection hkl,
  is the sum over all measured reflections and
  is the sum over i measurements of a reflection.
Figure 4.

Diffraction pattern from a OsRbohB138–313 crystal. The 2.4 Å resolution shell is indicated by a circle. A close-up view around 2.4 Å is represented at the lower left.
Acknowledgments
We thank the beamline staff for data collection at SPring-8. We also thank MEXT for support through a Target Proteins Research Program grant and Grants-in-Aid for Scientific Research.
References
- Babior, B. M. (2004). Curr. Opin. Immunol.16, 42–47. [DOI] [PubMed]
- Foreman, J., Demidchik, V., Bothwell, J. H. F., Mylona, P., Miedema, H., Torres, M. A., Linstead, P., Costa, S., Brownlee, C., Jones, J. D. G., Davies, J. M. & Dolan, L. (2003). Nature (London), 422, 442–446. [DOI] [PubMed]
- Groom, Q. J., Torres, M. A., Fordham-Skelton, A. P., Hammond-Kosack, K. E., Robinson, N. J. & Jones, J. D. G. (1996). Plant J.10, 515–522. [DOI] [PubMed]
- Gu, Y., Wang, Z. & Yang, Z. (2004). Curr. Opin. Plant Biol.7, 527–536. [DOI] [PubMed]
- Kawasaki, T., Henmi, K., Ono, E., Hatakeyama, S., Iwano, M., Satoh, H. & Shimamoto, K. (1999). Proc. Natl Acad. Sci. USA, 96, 10922–10926. [DOI] [PMC free article] [PubMed]
- Keller, T., Damude, H. G., Werner, D., Doerner, P., Dixon, R. A. & Lamb, C. (1998). Plant Cell, 10, 255–266. [DOI] [PMC free article] [PubMed]
- Kissinger, C. R. et al. (1995). Nature (London), 378, 641–644. [DOI] [PubMed]
- Kwak, J. M., Mori, I. C., Pei, Z. M., Leonhardt, N., Torres, M. A., Dangle, J. L., Bloom, R. E., Bodde, S., Jones, J. D. G. & Schroeder, J. I. (2003). EMBO J.22, 2623–2633. [DOI] [PMC free article] [PubMed]
- Matthews, B. W. (1968). J. Mol. Biol.33, 491–497. [DOI] [PubMed]
- Otwinowski, Z. & Minor, W. (1997). Methods Enzymol.276, 307–326. [DOI] [PubMed]
- Sagi, M., Davydov, O., Orazova, S., Yesbergenova, Z., Ophir, R., Stratmann, J. W. & Fluhr, R. (2004). Plant Cell, 16, 616–628. [DOI] [PMC free article] [PubMed]
- Sagi, M. & Fluhr, R. (2001). Plant Physiol.126, 1281–1290. [DOI] [PMC free article] [PubMed]
- Takeda, S., Gapper, C., Kaya, H., Bell, E., Kuchitsu, K. & Dolan, L. (2008). Science, 319, 1241–1244. [DOI] [PubMed]
- Torres, M. A. & Dangl, J. L. (2005). Curr. Opin. Plant Biol.8, 397–403. [DOI] [PubMed]
- Torres, M. A., Dangl, J. L. & Jones, J. D. G. (2002). Proc. Natl Acad. Sci. USA, 99, 517–522.
- Wong, H. L., Pinontoan, R., Hayashi, K., Tabata, R., Yaeno, T., Hasegawa, K., Kojima, C., Yoshioka, H., Iba, K., Kawasaki, T. & Shimamoto, K. (2007). Plant Cell, 19, 4022–4034. [DOI] [PMC free article] [PubMed]
- Yoshioka, H., Numata, N., Nakajima, K., Katou, S., Kawakita, K., Rowland, O., Jones, J. D. G. & Doke, N. (2003). Plant Cell, 15, 706–718. [DOI] [PMC free article] [PubMed]