

Abstract
The cellular DNA damage response (DDR) entails the activation of ATM, ATR and/or DNA PK protein kinases that causes modifications of proteins including Chk1, Chk2 and 53BP1, aggregation of DDR proteins into foci, and activation of p53. The DDR is thought to be required for initiation and maintenance of cellular senescence. Potentially senescent cells with DNA damage foci occur in large numbers in vivo with many diseases, but, with the exception of mammalian dermis, there is little evidence for that with normal aging. After experimental induction of cellular senescence in the livers of juvenile mice, there was robust expression of DDR markers in hepatocytes at 1 week; however, by 7 weeks, activation of ATM/ATR kinase targets was limited, although cells with DNA damage foci were present. An analysis of hepatocytes of aged, 22-month-old mice, not experimentally exposed to genotoxins, showed limited activation of ATM/ATR targets, though high numbers of cells with DNA damage foci were found, similar to that seen many weeks after artificial senescence induction in young mice. Based on senescence heterochromatin and SA β Gal assays of the 22-month-old mouse liver, more than 20% of hepatocytes were potentially senescent, though only some components of the DDR were enriched.
Keywords: Cellular senescence, aging, ATM/ATR, 53BP1, hepatocytes, DNA damage foci
1. Introduction
Cellular senescence is an irreversible block to cell cycle entry and cell proliferation that is defined by an inability of cells to enter S phase even under ideal conditions (Cristofalo et al., 2004; Campisi, 2005). It has been shown to block primary cells from unlimited proliferation in vitro (Wright and Shay, 2002). One way that cellular senescence may contribute to the aging phenotype is if aging organs accumulate senescent cells that are altered with respect to normal function and lack the ability to respond to stress (including proliferation when required) (Holliday, 1995; Hornsby, 2001; Campisi, 2005). If enough of these cells are present, it might result in the reduced fitness seen with aging. A key component of this model is that substantial numbers of senescent cells should be present in tissues with aging, without, or prior to, pathology.
The DNA damage response (DDR) is a fundamental part of senescence, whether induced spontaneously by a gradual replication dependent telomere attrition, or by entry into a “stress-induced senescence-like arrest” due to oxidative damage, direct DNA damage, or inappropriate oncogene activation (d'Adda di Fagagna et al., 2003; Takai et al., 2003; Sedelnikova et al., 2004; von Zglinicki et al., 2005; Herbig and Sedivy, 2006; Collado et al., 2007). The DDR consists of the early activation of a series of proteins starting with, and depending on, the phosphatidyl inositol 3-kinase-like kinases (PIKKs) ATM, ATR, and possibly DNA-PK. Phosphorylation of a set of ATM/ATR target proteins results in the formation of microscopic foci consisting of large accumulations of proteins such as 53BP1, H2AX gamma, and phospho ATM itself near the site of the break. Additional regulatory proteins are activated, such as Chk1, Chk2, and p53, which can be found throughout the nucleus. The DDR proteins serve to sense the break, amplify the DNA damage signal, and formulate a cellular response (repair, cell death, and/or senescence). It has been proposed that the detection of cells with a permanently maintained active DDR would be an indicator of senescence (von Zglinicki et al., 2005). An examination of cells in primates has shown an age-related increase in skin fiboblasts, but not muscle myocytes, with active ATM checkpoint kinase and DNA damage foci (Jeyapalan et al., 2007). Cells with similar markers increase early in the neoplastic process (Bartkova et al., 2005; Chen et al., 2005; Gorgoulis et al., 2005; Jeyapalan et al., 2007). With the exception of gamma H2AX, the activation of DDR proteins is seen only at very low levels in tissues in young rodents and primates (Sedelnikova et al., 2004; Jeyapalan et al., 2007). One caveat to this assay is that in vitro studies have shown a loss of DNA damage foci in cells weeks to months after senescence occurred specifically in two strains of fibroblasts as they entered into a so-called ‘deep senescent’ state (Bakkenist et al., 2004; Chen and Ozanne, 2006).
Additional methods to monitor senescence in individual cells include assays of the senescence-associated heterochromatin formation (SAHF) that occur in senescent cells visualized after DAPI staining. These areas of condensed chromatin typically consist of whole chromosomes with high concentrations of heterochromatin-associated proteins such as Histone H3 (trimethyl K9) and Hp1 alpha (Narita et al., 2003; Adams, 2007). Though these changes are well defined in vitro in certain human cells, they are by no means uniform even within a single cell type (Narita et al., 2003). Preliminary work suggests that SAHF occur in senescent murine cells, but care must be taken to differentiate them from the heterochromatin of satellite DNA repeats that occurs even in proliferating murine cells (Guenatri et al., 2004; Braig et al., 2005; Adams, 2007). The enrichment in cell cycle inhibitory proteins, such as p21 and p16, is also associated with senescence (Herbig and Sedivy, 2006; Collado et al., 2007). While overall p16 mRNA has been rigorously shown to increase with aging, there is less evidence that the enrichment of the protein can be used to identify individual senescent murine cells in vivo (Collado et al., 2007; Bartkova et al., 2005). SA β Gal, a lysosomal enzymatic activity increased in senescent cells in vitro kept under optimal growth conditions, is visualized as a blue peri-nuclear staining that correlates with cellular senescence when assayed at pH 6.0. Large numbers of SA β Gal positive cells are seen in vivo with disease (such as hepatitis, athersclerosis, kidney fibrosis, carcinogenesis, prostatic hyperplasia) but the accumulations seen with old age are almost always minimal (Dimri et al., 1995; Melk et al., 2003; Cristofalo, 2005; Collado et al., 2007). While SA β Gal is not universally accepted as a marker of senescence under all conditions there is a good understanding of the assay’s limitations in vitro (Cristofalo, 2005; Severino et al., 2000; Yang et al., 2005).
There is wide consensus that senescent cells accumulate in vivo with pathology, but there is much less evidence that they accumulate above extremely low levels with normal aging (Dimri et al., 1995; Melk et al., 2003; Collado et al., 2007). The liver is no exception. That SA β Gal positive cells accumulate with aging in the unperturbed healthy livers of normal (and in the case of mice, wild type) old subjects is not supported by most studies (Krishnamurthy et al., 2004), though they certainly accumulate with diseases such as cancer and cirrhosis. It is not clear how readily hepatoyctes do senesce. While DNA damage signals in the form of telomere deprotection induce senescence in proliferating liver hepatocytes, they may lack this property in nonproliferating adult liver hepatocytes (Lechel et al., 2005; Lazzerini Denchi et al., 2006). Changes in the liver and liver hepatocytes, even without the presence of overt disease, have long been known to occur with old age. These changes include decreases in liver size and numbers of hepatocytes, with increased average ploidy of the remaining hepatocytes (Gupta, 2000). While the turnover of liver hepatocytes is normally slow in the adult, it can become rapid in response to injury. In old organisms, the ability of the liver to regenerate is reduced; the process takes longer and involves fewer cells (Stocker and Heine, 1971; Gupta, 2000). However, major changes also occur in hepatocytes as early as young adulthood, such as the first accumulation of polyploid cells and the loss of extensive replicative capacity of the cells when plated in vitro. To characterize cells with an activated DDR in this organ, we used a single exposure to juvenile mice of aminoazotoluene (AAT), a DNA alkylating agent that is activated in liver hepatocytes (Zimmerman, 1999). In situ studies on tissue sections revealed that 1 week after induction of hepatoycte senescence, many DNA damage/senescence markers were enriched. By 7 weeks post treatment, many cells still contained 53BP1/ phospho ATM foci, though on average the foci were reduced in intensity for the phospho ATM and an additional subset of activated ATM/ATR substrates, and the cells lacked activated Chk2 (T77) and p53 (S18). We saw similar reductions in these ATM/ATR targets 7 weeks after a single exposure to a second DNA damaging agent, mitomycin C. Finally, in old adult (22-month-old mice), but not young adult (4-month-old mice), high numbers of cells with the same subset of enriched DDR markers were found. This indicated that potentially senescent cells accumulated in the murine liver with aging but were enriched for only a subset of DDR-linked proteins or protein modifications.
2. Experimental procedures
2.1 Mice
Eight to eleven-day-old F1 mice from C57BL/6, obtained from the National Institute of Aging, Aged Rodent Colonies (Bethesda, MD), were injected intraperitoneally with AAT (Sigma-Aldrich; St. Louis, MO) at 2 mg/Kg body weight in corn oil. Mitomycin C (Sigma-Aldrich) was injected under a similar protocol at 2.5 mg/Kg body weight in PBS. Control gender-matched litter mates were injected with corn oil or PBS. The pharmacokinetics for clearance of AAT are not known with certainty, while mitomycin C and its active metabolites are cleared with a half life of under 1 hour (Dorr, 1988). Female C57BL/6 mice (4- and 22-months old) were allowed to acclimate at least 1 week prior to usage. All procedures were done within the guidelines of the Animal Research Committee at the University of Illinois at Chicago and the "Principles of laboratory animal care" (NIH publication No. 86-23, revised 1985).
Culture of primary hepatocytes
Primary hepatocytes from mice of various ages were isolated by a standard two-step in situ collagenase perfusion procedure using Liberase III (Roche Diagnostics; Indianapolis, IN) instead of collagenase, followed by two 50G centrifugation steps and sedimentation in 45% percoll (Roche Diagnostics) to isolate viable hepatocytes (Kao et al., 1996; Bahjat et al., 2000). Cell viability was routinely >85% by trypan blue dye exclusion and successful cell plating occurred with the majority of isolated hepatocytes (data not shown). Cells were given 18 hours to attach, then kept in Dulbecco's Modified Eagle Medium/F12 with dexamethasone (50 nanomolar) (Sigma-Aldrich), epidermal growth factor (25 ng/ml; BD Biosciences; San Diego, CA), ITS+ (BD Biosciences): Insulin (6.25 ug/ml), transferrin (6.25 ug/ml), selenious acid (6.25 ng/ml), bovine serum albumin (1.25 mg/ml), linoleic acid (5.35 ug/ml) and penicillin/streptomycin as described earlier (Kao et al., 1996; Lazaro et al., 2003). Medium was replaced daily.
Autoradiographic analysis of S phase index
Twenty-four hours prior to harvest, cells were placed in growth medium with 2 µCi/ml [3H]thymidine; at the time of harvest, cells were fixed by incubation for 2 minutes with 0.5% glutaraldehyde in PBS. Wells of the plates were coated with NTB-2 emulsion (Kodak, Rochester, NY) and exposed for 5 days, then developed for autoradiography. The number of hepatocytes incorporating [3H]thymidine was determined by counting cells with darkened nuclei.
SA β Gal Activity
This hybrid assay took advantage of two facts: (1) the SA β Gal assay works best in the controlled conditions of cell culture where cell density and growth factors can be adjusted (Severino et al., 2000; Satyanarayana et al., 2004), and (2) isolation of viable hepatocytes with the two step collagenase perfusion procedure is efficient, with nearly 50% of the original isolated liver hepatocytes producing well separated, viable adherent cells in culture (Puviani et al., 1998)(data not shown). Monolayers of cells fixed as described above were stained for SA β Gal (Dimri et al., 1995). Positive cells were counted by examining >100 cells from at least 3 mice per assay. Care was taken to use cells at equal plated densities when comparing both S phase index and SA β Gal activity of hepatocytes from test and control mice (Yang and Hu, 2005). The initial time point, for hepatocytes from adult mice, is prior to the first wave of S phase to minimize senescence initiation in vitro.
Immunohistochemistry assays
To detect DNA damage foci, frozen 5-micron liver sections were rapidly transferred to slides after sectioning, then immediately fixed in 2% paraformaldehyde PBS for 20 minutes, and then prepared as described (Herbig et al., 2006). Antibodies were used at the following dilutions, anti-phospho p53 (S15) and anti ATM/ATR phosphorylated consensus target sequence (p)S/TQ (Cell Signaling; Danvers, MA: 1:50 and 1–200), anti 53BP-1 (two separate antibodies raised against separate regions of the protein (Novus Biologicals; Littleton, CO; 100–305; 1–2000; and 100–304; 1–1000) and anti-phospho Chk2 (T68) (Abcam; Cambridge, UK: 1–200), all rabbit antibodies. Anti-(p)S/TQ reacts with a large group of putative ATM/ATR targets to different degrees, showing weak affinity to phospho-ATM (S1987). The specificity was verified by blockage with oligopeptides bearing the antigenic sequences. Anti-phospho ATM (S1987) (Rockland Immunochemicals, Gilbertsville, PA; 1:800) was a mouse antibody. We were limited in our assays to antibodies shown to cross react with murine proteins and to produce low background staining (tested p16 antisera did not meet these criteria). SAHF assays used anti-Histone H4 (tri methyl K20) (ab9053, 1–1000) and anti-Histone H3 (tri methyl) K8 (ab8898, 1–2000) obtained from (Abcam; Cambridge, UK). Anti-rabbit and anti-mouse secondary antibodies conjugated to Cy-3 were obtained from Jackson Immunoresearch (West Grove, PA). Prior to mouse primary antibody application, tissues were first blocked with 1% goat anti-mouse FAB (Jackson Immunoresearch) followed by incubation with 4% BSA. Slides were counterstained with 0.2 ug/ml 4’,6- diamidino-2-phenylindole (DAPI) for 2 minutes prior to mounting in mowiol (Calbiochem; San Diego, CA) with 2% 1,4 diazobicyclo[2,2,2]octane (Sigma-Aldrich).
Fluorescent 400x images were typically collected immediately after the assay. Foci associated nuclei and total nuclei were counted using Image Pro Plus software (MediaCybernetics, Bethesda, MD). Three to four mice were used for each time point and 300 to 500 nuclei were counted for each subject. Relative fluorescence intensity of foci in images was quantitated using the density measurement of the Image Pro Plus software with subtraction of local background levels. Four to seven mice were studied per time point with 8 to 18 53BP1/phospho ATM foci scored per mouse. Minimally exposed images were used. The student t-test was used for statistical comparisons for these and other experiments‥
For double labeling with anti-phospho ATM (S1987) and anti-53BP1 antibodies, sections were prepared as described above, first labeling with the anti-phospho-ATM (S1987) and Cy-3 secondary antibody as above, then incubated with 4% BSA, followed by anti-53BP1 and then by Alexa 488 conjugated goat anti-rabbit antibody (Invitrogen; Carlsbad, CA; 1:200). All secondary antibodies were pre-adsorbed to reduce cross reactivity as verified by negative control experiments.
3. Results
3.1 Enrichment of DNA damage response protein markers with aging and after exposure to DNA damaging agents in vivo
To identify hepatocytes in vivo with long-term changes after a transient exposure to DNA damaging agents, young mice were given a single exposure to the DNA damaging agent, AAT, an azo compound that is activated in liver hepatocytes to become an alkylating agent that can induce cellular senescence in vitro (Zimmerman, 1999), data not shown). Frozen liver tissue sections contained nuclear DNA damage foci at the earliest time point, 2.5 days post exposure (Supp. Fig. 1). Our interest is in what happens after the DNA damage is done, so we focused on time points 1 week post-exposure, when it is more likely the AAT is cleared or inactivated. As shown, simultaneous detection of 53BP1 and phospho ATM after AAT exposure revealed elevated levels of nuclear foci containing both these proteins at 1 and 3 weeks after genotoxin exposure (Fig. 1A,B). Remarkably, by 7 weeks after AAT exposure cells with 53BP1/ phospho ATM foci were still present at higher levels than in the unexposed control mice (Fig. 1B). However, in time, we note 2 specific changes in the 53BP1/phospho ATM foci: First, prior to the 3-week time point many more nuclei with multiple foci were present; second, by 7 weeks after exposure to AAT, or to mitomycin C, a second DNA damaging agent, there were significant decreases in the signal strength of phospho ATM (Fig. 1A and Table 1)(Tamura et al. 1992). This also occurred when ATM immunostaining was done singly without 53BP1 immunodetection (data not shown). The experiment with the second genotoxin, mitomycin C, was important because unlike AAT, the drug and its active metabolites have been shown to rapidly disappear from the body (Dorr, 1988). At 2 or 3 days post-exposure to mitomycin C, long-term effects on cells are observed, not responses to new chemical damage.
Figure 1. Accumulation of hepatocytes with DDR foci after exposure to a DNA damaging agent and with aging.
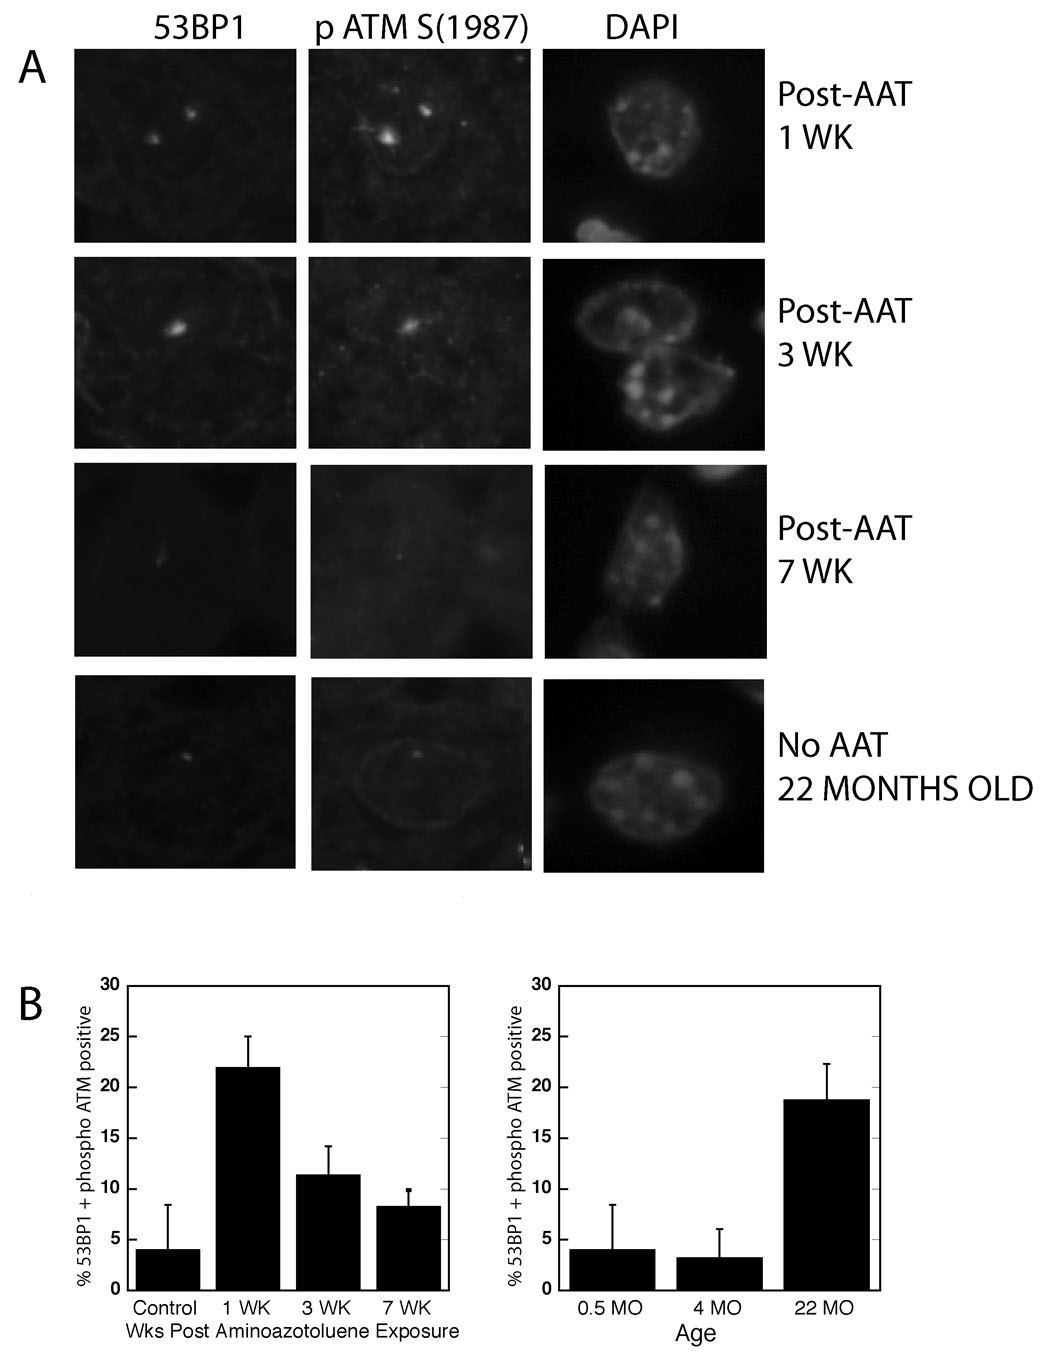
(A) Mice were exposed to a single injection of AAT, and at various time points tissue sections simultaneously immunostained for 53BP1 and phospho ATM (S1987). Mice at 22 months of age similarly revealed the presence of co-localized 53BP1/ATM1987 foci. Nuclear DNA was counterstained with DAPI. (B) Quantitation of hepatocytes positive for 53BP1/phospho ATM co-localized foci at various times after AAT exposure and with advanced age, 3 – 6 mice at each time point. Control mice injected with vehicle and then assayed 1, 3 and 7 weeks later all showed similar low levels of foci. At least 400 nuclei were scored for each animal.
Table 1.
| Relative Immunofluorescent Intensity of Foci for: | ||
|---|---|---|
| ATM/ATR p (S/TQ) | ATM p (S1987) | |
| 3 Wk post AAT | 100 ± 20.0 | 100 ± 4.50 |
| 7 Wk post AAT | 50 ± 17.5A | 50 ± 9.80D |
| 3 M Old (no AAT) | ND | 87.6 ± 34E |
| 22 M Old (no AAT) | 50 ± 5.96B | 55.4 ± 5.92F |
| 3 Wk post mitomycin C | 100 ± 10.1 | 100 ± 15.9 |
| 7 Wk post mitomycin C | 69.6 ±12.1C | 57.4 ± 13.0G |
3 Wk AAT vs 7 Wk AAT, P<0.0001
3 Wk AAT vs. 22 M, P<0.0001
3 Wk MMC vs. 7 Wk MMC, P<0.0112
3 Wk AAT vs 7 Wk AAT, P<0.0171
3 M vs. 22 M, P< 0.019
3 Wk AAT vs. 22 M, P< 0.0047
3 Wk MMC vs. 7 wk MMC, P<0.018
Next, this assay was used on liver sections from different aged mice unexposed to the DNA damaging agents. In 22-, but not 4-, month-old mice, there were high numbers of DNA damage foci containing co-localized 53BP1 and activated ATM, indicating the presence of substantial numbers of potentially senescent cells (Fig. 1B). Notably, these DNA damage foci were characterized by low signal strength for phospho ATM, similar to those observed in mice 7 weeks after AAT exposure (Table 1).
In addition to the DDR proteins already mentioned, we assayed for protein activation by ATM/ATR kinases and downstream kinases, including p53 (S15), Chk2 (T77), and a generic ATM/ATR phosphorylated target sequence (ATM/ATR (p) S/TQ). We saw activation of all of these with DNA damage in the AAT exposed mice (Fig. 2 and Supp. Fig. 2 and 3); however, except for ATM/ATR (p) S/TQ, all were activated only transiently, showing baseline or near baseline levels by 3 to 7 weeks post-AAT exposure. Mitomycin C exposure caused similar changes (Table 1, data not shown). Focus proteins with the ATM/ATR (p) S/TQ sequence were, after exposure to either genotoxin, activated even 7 weeks after senescence induction but there was a reduction in signal intensity (Table 1). This antibody would detect a subset of the large group of activated ATM/ATR targets (Matsuoka et al., 2007), including p95/NBS1 and Chk2, but it has minimal affinity for activated ATM itself (S. Manning, personal communication). When young and old mice were assayed, 22-month-old mice again showed levels of DDR proteins similar to those seen 7 weeks post-AAT exposure in young mice. There was no enrichment of activated p53 (S18) or Chk2 (T77), while ATM/ATR (p) positive cells were detected but the foci were of low intensity (Fig. 2, Table 1, data not shown).
Figure 2. Chk2 activation is greatly reduced long times after AAT exposure and is undetectable in 22-month-old mice.
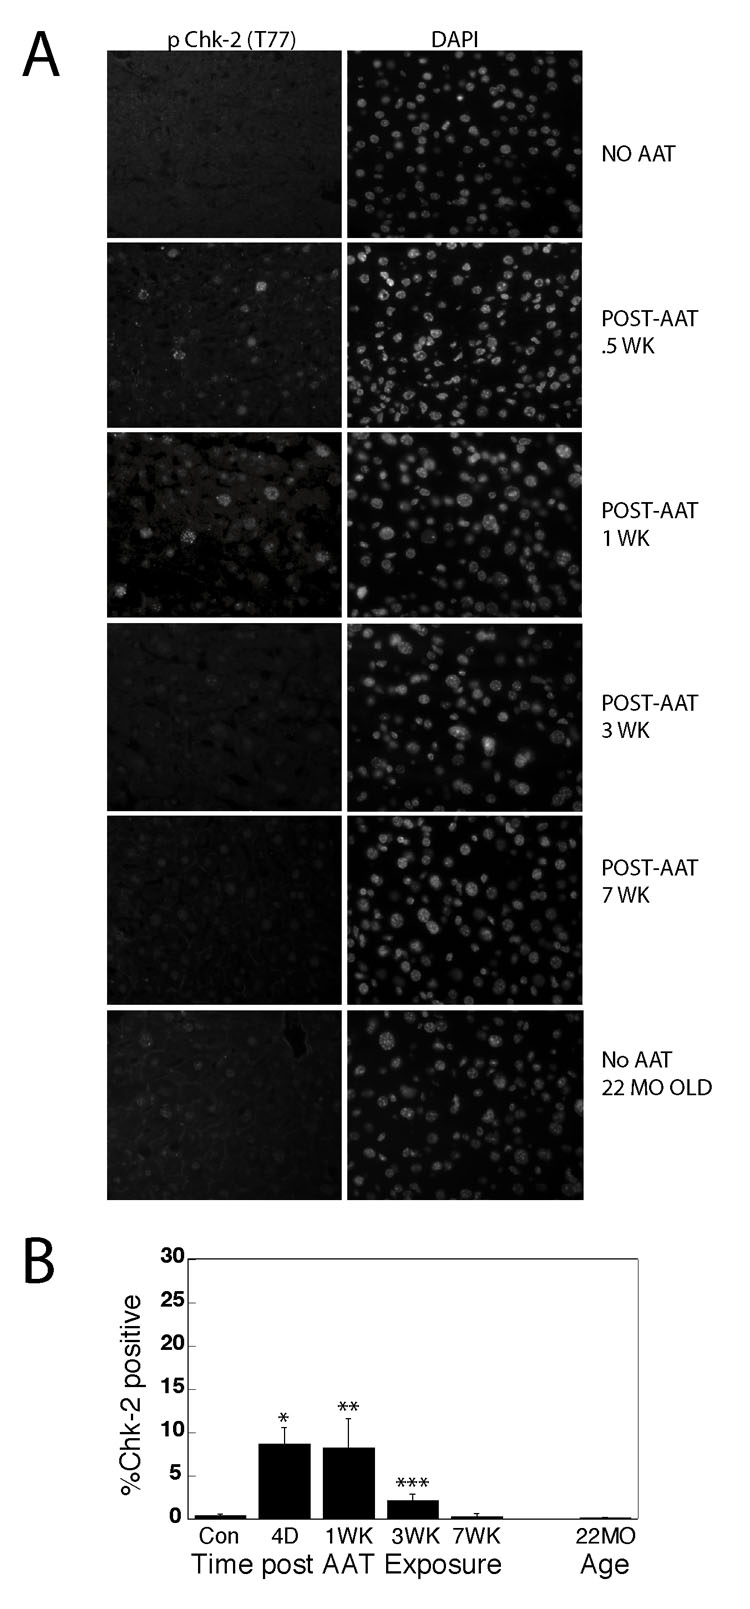
(A) At various times after AAT exposure tissue sections from liver were immunostained for phospho Chk2 (T77) nuclear staining. The control with no AAT was obtained 1 week after injection with vehicle. Controls from mice 0.5, 3 and 7 weeks after injection gave similar negative results. (B) Quantitation of phospho Chk2 positive nuclei revealed high levels of nuclear staining 0.5 and 1 week after AAT exposure. Over 500 nuclei were scored for each animal and 3 –5 animals were tested for each time point. *P<0.0001; **P<0.0011; ***P<0.0019 by t test.
3.2 SAHF and a hybrid SA β Gal assay indicated high numbers of potentially senescent hepatocytes in the 22-month-old mice
Eighteen percent of liver hepatocytes in the 22-month-old mice had detectable DNA damage foci. One interpretation was that many of the cells were senescent or on the way to becoming senescent. Thus, it was possible that other methodologies to identify senescent cells could produce similar or even higher numbers. We adapted the SA β Gal assay to overcome the lack of efficiency in identifying senescent cells in non-diseased tissue sections (Cristofalo, 2005). We isolated liver hepatocytes, then rapidly plated them in primary cell culture and performed the SA β Gal assay within 48 hours of plating. This hybrid SA β Gal assay was first verified by exposing juvenile mice to AAT. Three weeks after AAT exposure of these mice, cells were isolated, plated in culture, and subjected to the hybrid SA β Gal assay revealing substantial numbers of SA β Gal positive cells, while control mice had almost none (Fig. 3).
Figure 3. Hepatocytes isolated from 22-month-old adult mice, but not 4-month-old young adult mice, are defective for S phase entry and positive for SA β Gal, as are hepatocytes from AAT exposed mice.
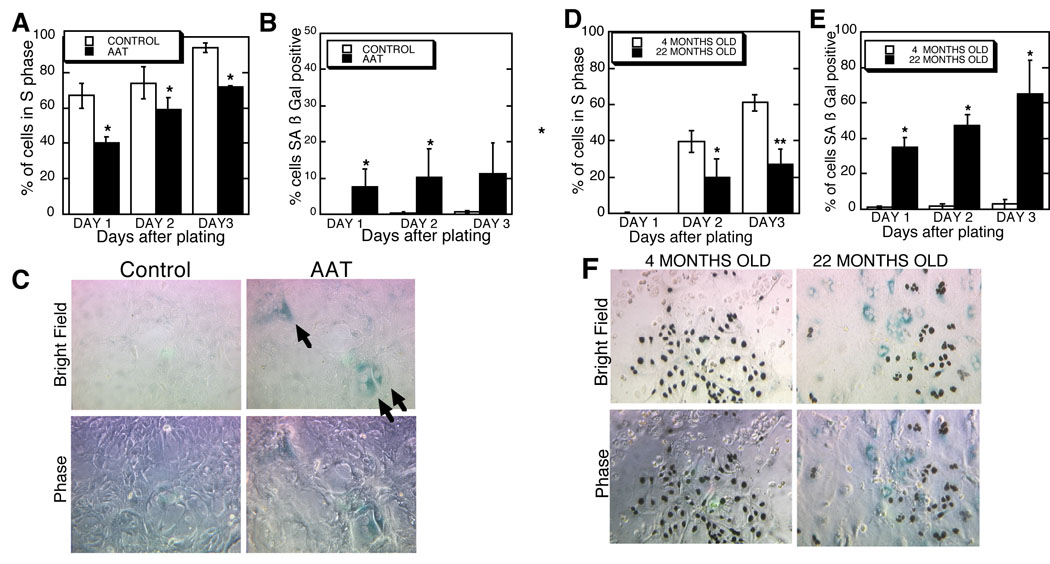
(A) Collagenase perfusion was used to isolate hepatocytes from juvenile mice exposed three weeks previously to AAT. Twenty four hours prior to fixation, cells were incubated with [3H]thymidine to allow the quantitation of the S phase index after processing for autoradiography. Shown are the means ± S.D. * P< 0.002 versus the controls. (B) Cells isolated as described above from mice exposed, or not exposed, to AAT were subjected to the SA-β-gal assay after fixation. At least 100 cells were counted on each plate from 3 to 5 control mice and 5 to 6 AAT exposed mice depending on the time point. Shown are the means ± S.D. * P <0.05 versus the controls. (C) Shown is a representative bright field image of primary hepatocytes 3 days after culture. Arrows indicate the blue, peri-nuclear stained, SA β Gal-positive cells. To reduce background [3H]thymidine detection was not done in this experiment. The phase contrast image below allows better visualization of the cells, original magnification 100x.
(D) Hepatocytes isolated from adult 4-month-old and 22-month-old were cultured and assayed for S phase index as described. Shown are means ± S.D. There is a lag in S phase entry in cells from these adult mice. *P<0.02 and ** P<0.004. (E) Hepatocytes from young adult and aged adult mice were cultured as described and then subjected to the SA β Gal assay. Shown are means ± S.D. *P< 0.015 versus the respective controls. (F) Representative image of cells simultaneously assayed for [3H] thymidine labeling of nuclei, indicative of S phase transit, and SA β Gal. Cells from 4- and 22-month-old mice were plated 3 days prior to the assay. Original magnification 100x.
The hybrid SA β Gal assay was performed on 4- and 22-month-old mice. As shown in figure 3, cells isolated from young versus old C56BL/6 mice demonstrated an increase from less than 1% to over 35% SA β Gal positive cells. There was also a decrease in S phase rates as shown earlier (Ishigami et al., 1993; Roth, 1997). While this assay showed high levels of senescent cells only in the old mice, it was important to recognize that because the cells were not assayed until plated in culture, we may have assayed cells poised to complete the senescence process and not completely senescent.
A third assay for senescence detected the presence of cells with elevated levels of SAHF. To verify that this assay would identify putative SAHF in mouse hepatocytes, we examined livers of juvenile mice 7 weeks after AAT exposure. Immunostaining for the heterochromatin-specific proteins Histone H4 (tri methyl K20) and Histone H3 (tri methyl K9) revealed increased numbers of hepatocytes with at least one enlarged, heavily stained, heterochromatic focus after AAT exposure (Fig. 4 and data not shown) (Adams, 2007). The same phenomenon was observed after exposure of mice to the second DNA damaging agent, mitomycin C (Tamura et al., 1992) (Fig. 4). In aged 22-month-old mice not exposed to genotoxins experimentally, we saw even higher levels of SAHF positive cells (Fig. 4). Remarkably, the estimate obtained showed 20% to 44% of liver hepatocytes were SAHF-positive, which was very similar to the number derived by the hybrid SA β Gal assay, and at, or above, the level of DNA damage foci positive cells in the 22-month-old mice
Figure 4. Accumulation of hepatocytes with SAHF Foci after exposure to a DNA damaging agent and with aging.
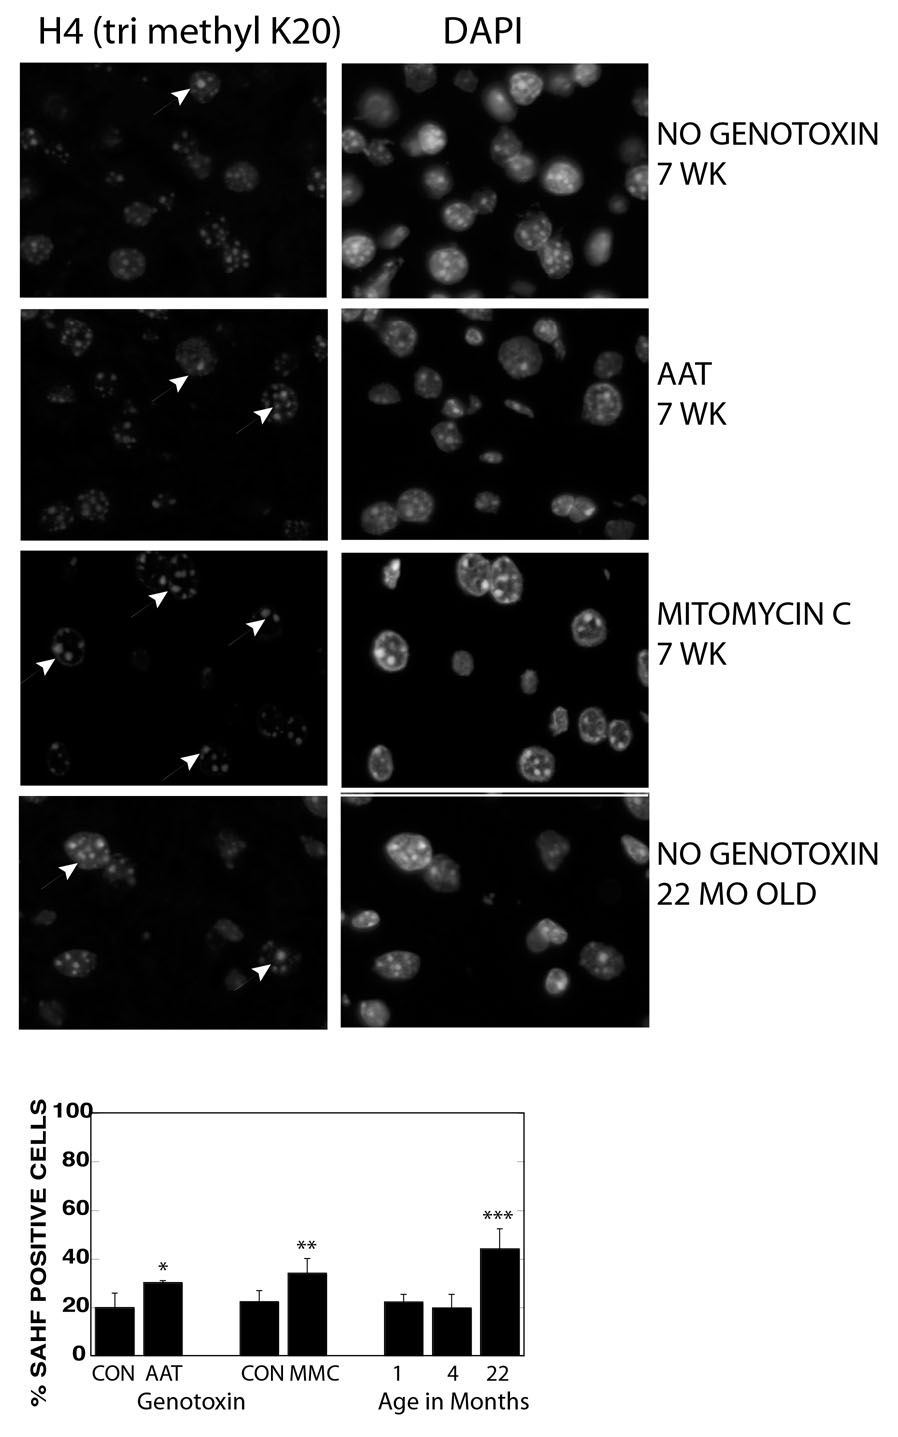
A. Eight-day-old mice were exposed to a single injection of AAT or mitomycin C then livers harvested 7 weeks later and frozen tissue sections immunostained for Histone H4 tri methyl K20. Nuclear DNA was counterstained with DAPI. Non genotoxin exposed mice were at 7 weeks and 22 months of age. Arrows indicate nuclei with enlarged/brighter foci.
B. Quantitation of hepatocytes with enlarged/bright foci of Histone H4 trimethyl K20. * P<0.013, ** P<0.0029, *** P<0.0001 by student’s t-test. At least 300 nuclei were scored for each animal.
4 Discussion
If cellular senescence is a long-lived state of DDR activation, and senescent cells can accumulate in vivo in normal tissue, then cells with an activated DDR should be detectable in the rodent liver long after artificial induction of senescence. This study suggests cells with an activated ATM protein kinase and DNA damage foci can occur with advanced age, but at least certain components of a true active DDR state are lacking. Livers of mice given a single exposure to a DNA damaging agent had increased numbers of cells that showed a series of reproducible changes in DNA damage protein. At 3 and 7 weeks after exposure to either genotoxin, most positive nuclei had only a single prominent DNA damage focus. By 3 weeks, we saw the loss of DNA damage markers phospho Chk2 (T77), phospho p53 (S18), and by 7 weeks on average there was a reduction in the level of phospho ATM and ATM/ATR pS/TQ, which is specific for a subset of ATM/ATR targets not including phospho ATM itself (see methods). It is possible that the observation of cells with the different DDR features, starting at 1 week after exposure with phospho Chk2 + 53BP1 + phospho ATM, then at 3 weeks, 53BP1 + phospho ATM, and followed at 7 weeks by 53BP1 + reduced intensity phospho ATM, are not due to serial changes in individual cells. It is possible that cells with DNA damage repair the damage and the DDR is inactivated but then new cells appear with damaged DNA and a different set of DDR markers. While this seems possible after AAT exposure (where we do not know the chemical turnover time), in the case of mitomycin C, one would have to assume that even after the genotoxin is cleared or inactivated new DNA damage is occurring. Interestingly, the slow process of active DDR diminution in the tissue resembles the in vitro phenomenon of long term (or “deep”) senescence of fibroblasts, where with time there is loss of 53BP1, phospho ATM, total p53, and/or phospho p53 (S15) induction in individual cells after entry into the senescent state (Bakkenist et al., 2004; von Zglinicki et al., 2005; Chen and Ozanne, 2006). Total loss of all components of the active DDR, including DNA damage foci, has not been seen in all senescent fibroblast strains. As fibroblasts have at least 2 different mechanisms to maintain senescence - the ATM/Chk2/p53 and p16/pRB driven pathways, it is curious that both groups that have observed a transient activation of the DDR in senescent cells, with total loss of DNA damage foci, have studied the IMR-90 strain. IMR-90 belongs to a group of fibroblast strains that have high levels of p16 and pRB-directed heterochromatization in senescence and are thought to depend less on the ATM/Chk2/p53 pathway to maintain the cell cycle arrest of senescence (Beausejour et al., 2003; Narita et al., 2003). In other strains, cell types, or species where the alternative senescence pathways (such as the p16/pRB pathway) are weaker, we would speculate that the total inactivation of the DDR would be minimal over time (see BJ fibroblasts: Beausejour et al., 2003; Narita et al., 2003; von Zglinicki et al., 2005; Meier et al., 2007). If what happens to the genotoxin exposed liver is similar to deep senescence, then by 7 weeks after AAT or mitomycin C exposure, cells containing phospho ATM positive foci of low intensity have undergone reductions in levels or activation of DNA damage regulatory proteins phospho Chk2 (T77), ATM and ATM/ATR p S/TQ (Table 1, Fig. 2). We speculate that the changes observed in the liver hepatocytes after genotoxin exposure may be a less extreme version of deep senescence. At this time, it is unclear at what rate these changes may occur and whether they go to completion in some cells, with the total loss of the activated ATM and ATM targets at the DNA damage foci.
In 22-month-old mice, the senescent cells identified by the presence of DNA damage markers resembled those cells seen many weeks after senescence induction by AAT in young mice. That is, they showed reduced intensity of 53BP1/phospho ATM foci, ATM/ATR (p) S/TQ containing foci, and showed lack of enrichment of activated p53 (S18) or Chk2 (T77). This would explain an earlier observation with aging primate skin where activated Chk2 and p53 were undetectable in aged primate skin fibroblasts, though those investigators, lacking positive controls, did not rule out antibody deficiencies (Jeyapalan et al., 2007). It remains to be seen if there is a reduction of intensity of phospho ATM (S1987) or ATM/ATR phospho S/TQ targets with aging in primate skin fibroblasts and, if so, at what rate it occurs in organisms that live many years.
There are several ways to explain the increase in the number of cells with DNA damage foci seen with aging. While there is little proof for it, one might propose that there is more DNA damage generated in the livers of old mice possibly due to increases in reactive oxygen species with age (Lopez-Torres et al., 2002). This does not easily explain the lack of newly DNA damaged cells, which would be expected to show activated Chk2 and p53. While there is precedence for the induction of the DDR without the rapid activation of p53 in post-mitotic myocytes exposed specifically to ionizing radiation, Chk2 activation is consistently observed in the DDR (Latella et al., 2004). Rather than an increased induction rate, it seems more likely that the increased numbers are due to the long-term accumulation of cells with only some components of an active DDR. While in theory these cells may initially and always have a partial DDR, a second model more consistent with the changes seen with genotoxin exposure (Table 1) and with deep senescence in vitro, suggests that senescent hepatocytes when they first form have a full repertoire of DNA damage response proteins. The reduction of this and other DDR markers in cells of the old mouse might then be due to the fact that the cells first became senescent many months before. In support of this speculative model, the relative intensity of phospho ATM foci, in the few cells that have them in the livers of 4-month-old mice, was significantly higher than in the 22-month-old mice (Table 1).
The association of senescent cell accumulation with physiological aging is an attractive concept but remains to be established in the liver and many other tissues. DNA damage does not have to be the initiating event for senescence - it can be changes in gene expression or cell milieu - but the DDR is likely to play at least a downstream role in the pathway to senescence (von Zglinicki et al., 2005). While a single rapid widespread telomeric DNA damaging event in liver hepatocytes of an adult mouse did not lead to cellular senescence unless it was coupled with cell turnover (Lechel et al., 2005; Lazzerini Denchi et al., 2006), we propose that a continual DNA damage signal, whatever the source, linked with the need for cell cycle entry over many months, might be expected to lead to cellular senescence. We used an adaptation of the SA β Gal assay to demonstrate high numbers of SA β Gal positive cells from the liver of 22- but not 4-month-old mice, and after AAT exposure of juvenile mice (Fig. 3). We avoided staining SA β Gal directly on frozen tissue sections, which is an insensitive assay (Krishnamurthy et al., 2004). We speculate that the improved performance of the hybrid SA β Gal assay versus the in situ tissue assay, is due to real changes in SA β Gal expression on plating. That is because during the regeneration that occurs after partial hepatectomy, SA β gal assay positive cells appear in tissue sections from artificially aged late generation mTERC−/− adult mice (Sigal et al., 1999; Satyanarayana et al., 2003; Satyanarayana et al., 2004) but not from young mice. This supports the role of cell proliferation signals in the accuracy of the SA β Gal assay (Cristofalo, 2005). Importantly, a second assay for senescence, which examined SAHF formation (by detecting tri-methylated forms of Histone H3 K9 or Histone H4 K20), saw an increase in cells with enlarged heterochromatic foci with old age (Fig. 4 and data not shown). While it is not clear if this is caused by whole chromosome condensation, centromeric aggregation, or some other mechanism in the mouse liver, it was also induced by both genotoxic agents AAT and mitomycin C in vivo and was similar to the relocalization of H3 and Hp1 into large heterochromatic foci observed in other systems (Narita et al., 2003; Braig et al., 2005; Funayama et al., 2006; Adams, 2007; Collado et al., 2007). In the present study, with 22-month-old mice, the high number of senescent cells observed (18% to 44% depending on the assay) is in line with an earlier study that examined long- term DNA synthesis rates after partial hepatectomy and indicated that 20% to 70% of the hepatocytes in 27-month-old rat did not enter the cell cycle versus less than 7% to 20% in a 3-month-old rat (Stocker and Heine, 1971). That we saw more SA β Gal and SAHF than cells with DNA damage foci in the aging mice may have been due to limitations of the assay or, more interestingly, the existence of cells in vivo that are senescent but lack modification or relocalization of any assayed DDR components.
Our experiments, combined with the loss of senescence markers with deep senescence in vitro, argue for the in vivo accumulation of cells without extremes in enrichment or modification of many of the DDR proteins related to senescence. This is in contrast to senescent cells associated with pre-malignancy, which show high levels of activated Chk2, ATM, and p53 (Bartkova et al., 2005, Chen et al., 2005; Gorgoulis et al., 2005, data not shown). This suggests that there are differences in gene expression of the putative senescent cells we identified associated with aging (or long after DNA damage) and with the senescent cells associated with oncogenesis. This may be due to fundamental differences in the senescence process, environmental differences, or more rapid turnover of oncogene-activated senescent cells. We suggest that in vivo senescent cells associated with aging (like deep senescent cells) may lack induction of a host of other proteins associated with newly senescent cells in vitro.
Supplementary Material
Acknowledgements
We would like to thank Drs. David Ucker and David Crowe for their careful reading of the manuscript. We thank Dr. Angela Tyner for helping us to learn the hepatocyte cell isolation procedure, Ronald Cheung for his advice on cell culture, Dr. Joel Schwartz for instruction on histomorphometric analysis, and Kevin Go, Olga Kalinina, Ruslan Yashin, and Kamala Saha for help with work leading up to this study. This work was supported by US Public Health Service Grant RO1 CA 85529-05 from the NCI to GRA and a seed grant from the UIC College of Dentistry.
Footnotes
Publisher's Disclaimer: This is a PDF file of an unedited manuscript that has been accepted for publication. As a service to our customers we are providing this early version of the manuscript. The manuscript will undergo copyediting, typesetting, and review of the resulting proof before it is published in its final citable form. Please note that during the production process errors may be discovered which could affect the content, and all legal disclaimers that apply to the journal pertain.
References
- Adams PD. Remodeling of chromatin structure in senescent cells and its potential impact on tumor suppression and aging. Gene. 2007;397:84–93. doi: 10.1016/j.gene.2007.04.020. [DOI] [PMC free article] [PubMed] [Google Scholar]
- Bahjat FR, Dharnidharka VR, Fukuzuka K, Morel L, Crawford JM, Clare-Salzler MJ, Moldawer LL. Reduced susceptibility of nonobese diabetic mice to TNF-alpha and D-galactosamine-mediated hepatocellular apoptosis and lethality. J Immunol. 2000;165:6559–6567. doi: 10.4049/jimmunol.165.11.6559. [DOI] [PubMed] [Google Scholar]
- Bakkenist CJ, Drissi R, Wu J, Kastan MB, Dome JS. Disappearance of the telomere dysfunction-induced stress response in fully senescent cells. Cancer Res. 2004;64:3748–3752. doi: 10.1158/0008-5472.CAN-04-0453. [DOI] [PubMed] [Google Scholar]
- Bartkova J, Horejsi Z, Koed K, Kramer A, Tort F, Zieger K, Guldberg P, Sehested M, Nesland JM, Lukas C, Orntoft T, Lukas J, Bartek J. DNA damage response as a candidate anti-cancer barrier in early human tumorigenesis. Nature. 2005;434:864–870. doi: 10.1038/nature03482. [DOI] [PubMed] [Google Scholar]
- Beausejour CM, Krtolica A, Galimi F, Narita M, Lowe SW, Yaswen P, Campisi J. Reversal of human cellular senescence: roles of the p53 and p16 pathways. Embo J. 2003;22:4212–4222. doi: 10.1093/emboj/cdg417. [DOI] [PMC free article] [PubMed] [Google Scholar]
- Braig M, Lee S, Loddenkemper C, Rudolph C, Peters AH, Schlegelberger B, Stein H, Dorken B, Jenuwein T, Schmitt CA. Oncogene-induced senescence as an initial barrier in lymphoma development. Nature. 2005;436:660–665. doi: 10.1038/nature03841. [DOI] [PubMed] [Google Scholar]
- Campisi J. Aging, tumor suppression and cancer: high wire-act! Mech Ageing Dev. 2005;126:51–58. doi: 10.1016/j.mad.2004.09.024. [DOI] [PubMed] [Google Scholar]
- Chen JH, Ozanne SE. Deep senescent human fibroblasts show diminished DNA damage foci but retain checkpoint capacity to oxidative stress. FEBS Lett. 2006;580:6669–6673. doi: 10.1016/j.febslet.2006.11.023. [DOI] [PubMed] [Google Scholar]
- Chen Z, Trotman LC, Shaffer D, Lin HK, Dotan ZA, Niki M, Koutcher JA, Scher HI, Ludwig T, Gerald W, Cordon-Cardo C, Pandolfi PP. Crucial role of p53-dependent cellular senescence in suppression of Pten-deficient tumorigenesis. Nature. 2005;436:725–730. doi: 10.1038/nature03918. [DOI] [PMC free article] [PubMed] [Google Scholar]
- Collado M, Blasco MA, Serrano M. Cellular senescence in cancer and aging. Cell. 2007;130:223–233. doi: 10.1016/j.cell.2007.07.003. [DOI] [PubMed] [Google Scholar]
- Cristofalo VJ. SA beta Gal staining: biomarker or delusion. Exp Gerontol. 2005;40:836–838. doi: 10.1016/j.exger.2005.08.005. [DOI] [PubMed] [Google Scholar]
- Cristofalo VJ, Lorenzini A, Allen RG, Torres C, Tresini M. Replicative senescence: a critical review. Mech Ageing Dev. 2004;125:827–848. doi: 10.1016/j.mad.2004.07.010. [DOI] [PubMed] [Google Scholar]
- d'Adda di Fagagna F, Reaper PM, Clay-Farrace L, Fiegler H, Carr P, Von Zglinicki T, Saretzki G, Carter NP, Jackson SP. A DNA damage checkpoint response in telomere-initiated senescence. Nature. 2003;426:194–198. doi: 10.1038/nature02118. [DOI] [PubMed] [Google Scholar]
- Dimri GP, Lee X, Basile G, Acosta M, Scott G, Roskelley C, Medrano EE, Linskens M, Rubelj I, Pereira-Smith O, et al. A biomarker that identifies senescent human cells in culture and in aging skin in vivo. Proc Natl Acad Sci U S A. 1995;92:9363–9367. doi: 10.1073/pnas.92.20.9363. [DOI] [PMC free article] [PubMed] [Google Scholar]
- Dorr RT. New findings in the pharmacokinetic metabolic and drug-resistance aspects of mitomycin C. Semin Oncol. 1988;15(S4):32–41. [PubMed] [Google Scholar]
- Funayama R, Saito M, Tanobe H, Ishikawa F. Loss of linker histone H1 in cellular senescence. J Cell Biol. 2006;175:869–880. doi: 10.1083/jcb.200604005. [DOI] [PMC free article] [PubMed] [Google Scholar]
- Gorgoulis VG, Vassiliou LV, Karakaidos P, Zacharatos P, Kotsinas A, Liloglou T, Venere M, Ditullio RA, Jr., Kastrinakis NG, Levy B, Kletsas D, Yoneta A, Herlyn M, Kittas C, Halazonetis TD. Activation of the DNA damage checkpoint and genomic instability in human precancerous lesions. Nature. 2005;434:907–913. doi: 10.1038/nature03485. [DOI] [PubMed] [Google Scholar]
- Guenatri M, Bailly D, Maison C, Almouzni G. Mouse centric and pericentric satellite repeats form distinct functional heterochromatin. J Cell Biol. 2004;166:493–505. doi: 10.1083/jcb.200403109. [DOI] [PMC free article] [PubMed] [Google Scholar]
- Gupta S. Hepatic polyploidy and liver growth control. Semin Cancer Biol. 2000;10:161–171. doi: 10.1006/scbi.2000.0317. [DOI] [PubMed] [Google Scholar]
- Herbig U, Jobling WA, Chen BP, Chen DJ, Sedivy JM. Telomere shortening triggers senescence of human cells through a pathway involving ATM, p53, and p21(CIP1), but not p16(INK4a) Mol Cell. 2004;14:501–513. doi: 10.1016/s1097-2765(04)00256-4. [DOI] [PubMed] [Google Scholar]
- Herbig U, Sedivy JM. Regulation of growth arrest in senescence: telomere damage is not the end of the story. Mech Ageing Dev. 2006;127:16–24. doi: 10.1016/j.mad.2005.09.002. [DOI] [PubMed] [Google Scholar]
- Holliday R. Understanding Ageing. New York: Press Syndicate of the University of Cambridge; 1995. [Google Scholar]
- Hornsby P. Cell proliferation in mammalian aging. In: A Masoro EJ, SN, editors. Handbook of the Biology of Aging. New York: Academic Press; 2001. [Google Scholar]
- Ishigami A, Reed TD, Roth GS. Effect of aging on EGF stimulated DNA synthesis and EGF receptor levels in primary cultured rat hepatocytes. Biochem Biophys Res Commun. 1993;196:181–186. doi: 10.1006/bbrc.1993.2232. [DOI] [PubMed] [Google Scholar]
- Jeyapalan JC, Ferreira M, Sedivy JM, Herbig U. Accumulation of senescent cells in mitotic tissue of aging primates. Mech Ageing Dev. 2007;128:36–44. doi: 10.1016/j.mad.2006.11.008. [DOI] [PMC free article] [PubMed] [Google Scholar]
- Kao CY, Factor VM, Thorgeirsson SS. Reduced growth capacity of hepatocytes from c-myc and c-myc/TGF-alpha transgenic mice in primary culture. Biochem Biophys Res Commun. 1996;222:64–70. doi: 10.1006/bbrc.1996.0698. [DOI] [PubMed] [Google Scholar]
- Krishnamurthy J, Torrice C, Ramsey MR, Kovalev GI, Al-Regaiey K, Su L, Sharpless NE. Ink4a/Arf expression is a biomarker of aging. J Clin Invest. 2004;114:1299–1307. doi: 10.1172/JCI22475. [DOI] [PMC free article] [PubMed] [Google Scholar]
- Latella L, Lukas J, Simone C, Puri PL, Bartek J. Differentiation-induced radioresistance in muscle cells. Mol Cell Biol. 2004;24:6350–6361. doi: 10.1128/MCB.24.14.6350-6361.2004. [DOI] [PMC free article] [PubMed] [Google Scholar]
- Lazaro CA, Croager EJ, Mitchell C, Campbell JS, Yu C, Foraker J, Rhim JA, Yeoh GC, Fausto N. Establishment, characterization, and long-term maintenance of cultures of human fetal hepatocytes. Hepatology. 2003;38:1095–1106. doi: 10.1053/jhep.2003.50448. [DOI] [PubMed] [Google Scholar]
- Lazzerini Denchi E, Celli G, de Lange T. Hepatocytes with extensive telomere deprotection and fusion remain viable and regenerate liver mass through endoreduplication. Genes Dev. 2006;20:2648–2653. doi: 10.1101/gad.1453606. [DOI] [PMC free article] [PubMed] [Google Scholar]
- Lechel A, Satyanarayana A, Ju Z, Plentz RR, Schaetzlein S, Rudolph C, Wilkens L, Wiemann SU, Saretzki G, Malek NP, Manns MP, Buer J, Rudolph KL. The cellular level of telomere dysfunction determines induction of senescence or apoptosis in vivo. EMBO Rep. 2005;6:275–281. doi: 10.1038/sj.embor.7400352. [DOI] [PMC free article] [PubMed] [Google Scholar]
- Lopez-Torres M, Gredilla R, Sanz A, Barja G. Influence of aging and long-term caloric restriction on oxygen radical generation and oxidative DNA damage in rat liver mitochondria. Free Radic Biol Med. 2002;32:882–889. doi: 10.1016/s0891-5849(02)00773-6. [DOI] [PubMed] [Google Scholar]
- Matsuoka S, Ballif BA, Smogorzewska A, McDonald ER, 3rd, Hurov KE, Luo J, Bakalarski CE, Zhao Z, Solimini N, Lerenthal Y, Shiloh Y, Gygi SP, Elledge SJ. ATM and ATR substrate analysis reveals extensive protein networks responsive to DNA damage. Science. 2007;316:1160–1166. doi: 10.1126/science.1140321. [DOI] [PubMed] [Google Scholar]
- Meier A, Fiegler H, Munoz P, Ellis P, Rigler D, Langford C, Blasco MA, Carter N, Jackson SP. Spreading of mammalian DNA-damage response factors studied by ChIP-chip at damaged telomeres. Embo J. 2007;26:2707–2718. doi: 10.1038/sj.emboj.7601719. [DOI] [PMC free article] [PubMed] [Google Scholar]
- Melk A, Kittikowit W, Sandhu I, Halloran KM, Grimm P, Schmidt BM, Halloran PF. Cell senescence in rat kidneys in vivo increases with growth and age despite lack of telomere shortening. Kidney Int. 2003;63:2134–2143. doi: 10.1046/j.1523-1755.2003.00032.x. [DOI] [PubMed] [Google Scholar]
- Narita M, Nunez S, Heard E, Lin AW, Hearn SA, Spector DL, Hannon GJ, Lowe SW. Rb-mediated heterochromatin formation and silencing of E2F target genes during cellular senescence. Cell. 2003;113:703–716. doi: 10.1016/s0092-8674(03)00401-x. [DOI] [PubMed] [Google Scholar]
- Puviani AC, Ottolenghi C, Tassinari B, Pazzi P, Morsiani E. An update on high-yield hepatocyte isolation methods and on the potential clinical use of isolated liver cells. Comp Biochem Physiol A Mol Integr Physiol. 1998;121:99–109. doi: 10.1016/s1095-6433(98)10109-5. [DOI] [PubMed] [Google Scholar]
- Roth GS. Age changes in signal transduction and gene expression. Mech Ageing Dev. 1997;98:231–238. doi: 10.1016/s0047-6374(97)00110-3. [DOI] [PubMed] [Google Scholar]
- Satyanarayana A, Greenberg RA, Schaetzlein S, Buer J, Masutomi K, Hahn WC, Zimmermann S, Martens U, Manns MP, Rudolph KL. Mitogen stimulation cooperates with telomere shortening to activate DNA damage responses and senescence signaling. Mol Cell Biol. 2004;24:5459–5474. doi: 10.1128/MCB.24.12.5459-5474.2004. [DOI] [PMC free article] [PubMed] [Google Scholar]
- Satyanarayana A, Wiemann SU, Buer J, Lauber J, Dittmar KE, Wustefeld T, Blasco MA, Manns MP, Rudolph KL. Telomere shortening impairs organ regeneration by inhibiting cell cycle re-entry of a subpopulation of cells. Embo J. 2003;22:4003–4013. doi: 10.1093/emboj/cdg367. [DOI] [PMC free article] [PubMed] [Google Scholar]
- Sedelnikova OA, Horikawa I, Zimonjic DB, Popescu NC, Bonner WM, Barrett JC. Senescing human cells and ageing mice accumulate DNA lesions with unrepairable double-strand breaks. Nat Cell Biol. 2004;6:168–170. doi: 10.1038/ncb1095. [DOI] [PubMed] [Google Scholar]
- Severino J, Allen RG, Balin S, Balin A, Cristofalo VJ. Is beta-galactosidase staining a marker of senescence in vitro and in vivo? Exp Cell Res. 2000;257:162–171. doi: 10.1006/excr.2000.4875. [DOI] [PubMed] [Google Scholar]
- Sigal SH, Rajvanshi P, Gorla GR, Sokhi RP, Saxena R, Gebhard DR, Jr., Reid LM, Gupta S. Partial hepatectomy-induced polyploidy attenuates hepatocyte replication and activates cell aging events. Am J Physiol. 1999;276:G1260–G1272. doi: 10.1152/ajpgi.1999.276.5.G1260. [DOI] [PubMed] [Google Scholar]
- Stocker E, Heine WD. Regeneration of liver parenchyma under normal and pathological conditions. Beitr Pathol. 1971;144:400–408. [PubMed] [Google Scholar]
- Takai H, Smogorzewska A, de Lange T. DNA damage foci at dysfunctional telomeres. Curr Biol. 2003;13:1549–1556. doi: 10.1016/s0960-9822(03)00542-6. [DOI] [PubMed] [Google Scholar]
- Tamura J, Tanaka J, Fujita K, Yoshida M, Kasamatsu T, Arii S, Tobe T. Effect of anticancer agents on cell cycle of regenerating hepatocytes in rats. J Surg Res. 1992;53:218–226. doi: 10.1016/0022-4804(92)90038-2. [DOI] [PubMed] [Google Scholar]
- von Zglinicki T, Saretzki G, Ladhoff J, d'Adda di Fagagna F, Jackson SP. Human cell senescence as a DNA damage response. Mech Ageing Dev. 2005;126:111–117. doi: 10.1016/j.mad.2004.09.034. [DOI] [PubMed] [Google Scholar]
- Wright WE, Shay JW. Historical claims and current interpretations of replicative aging. Nat Biotechnol. 2002;20:682–688. doi: 10.1038/nbt0702-682. [DOI] [PubMed] [Google Scholar]
- Yang N-C, Hu M-L. The limitations and validities of senescence associated-β-galactosidase actvity as an aging marker for human foreskin fibroblast Hs68 cells. Experimental Gerontology. 2005;40:813–819. doi: 10.1016/j.exger.2005.07.011. [DOI] [PubMed] [Google Scholar]
- Zimmerman HJ. Hepatotoxicity. Philadelphia: Lippincot Williams and Wilkins; 1999. [Google Scholar]
Associated Data
This section collects any data citations, data availability statements, or supplementary materials included in this article.