Abstract
Purpose
To design a contrast sensitivity perimetry (CSP) protocol that decreases variability in glaucomatous defects while maintaining good sensitivity to glaucomatous loss.
Methods
Twenty patients with glaucoma and 20 control subjects were tested with a CSP protocol implemented on a monitor-based testing station. In the protocol 26 locations were tested over the central visual field with Gabor patches with a peak spatial frequency of 0.4 cyc/deg and a two-dimensional spatial Gaussian envelope, with most of the energy concentrated within a 4° circular region. Threshold was estimated by a staircase method. Patients and 10 age-similar control subjects were also tested on conventional automated perimetry (CAP), with the 24−2 pattern with the SITA Standard testing strategy. The neuroretinal rim area of the patients was measured with a retinal tomograph (Retina Tomograph II [HRT]; Heidelberg Engineering, Heidelberg, Germany). A Bland-Altman analysis of agreement was used to assess test–retest variability, compare depth of defect shown by the two perimetric tests, and investigate the relations between contrast sensitivity and neuroretinal rim area.
Results
Variability showed less dependence on defect depth for CSP than for CAP (z = 9.3, P < 0.001). Defect depth was similar for CAP and CSP when averaged by quadrant (r = 0.26, P > 0.13). The relation between defect depth and rim area was more consistent with CSP than with CAP (z = 9, P < 0.001).
Conclusions
The implementation of CSP was successful in reducing test–retest variability in glaucomatous defects. CSP was in general agreement with CAP in terms of depth of defect and was in better agreement than CAP with HRT-determined rim area.
Conventional automated perimetry (CAP) is an integral part of clinical management of patients with glaucoma and is a gold standard for visual field testing. However, it has several disadvantages, improvement of which may help in diagnosing and monitoring the progression of glaucoma. Two significant disadvantages of CAP are high test–retest variability in defective areas and relatively sparse sampling of retinal locations (stimuli 0.43° in diameter are presented at locations 6.0° apart). The high test–retest variability in defects makes monitoring of progression difficult.1 Sparse sampling of the retina may not reflect the overall sensitivity of the region and may further complicate structure–function comparisons. Both problems can be addressed by increasing the diameter of the stimulus, but large stimuli often yield shallower defects than does the standard stimulus.2–4
Pearson et al.5 showed that large chromatic stimuli can provide low test–retest variability while maintaining sensitivity to glaucomatous loss. They hypothesized that the key aspect of the stimulus was the nature of cortical pooling and that a similar result would hold for any stimulus for which detection was mediated by cortical cells tuned to low spatial frequencies. This prediction was confirmed by Pan et al.,6 who used both chromatic stimuli and a Gabor stimulus with a peak spatial frequency of 0.5 cyc/deg.
Another form of sinusoidal stimuli with low spatial frequencies (0.25 and 0.50 cyc/deg) is used in frequency-doubling perimetry (FDP), and the results of studies on test–retest variability with FDP are consistent with the predictions of Pearson et al.5 FDP defects are generally similar in depth to defects with conventional perimetry, when expressed as log contrast sensitivity, and test–retest variability is independent of sensitivity.7,8 However, normal between-subject and test–retest variability are high for FDP. A recent study9 showed large, normal, between-subject variability on FDP: an MD of −5 dB was within 95% confidence limits of normal, as was a pattern standard deviation (PSD) of 5 dB (up to 8 dB in some cases). The 90% confidence interval for test–retest variability on FDP is ±4 dB even in areas with normal sensitivity.7,8 FDP uses high temporal frequencies with the goal of tapping spatially nonlinear retinal ganglion cells. However, a recent study demonstrated that spatially nonlinear cells cannot be the physiological substrate of the frequency-doubling illusion, so the use of high temporal frequency modulation may not be necessary.10 The use of high temporal frequencies makes FDP susceptible to the effects of reduced retinal illumination, due to factors such as pupillary miosis and increase in lens density.11
The goal of the present study was to design a new perimetric protocol, by using contrast sensitivity perimetry (CSP),12 which could improve clinical management of glaucoma by building on findings of these earlier studies. We used a stimulus with a peak spatial frequency in the range used by FDP, but without the sharp stimulus edges and high temporal frequencies used in FDP. The primary purpose of this design was to decrease test–retest variability in defective areas while maintaining good ability to detect glaucomatous loss. The success of the design was measured by comparing results of the new CSP test with results from CAP and with measures of neuroretinal rim area by using scanning laser tomography.
Methods
Participants
For the assessment of age-related sensitivities, two control groups were recruited: 10 younger subjects aged 22 to 36 years (mean ± SD, 25 ± 4 years) and 10 older subjects aged 46 to 65 years (mean, 56 ± 7). Participants were recruited from students, faculty, and patients from the State University of New York University Optometric Center (UOC). Inclusion criteria were: free of eye disease during a recent comprehensive eye examination at UOC, best corrected visual acuity of 20/20 or better, clear ocular media, spherical correction within 6 D and cylindrical correction within 3 D, and IOP below 22 mm Hg. Exclusion criteria were: a first-degree relative with glaucoma, eye disease or systemic disease known to affect vision, or using medication known to affect visual function.
To compare the new CSP test with CAP in detecting depth of defect and variability in areas with low sensitivity, we recruited 20 patients with glaucoma; ages were 44 to 79 years (mean, 63 ± 7). Inclusion criteria were: diagnosis of glaucoma and undergoing treatment at UOC, clear ocular media, spherical correction within 6 D and cylindrical correction within 3 D, IOP below 22 mm Hg, and visual field defects consistent with a diagnosis of glaucoma.13 Subjects' clinical characteristics including refractive error are listed in Table 1. The spherical–cylindrical equivalent of refractive error ranged from −3.25 to +4.75 D across all subjects, which would not be expected to produce significant optical distortions of the stimuli.14 More than half of the patients had a superior or inferior nasal defect; half of the patients had a superior or inferior arcuate scotoma; six patients had combinations of defects including enlarged blind spot and nasal, arcuate, double arcuate, and/or paracentral defects. All but one of the patients had primary open-angle glaucoma; one patient had a diagnosis of normal-tension glaucoma. Diagnosis of glaucoma was established by a treating clinician and confirmed by the second author, based on medical and family history, slit lamp biomicroscopy (including gonioscopy), applanation tonometry, dilated funduscopy, stereoscopic ophthalmoscopy of the optic disc with a 78-D lens, stereo photographs of the optic nerve, optic nerve imaging, and visual field performance. The intraocular pressure before treatment initiation was >21 mm Hg for all but one patient and was successfully controlled by topical medications: two patients used three different drops, and the rest used only one or two different drops. Exclusion criteria were: eye disease (other than glaucoma), systemic disease, or medication known to affect visual function.
Table 1.
Clinical Characteristics of the Patients with Glaucoma
| Subj. | Age (y) | VA (logMAR) | CS (log CS) | MD dB | PSD dB | Optic Disc Vertical Dimension | Refractive error (D) |
|---|---|---|---|---|---|---|---|
| 1 | 44 | −0.14 | 1.55 | −4.04 | 8.74 | 0.8 Inferior thinning | −1.50 sph |
| 2 | 53 | 0.24 | 1.35 | −4.9 | 4.52 | 0.85 | −2.00 sph |
| 3 | 53 | 0.08 | 1.3 | −23.55 | 11.9 | 0.9 | +0.75−0.75 × 80 |
| 4 | 55 | −0.1 | 1.8 | −2.56 | 5.22 | 0.3 Inferior NFL loss | +2.00−1.00 × 78 |
| 5 | 57 | 0 | 1.65 | −2.55 | 4.46 | 0.5 | −2.75 sph |
| 6 | 59 | 0.16 | 1.2 | −5.63 | 5.47 | 0.7 | Plano |
| 7 | 60 | −0.04 | 1.35 | −3.58 | 2.3 | 0.85 Temporal thinning | −1.00−0.75 × 90 |
| 8 | 60 | 0.1 | 1.45 | −8 | 6.56 | 0.75 | +4.75 sph |
| 9 | 62 | 0 | 1.5 | −8.75 | 13.5 | 0.85 | +0.75 sph |
| 10 | 64 | 0.04 | 1.5 | −5.08 | 3.95 | 0.65 | −0.25 sph |
| 11 | 64 | 0 | 1.65 | −0.16 | 1.56 | 0.65 | +1.00−0.75 × 75 |
| 12 | 65 | 0.1 | 1.5 | −0.75 | 1.49 | 0.7 | +3.25−1.00 × 15 |
| 13 | 65 | 0.1 | 1.6 | −2.84 | 3.15 | 0.8 | +2.50−0.50 × 85 |
| 14 | 55 | 0.1 | 1.55 | −19.5 | 12.88 | 0.9 | +3.25 sph |
| 15 | 67 | 0.06 | 1.55 | −13.8 | 15.52 | 0.95 | + 1.75−0.75 × 45 |
| 16 | 67 | 0.06 | 1.4 | −13.5 | 8.22 | 0.9 | +2.75−0.75 × 10⁵ |
| 17 | 69 | 0 | 1.5 | −12.27 | 13.41 | 0.6 | +3.25−1.00 × 75 |
| 18 | 70 | 0.06 | 1.65 | −3.65 | 3.45 | 0.8 Inferior notch | +2.50−0.75 × 90 |
| 19 | 72 | 0.24 | 1.6 | −1.72 | 1.66 | 0.75 | +0.25 sph |
| 20 | 79 | −0.02 | 1.5 | −4.11 | 3.33 | 0.85 Superior and inferior notches | −3.00−0.75 × 90 |
| Mean | 63 | 0.05 | 1.51 | −7.01 | 6.55 | 0.75 | 0.91, −0.44 |
| SD | 7 | 0.09 | 0.14 | 6.21 | 4.44 | 0.16 | 2.18, 0.42 |
| Max | 79 | −0.14 | 1.8 | −0.16 | 15.52 | 0.95 | 4.75, 0.00 |
| Min | 44 | 0.24 | 1.2 | −23.55 | 1.49 | 0.3 | −3.00, −1.00 |
Visual acuity (VA) measured with the ETDRS logMAR acuity chart; contrast sensitivity (CS) measured by Pelli-Robson contrast sensitivity chart; mean (MD) and pattern standard deviation (PSD) from CAP testing with SITA Standard 24−2 (averaged across two visits); and vertical dimension of the optic nerve (expressed as a ratio between the vertical disc and cup dimension) and optic nerve head appearance as per treating physician.
The study was conducted according to the tenets of the Declaration of Helsinki. Written informed consent was obtained from each participant before testing, after explanation of the procedure and goals of the experiment. The protocol was approved by the Institutional Review Board of SUNY State College of Optometry.
Apparatus
A field perimeter (Humphrey Field Analyzer II, HFA; Carl Zeiss Meditec, Dublin, CA) was used with the SITA 24−2 testing strategy, to provide a standard evaluation of the central visual field (±24°) of patients with glaucoma and age-similar control subjects. This is a self-calibrating apparatus, and every 6 months a company representative is scheduled for maintenance and evaluation.
A custom-built system based on the Visual Stimulus Generator (VSG2/5, Cambridge Research Systems Ltd.; Cambridge, UK) was used for specialized testing. Dual 8-bit video DACs provided 15-bit output resolution per phosphor. Stimuli from the VSG were displayed on a 21-in. monitor (F500 Trinitron CRT; Sony, Tokyo, Japan). The resolution of the monitor was set to 800 × 600 pixels, with a 150-Hz frame rate. The apparatus was calibrated with a photometer system (OptiCal; Cambridge Research Systems Ltd.), to measure luminance versus DAC values for each phosphor, to calculate the transfer functions, and to produce RGB gamma correction look-up tables. Mean luminance was measured periodically throughout the study with an LS-100 photometer (Minolta, Ramsey, NJ). A customized program was written in C++ (Borland, Cupertino CA).
Each participant was seated with forehead and chin on a head and chin rest at a fixed distance of 33 cm for the HFA and 40 cm for the VSG. One eye at a time was tested, while the other was patched. Closed-circuit video systems were used to monitor fixation stability on both devices. An appropriate corrective lens was placed at the fixed lens holder in front of the participant for each device. All subjects were refracted before testing, to determine refractive correction. For HFA and VSG testing of patients and age-similar controls, the near correction was determined based on age, distance correction, and viewing distance. All young subjects wore contact lenses with no other correction in place. For the VSG testing, a near visual acuity card was used to ensure the participant's ability to read at least the 20/25 line monocularly at 40 cm with the correction in place.
A retinal tomograph (Retina Tomograph II [HRT II]; Heidelberg Engineering, Heidelberg, Germany) was used to acquire images of the optic nerve head and for quantitative analysis of the neuroretinal rim. A company representative performs annual calibration and maintenance. All images were obtained by the same researcher with a test distance of 1.0 to 1.5 cm from the eye, as the subject was viewing a fixation target. The spherical equivalent of the subject's prescription was dialed on the adjustable scanning lens, to focus the image. The quality of an image was assessed by the HRT software and the researcher. Images with a standard deviation of height measure that was more than 40 μm were excluded as unreliable, and the test was repeated. This method resulted in images for all patients that met the criterion of SD no more than 40 μm. The contour line on the optic disc edge was drawn by a single experienced clinician (MWD). The standard reference plane was used.
Stimulus
Two types of stimuli were used, Gabor patches and size III increments. Gabor patches were used only on the VSG apparatus. Size III stimuli, circular achromatic increments with a diameter of 0.43°, were used on both the HFA and VSG. On the HFA, size III stimuli were presented on a 10-cd/m2 uniform background, as a rectangular temporal pulse of 200 ms duration with Weber contrast between 31,500% and 0.3% in 0.1-log unit steps. On the VSG, size III stimuli were presented on a background with a uniform luminance of 12 cd/m2 and with Weber contrast between 900% and 0.1% in 0.15-log unit steps. The size III stimuli and the Gabor patches were presented on the VSG screen with a temporal Gaussian envelope of 600 ms (time constant of 100 ms); 68% of energy was within the central 200 ms.
The Gabor patches had a peak spatial frequency of 0.4 cyc/deg and were presented on a 55 cd/m2 background with Weber contrast between 100% and 0.1% in 0.15-log unit steps. The patches had a two-dimensional spatial Gaussian envelope with 59% of the energy within a circular region 4° in diameter. Spatial bandwidth was 1.0 octave.
Gabor patches were defined as
| (1) |
where: L(x, y) is the luminance (x, y) specified in degrees of visual angle, Lmean (55 cd/m2) is the luminance of the background, (x0, y0) defines the location of the center of the patch, σ (1.5°) is the space constant, ω (0.375 cyc/deg) is the spatial frequency, and C is the contrast.
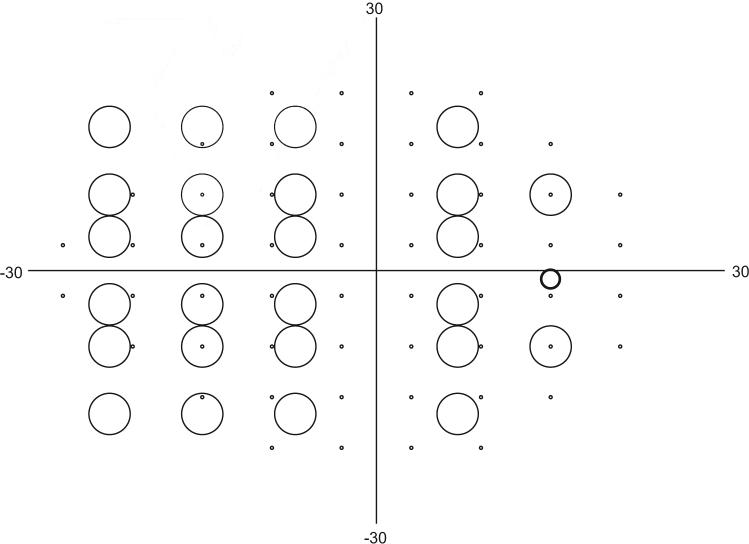
On the HFA, there were 54 locations separated by 6° in an offset grid over the central visual field: 27° nasally and 21° temporally, superiorly, and inferiorly (Fig. 1).
Figure 1.
Map of test locations in CAP and CSP in degrees of visual angle. Small circles: 54 locations tested with CAP; large circles: 26 locations tested with CSP. Circles show relative diameters of the stimuli. Medium circle: average location of the blind spot; patient fixation was monitored by presenting a Gabor stimulus at 100% contrast with a diameter of ∼2°.
For testing on the VSG device, 26 locations over the central visual field were selected for threshold determination (Fig. 1). The chosen number of locations was smaller than for the HFA, to increase the number of trials and allow greater precision for the threshold estimation. The locations were selected for detection of nasal steps and other glaucomatous visual field defects, as well as for assessment of the vertical symmetry of defects. The locations covered an area of the visual field from 23° nasally to 15° temporally and 17° both superiorly and inferiorly. We avoided the central 5° and the area near the typical blind spot (maximum contrast stimuli were presented at the blind spot for the purpose of fixation monitoring and were not used to measure thresholds). Even though CAP and CSP tested similar regions of the visual field, the stimulus locations were rarely identical. The CAP stimulus locations extend to 28.6° nasally, with nasal locations 23° nasal and different vertical offsets. Locations were not evenly spread because of the emphasis on the nasal region and the dimensions of the display monitor. The stimuli did not overlap the vertical or horizontal meridians. For both Gabor patches and size III stimuli, mean luminance was chosen to be within the Weber region to minimize the effects of pupil size and retinal illumination on performance.11
Threshold Algorithm
For the HFA, stimulus presentation and threshold estimation were determined with the Swedish Interactive Thresholding Algorithm (SITA).15 For the VSG, stimulus presentation was determined by a staircase method. At each location in the visual field, the first Gabor patch was presented with the maximum contrast of 100%. The first size III stimulus was presented on the screen with 900% contrast. In the subsequent presentations at that location, the contrast of the stimulus was varied with an adaptive staircase16 procedure driven by the subject's responses and controlled by the computer. The contrast was decreased in steps of 0.3 log unit until the subject did not respond (first reversal); then the contrast of the stimulus was increased by 0.15-log-unit steps until the subject responded (second reversal); the rest of the staircase used steps of 0.15 log unit. Threshold for each location was calculated as the mean of the reversals at a 0.15-log unit step size.
On the VSG, at the locations where the patient did not respond to stimuli at the maximum contrast, the stimuli were presented at least seven more times at maximum contrast. If no response was obtained after eight stimulus presentations, then a psychometric function could not be fit, and the sensitivity was recorded as “not seen.” In addition, sensitivities of 0.11 log unit or smaller were recorded as “not seen.”
When the threshold is near the maximum contrast available, the estimates of fluctuation cannot be accurate, therefore cutoff limits were established for excluding data for study of variability. For the VSG data, locations scored as “not seen” were excluded. For the HFA data, if at least one of the two thresholds was in the range of 0 to 11 dB, then the location was excluded. For depth of defect comparison and analysis of structure–function relations, only unreliable points were excluded.
Limits for reliability of data from the HFA were set by the rate of fixation loss and the false-negative and -positive rates. In addition, the HFA data from locations above and below the blind spot were considered unreliable and were excluded from data analysis. The VSG allowed additional reliability indices.
Fixation stability for both VSG and HFA was monitored by observing the participant directly through a closed-circuit video system and by using the Heijl-Krakau method.17 The first author was present during all the testing, and there was continuous observation of the subject's fixation. If the subject started moving the eye under examination, he or she was instructed to maintain fixation as much as possible.
In the Heijl-Krakau method, stimuli are periodically presented throughout the experiment at the physiological blind spot. A positive response to a stimulus presented at the blind spot indicates either the patient's poor fixation or the patient's tendency to press the button without seeing a stimulus. During this study, there were two instances when a subject's responses to these stimuli were greater than 20%. These subjects were retested on a different day, and if reliable visual field results were obtained, then the subjects were included in the study. One young control subject was excluded based on a high rate of fixation losses, and one patient with glaucoma was retested; during the second test, reliable data were obtained and used in analysis.
On the HFA the location of the center of the blind spot was determined by projecting the stimulus at the standard location of the blind spot and if the subject did not respond to the stimulus, then this location was taken as an individual's blind spot. If an individual responded to at least two stimuli presented at the assumed blind spot, then the testing was suspended and the blind spot was mapped.
On the VSG, the center of the blind spot was estimated for each individual before testing. The blind spot algorithm started testing at 6° temporally and 1° below horizontal midline. A 0.5° diameter circular stimulus was presented at the maximum contrast. At first, the stimulus was presented in 1° increments moving temporally until the subject stopped responding and then began responding again at more temporal locations. The midpoint between the two edges of the “nonseeing” region was considered to be the horizontal center of the blind spot. The vertical parameters were then determined in a similar manner by presenting the stimulus along the line perpendicular to the horizontal center of the blind spot. On the VSG, to evaluate fixation stability during an experiment, Gabor patches or size III stimuli (during the testing of the young subjects with size III stimuli) were presented periodically at the individual's blind spot. Gabor patches projected at the blind spot had most of the energy concentrated over the central 2°, with peak spatial frequency of 0.5 cyc/deg and spatial bandwidth of 3.0 octaves.
The false-positive error score characterizes the tendency of the participant to press the button even when there is no stimulus presented. For the VSG system, the false-positive rate was calculated as the number of responses to blank stimuli divided by the number of blank stimuli presented. For SITA, the false-positive rate was determined based on the number of times the patient pressed a button when it was not expected.18 A false-positive rate higher than 20% was used to exclude data. There were no points excluded based on the false-positive criterion.
For the HFA, the false-negative rate represents the number of times that a subject fails to respond to a stimulus eight times brighter than the threshold that has been already determined at this test point location. A false-negative rate higher than 20% was used to exclude data obtained from normal subjects only. During this study, no visual fields were excluded based on this criterion.
Visual field results of patients with glaucoma who had high false-negative rates were not considered unreliable.13,19–22 A higher false-negative rate in eyes with glaucomatous field loss compared with unaffected eyes may be due to the increased variability in threshold values typically found in such eyes.19 Only two patients had false-negative rates greater than 20%, and when their data were removed, the results did not change.
Data from the VSG were analyzed using five parameters as indices of reliability: rate of fixation loss, false-positive rate, false-negative rate, slope of the psychometric function, and a distribution parameter. The rates of fixation loss and false-positive responses were calculated in the same manner as for the HFA, as described earlier.
The false-negative rate on the VSG system was calculated for each threshold at a particular location separately from other locations, and therefore only that individual threshold was rejected as unreliable in both normal and glaucomatous visual fields if it was 20% or higher. This method is less affected by overall visual field loss and yields more accurate estimates of the false-negative rate than that on HFA.23 The VSG system used a maximum-likelihood method that allows the slope of the psychometric function to vary across locations. When the slope of the psychometric function was less then 1.0, the datum for this particular location was considered unreliable. The slope reflected the overall reliability of the particular threshold and therefore thresholds with shallow slope were excluded as unreliable based on multiple criteria, except for one point of a patient with glaucoma. In the analysis of the age-related normative data, there were 16 points (6% of the data) with high false-negative rates, and in the data of the patients with glaucoma, there were 57 points (10% of the total).
The distribution parameter for each test location was the difference between the mean of the reversals (with steps of 0.15 log unit) and the threshold estimated by the maximum likelihood method. If stimulus contrast in most of the trials for a staircase is higher than the contrast at the 50% seen point of the psychometric function, threshold estimates become less accurate.23 The distribution parameter can be used to identify such staircases, and if it was higher than 0.15 log unit, then we considered that staircase unreliable because of failure to provide the appropriate distribution of stimulus contrasts. In the analysis of the age-related normative data, there were five points excluded based on this criterion.
Protocol
Data were collected at two visits, approximately 1 week apart, and were used to assess both learning effect and test–retest variability.24 The assessment was accomplished by modeling the learning effect as homogenous fluctuation and test–retest variability as heterogeneous fluctuation. Learning effects cause an overall increase in sensitivity from one test to the next (homogeneous fluctuation), as the person becomes more familiar with the task, and were modeled as the average change in sensitivity (in log units) across all locations tested. Test–retest variability is due to the psychophysical algorithm interacting with the subject's frequency-of-seeing curve and was modeled by allowing sensitivity at each location to vary independently (heterogeneous fluctuation).
During the first visit, contrast sensitivity and visual acuity were recorded using Pelli-Robson contrast sensitivity charts and ETDRS logMAR acuity charts.
During each visit, every young participant was tested on the VSG system with Gabor patches (eight and four reversals) and size III stimuli (four reversals), to estimate the test duration and test–retest variability for each set of reversals. Each older control subject and patient with glaucoma was tested on the VSG with Gabor stimuli (six reversals) and on the HFA with the SITA Standard 24−2 visual field test. At the end of the second visit, after the visual field test, patients with glaucoma had an optic nerve head assessment on the HRT II, as an index of structural abnormality.
Statistical Design
To assess variability with the new and standard perimetric stimuli, homogeneous and heterogeneous fluctuations were calculated. Heterogeneous fluctuation reflects variability of the individual threshold estimates and was calculated for every location as the absolute value of the difference in the log contrast sensitivities for the first and second visits. Homogeneous fluctuation reflects an overall change in sensitivity across two visits and was computed for each subject as the mean of differences in log contrast sensitivities between the first and second tests across all the locations. Homogeneous fluctuation sets an upper limit to the effect of change in the subject's criterion from one day to another, and hence sets a lower limit for heterogeneous fluctuation.
We asked several questions in the study:
1. How many reversals are needed to keep test–retest variability low without compromising the validity of the test?
Data were gathered from young control subjects to evaluate the effect of the number of reversals on test–retest variability. An F-test and two linear regressions were used, and statistical significance was set at P < 0.0125. The effect of the number of reversals on variability for Gabor patches with eight- and four-reversal staircases was assessed by using an F-test on heterogeneous fluctuation. To assess the dependence of variability on sensitivity, linear regression was performed on heterogeneous fluctuation versus sensitivity for the two staircases, and a z-score analysis was used to compare the slopes.
2. Is homogeneous fluctuation different for CSP and CAP?
Homogeneous fluctuation was plotted against mean contrast sensitivity for each subject. The Bland-Altman analysis of agreement24 was used to compare learning effects for CSP and CAP.
3. Did the new perimetric stimuli significantly decrease test–retest variability when compared to the standard perimetric stimuli?
To compare the variability of responses of patients with glaucoma to the Gabor and size III stimuli, we applied an F-test, linear regression, and slopes comparison; statistical significance was set at P < 0.0125. An F-test was performed on homogeneous fluctuation for the two devices. We assessed the relation between sensitivity and variability by performing linear regression on heterogeneous fluctuation, and the slopes were compared in z-score analyses.
4. Is sensitivity to depth of defect comparable for CSP and CAP?
Bland-Altman analysis of agreement was used to estimate whether the depth of defect obtained from testing patients on the VSG system is similar to that obtained from testing on the HFA. The two tests could not be compared on a point-by-point basis because different locations were tested on the two devices. The superior and inferior nasal quadrants were extensively tested on both of the tests and were used for this analysis. The sensitivity was converted into linear units and was averaged across all the points in the given quadrant for each patient for each test day, and this average was expressed in log units. Confidence limits were used to determine the range of fluctuations expected solely from test–retest variability. These were computed as 1.96 times the vector sum of standard deviations of homogeneous fluctuation for each test separately. To compensate for the difference in dynamic range on two devices, for CAP we assigned the values of depth of defect that were deeper than −1.34 log units the value of −1.34 log units. This value represented the deepest possible defect that could be measured with CSP on this particular group of subjects.
5. Are the relations between rim area and contrast sensitivity similar for CAP and CSP?
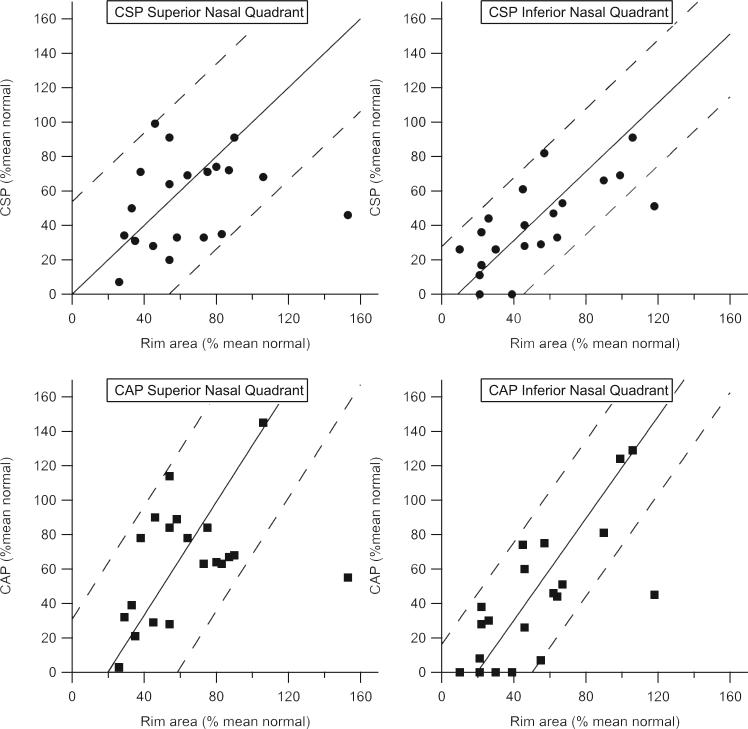
Bland-Altman analysis was used to determine the relations between contrast sensitivity and rim area. Contrast sensitivity from the two test dates was averaged across the nasal hemifields for each device and for every patient. Possible bias due to the different units used on different devices was minimized by expressing results as percentages of the mean normal.
6. Does CSP reduce the effect of the eccentricity on contrast sensitivity?
The effect of eccentricity on contrast sensitivity in normal eyes was assessed using data from young and old control subjects tested with Gabor patches (Fig. 2) and size III stimuli with four-reversal staircases. Linear regression was performed on mean contrast sensitivity versus eccentricity, and z-scores were used to compare the slopes. Statistical significance was set at P < 0.05.
Figure 2.
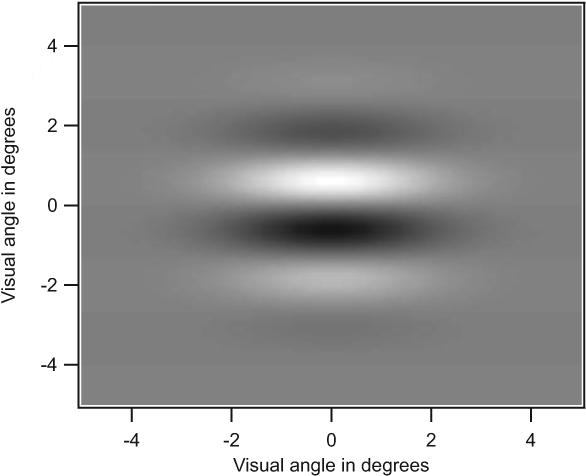
Gabor stimulus as presented on the VSG system. Scale is in degrees of visual angle.
Results
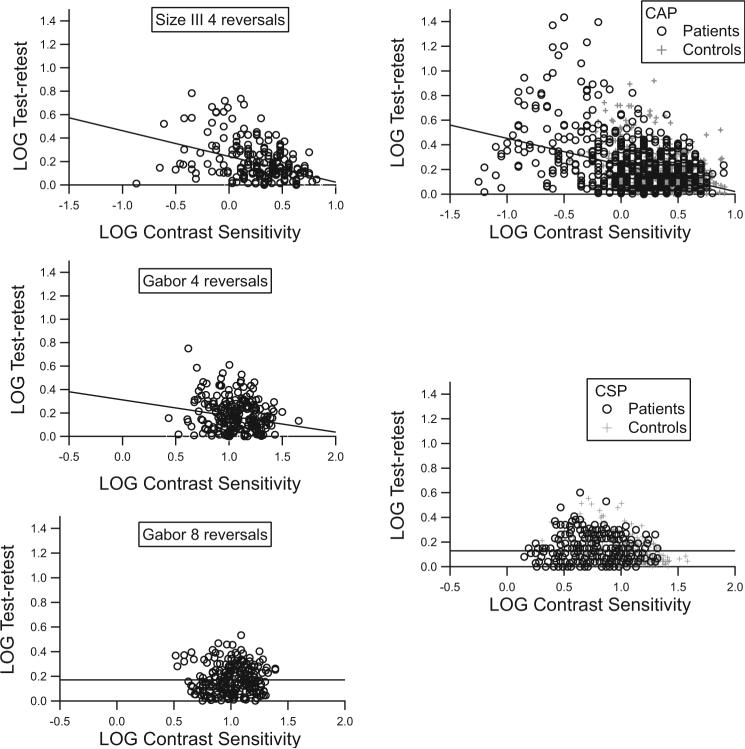
Based on the analysis of data from the young control subjects tested with four- and eight-reversal staircases, patients with glaucoma and age-similar older control subjects were tested with a six-reversal staircase. With the six-reversal staircase, test duration (mean ± SD) was 8.0 ±1.0 minutes, which was similar to test duration with the SITA Standard algorithm (7.5 ± 2.5 minutes). Figure 3 shows test–retest variability at individual locations (heterogeneous variability) versus contrast sensitivity. For the size III stimuli and for the Gabor stimuli with four-reversal staircases, variability increased as sensitivity decreased (r2 > 5%, P < 0.001), with steeper slopes for the size III than for the Gabor stimuli (z > 2.9, P < 0.005). For the Gabor patches with the eight- and six-reversal staircases, the correlation was not significant (r2 = 0.05%, P > 0.5), and the slope was shallower than for the four-reversal staircases (z > 2.4, P < 0.01). Overall test–retest variability for the Gabor patches was not significantly different for the eight- and four-reversal staircases (F = 1.162, P = 0.240).
Figure 3.
Heterogeneous fluctuation versus contrast sensitivity. Left: results for young control subjects: top, size III stimuli with four reversals; middle, Gabor patches with four reversals; bottom, Gabor patches with eight reversals. Right: results for patients and older control subjects: top, size III on the HFA; bottom, Gabor with six-reversal staircases. Lines show results of linear regression. Symbols have been jittered by up to 0.05 log unit, to show overlapping data points.
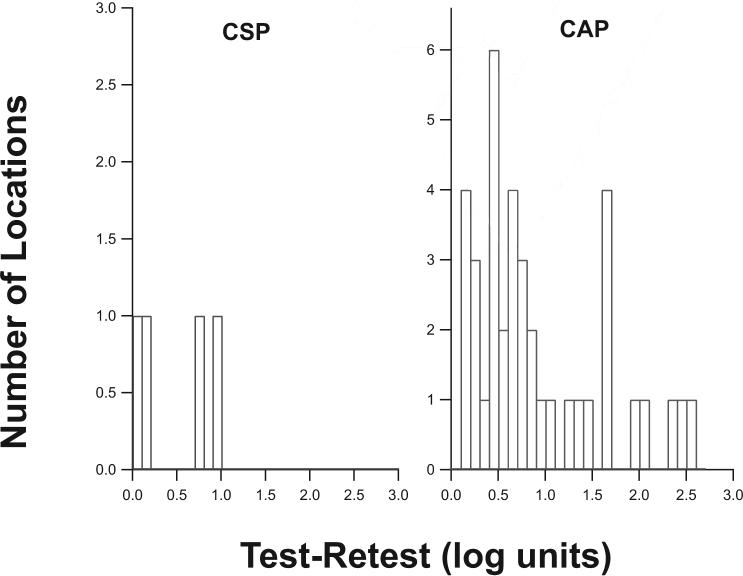
Test–retest variability in severely damaged areas was further analyzed by examining locations where the maximum stimulus provided by the device was not seen in at least one of the two trials (Fig. 4). There were 57 such locations for CSP and 132 locations for CAP, consistent with CSP's testing half as many locations as CAP. For CAP, in 19% of these locations, threshold on the other visit was more than 0.5 log unit below the maximum stimulus; with CSP, this difference occurred in only 4% of locations.
Figure 4.
Distribution of test–retest differences for locations where the patient did not see the stimulus at maximum contrast at one visit, but did see it at the other visit. The y-axes are scaled to span the range from 0% to 5% of the total number of locations for which the maximum contrast was not seen on at least one visit.
Assessment of homogenous fluctuation showed, on average, minimal learning effects (<0.1 log unit) for both CAP and CSP. Figure 5 shows homogeneous fluctuation for older control subjects and patients with glaucoma; 95% confidence limits for homogeneous fluctuation were ±0.2 log unit and were not significantly different for CSP and CAP (P = 0.37, F = 1.53).
Figure 5.
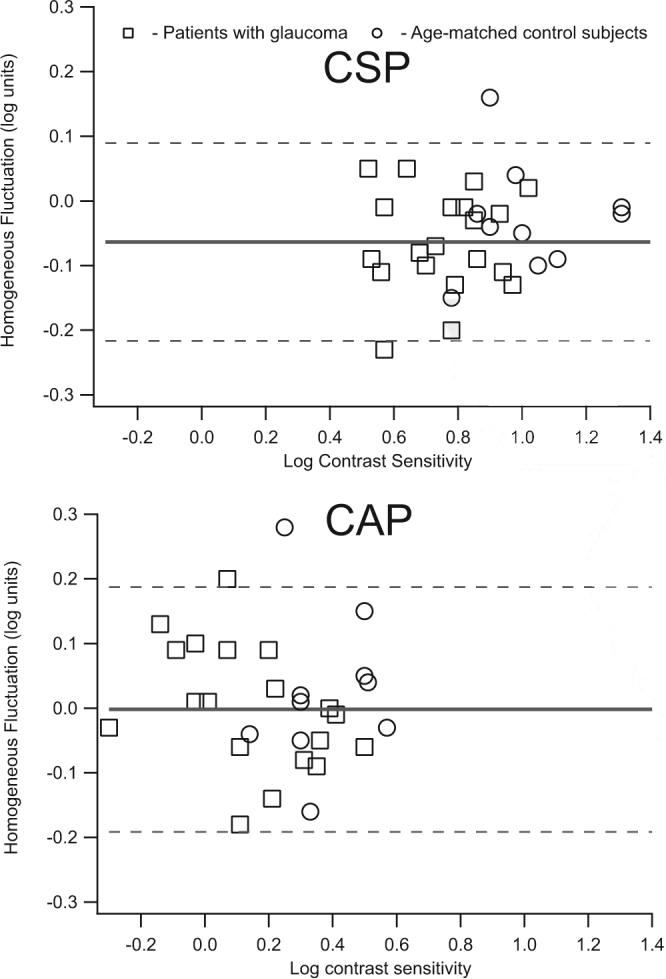
Homogeneous fluctuation for patients with glaucoma and age-similar control subjects as a function of mean contrast sensitivity for each subject. Top: data obtained from CSP with Gabor patches with six-reversal staircases; bottom: data obtained from CAP with the SITA-Standard algorithm. Dashed lines: 95% confidence limits for homogeneous fluctuation; these were not significantly different for CSP versus CAP (F = 1.53, P = 0.37).
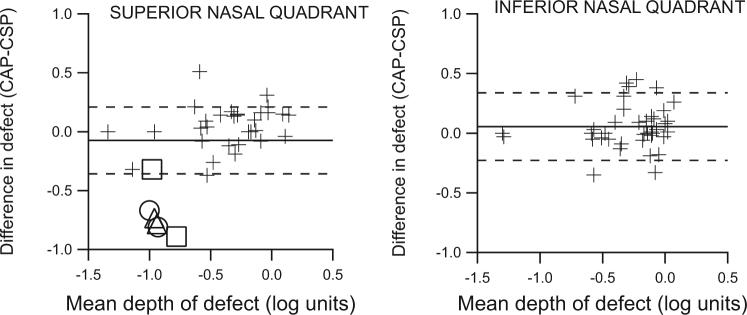
Depth of defect was, on average, comparable for CSP and CAP, as shown in Figure 6 for the nasal quadrants. The average difference in defect depths was near zero, and most of fluctuation was consistent with homogenous fluctuation (Fig. 5). However, there were three patients who had many nonseeing points with CAP but not with CSP. Measurements were reliable according to the indices and repeatable across two visits, and so these patients seemed to have deeper defects for CAP than for CSP. However, due to the small sample size, no definitive conclusion can be made at this point.
Figure 6.
Analysis of agreement of CSP and CAP measures of damage to a quadrant of the central visual field. Left: for upper nasal quadrants; right: lower nasal quadrants; dashed lines: 95% confidence limits based on homogeneous fluctuations for the two tests. Open symbols: overall sensitivity for superior quadrants of three patients (one symbol per visit) who had many nonseeing points for CAP but not for CSP.
The relations between rim area and perimetric sensitivity were similar with CAP and CSP in both the upper and lower nasal quadrants, as shown in Figure 7. Bland-Altman analysis of agreement showed that for CAP the loss in sensitivity in the areas of severe damage was greater than the loss of rim tissue. With CSP, perimetric and rim losses were more consistent, even in eyes with extensive loss (z = 9.3, P < 0.001).
Figure 7.
Mean perimetric sensitivity versus area of corresponding sector of neuroretinal rim, with both measures expressed as a percentage of mean normal. Solid and dashed lines: results of analysis of agreement (mean and 95% confidence limits). The relation between defect depth and rim area was more consistent with CSP than with CAP (z = 9.3, P < 0.001).
The effect of eccentricity on contrast sensitivity was less dramatic with the Gabor patches than with the size III stimulus, as shown in Figure 8. With four-reversal staircases, the decline in sensitivity with eccentricity was significantly shallower with Gabor patches than with the size III stimulus (z = 3.78, P = 0.0001). The data obtained from testing older control subjects yielded similar results.
Figure 8.
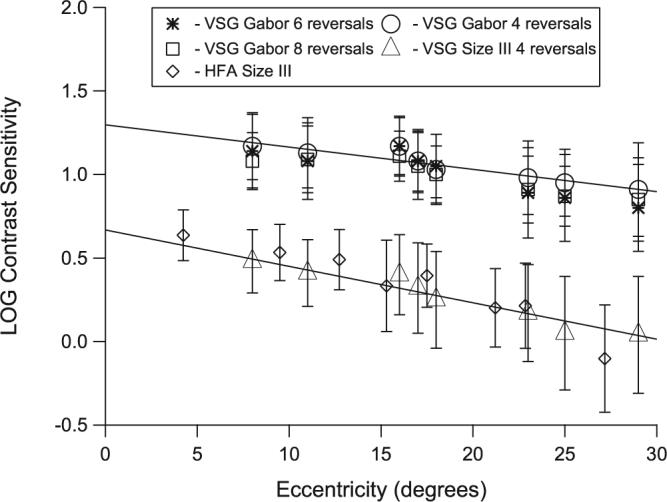
Mean sensitivity as a function of eccentricity in both control groups (younger group: four and eight reversals; older group: six reversals and HFA). Error bars represent ±1 SD for the younger control group.
Discussion
The purpose of this study was to design a form of CSP that would be suitable for clinical use. We found that depth of defect measured by CSP was on average comparable to that measured with CAP and that both structure–function relations and test–retest variability showed less of a dependence on extent of loss with CSP than with CAP. This form of CSP therefore meets the criteria we set for CSP to have potential for routine clinical use.
The present study extended the findings of Pan et al.6 by creating a clinically useful test. Pan et al. confirmed the findings of Pearson et al.5 with chromatic stimuli and extended their approach by using Gabor patches.6 However Pan et al. were restricted to using only eight locations, to allow the use of 12-reversal staircases without fatiguing the subjects. By retrospectively analyzing their data, they found that low variability could also have been achieved with Gabor stimuli with fewer reversals. In the present study, data from the young control subjects were used to assess the effect of the number of reversals on tests using a much larger number of locations than used by Pan et al. Although a large number of reversals can improve psychophysical threshold estimation, with the large number of locations tested in perimetry any increase in test duration can introduce fatigue and actually increase variability. Mean test duration (± SD) for the eight-reversal staircase was 14.0 ± 0.6 minutes, almost twice that for clinical perimetry, and did not yield significantly lower variability than the four-reversal staircase (5.0 ± 0.5 minutes). However, the dependence of variability on sensitivity was significantly lower in the eight-reversal staircase. To decrease test duration and to maintain low variability, older control subjects and patients with glaucoma were tested with a six-reversal staircase.
CAP with a size III stimulus has a dynamic range of 2.5 to 3.5 log units across locations and ages. With CSP, we found a dynamic range of 1.0 to 1.3 log units. There were two methods used to minimize potential statistical artifacts due to the difference in dynamic ranges. First, for the study of variability, with CAP all locations with sensitivities of 11 dB or smaller were scored as “not seen” and were excluded. Second, in the study of structure–function relations, all measures were converted to the percentage of mean normal.
A potential advantage of CSP over CAP is that the dynamic range appears to show less variation across subjects and locations. Figure 8 demonstrates the smaller eccentricity effects with the Gabor patches than with the size III stimuli, which is consistent with results in previous studies.25
With both CSP and CAP, homogeneous fluctuation showed a mean learning effect of less than 0.1 log unit (Fig. 5), whereas heterogeneous fluctuation was often greater than 0.4 log unit (Fig. 3). Because mean learning effects were small, we were readily able to detect the dependence of test–retest variability on sensitivity for the size III stimulus (Fig. 3). Test–retest variability correlated with sensitivity for the size III stimulus but not for the Gabor patches (Fig. 3). This finding cannot be attributed to learning effects, because mean test–retest variability with the Gabor stimuli was lower than with the size III stimuli.
The correlations between test–retest and sensitivity assessed in this study are consistent with those in a recent report by Artes et al.,7 who compared perimetric sensitivities for the 24−2 pattern of test locations with CAP and with the Humphrey FDT Matrix (Carl Zeiss Meditec, Inc.), which uses as a stimulus a 0.5-cyc/deg grating in a square region 5° across. They found that grating sensitivity had low variability without a significant dependence on sensitivity, just as we found with CSP (Fig. 5). Artes et al. found that sensitivities to the two stimuli had a constant ratio over the first log unit of contrast sensitivity, and we found that the average effect of glaucomatous loss was similar on CSP and CAP (Fig. 6). They found that when sensitivity was reduced by more than a log unit, sensitivity to a large sinusoidal stimulus was not reduced as much as sensitivity to the size III stimulus used in CAP, consistent with our results for patients with extensive CAP defects.
Garway-Heath et al.26 found a linear relation between area of the neuroretinal rim and perimetric sensitivity. The present study extended their finding by using the Bland-Altman analysis to quantify confidence limits and to assess systematic differences. The relation between rim area and perimetric sensitivity was similar for CAP and CSP for both upper and lower nasal quadrants. With both tests, the mean difference between rim and perimetric measured was close to zero when expressed as a percentage of mean normal. However, the slope of the regression line for Bland-Altman analysis was significantly shallower for CSP than for CAP. Our results indicate that with CAP but not with CSP the loss in sensitivity in the areas of severe damage was greater than the loss of rim area.
The overall test–retest variability was similar in CAP and CSP, with CSP having less dependence on sensitivity than CAP. With CAP, test–retest variability was higher in areas with low sensitivity, which becomes problematic for monitoring response to treatment. The reduced variability with CSP in damaged areas may reduce this problem. Further studies are needed to assess this finding.
There were several collateral findings in the study that cannot be adequately evaluated due to the small number of subjects; therefore, further study is needed. For the younger and older control subjects, evaluation of eccentricity's effects on CSP versus CAP was not the primary goal, but we did find strong evidence that the effects of eccentricity were smaller with the Gabor stimulus from CSP than with the size III stimulus from CAP. We also found that in severely damaged areas, defect depth could be much greater with CAP than with CSP. This study included patients with a wide range of severity of glaucomatous damage, and so a larger sample of patients with advanced or end-stage glaucoma would be needed to evaluate this finding.
Conclusion
We achieved our goal of developing a perimetric test using a sinusoidal stimulus with low-frequency spatial and temporal modulation and demonstrated reasonably low test–retest variability, as well as good sensitivity to defect.
Further research is necessary to evaluate findings that were not part of the primary focus of this study. Our primary finding is that CSP has strong potential to be used clinically to improve monitoring progression and response to treatment.
Acknowledgments
Supported by National Eye Institute Grant EY007716 (WHS).
Footnotes
Publisher's Disclaimer: This PDF receipt will only be used as the basis for generating PubMed Central (PMC) documents. PMC documents will be made available for review after conversion (approx. 2−3 weeks time). Any corrections that need to be made will be done at that time. No materials will be released to PMC without the approval of an author. Only the PMC documents will appear on PubMed Central -- this PDF Receipt will not appear on PubMed Central.
Disclosure: A. Hot, None; M.W. Dul, None; W.H. Swanson, Carl Zeiss Meditec (C)
References
- 1.Artes PH, Iwase A, Ohno Y, Kitazawa Y, Chauhan BC. Properties of perimetric threshold estimates from Full Threshold, SITA Standard, and SITA Fast strategies. Invest Ophthalmol Vis Sci. 2002;43:2654–2659. [PubMed] [Google Scholar]
- 2.Fellman RL, Lynn JR, Starita RJ, Swanson WH. Clinical importance of spatial summation in glaucoma.. In: Hejil A, editor. Proceedings of the VIIIth International Perimetric Society Meeting; Vancouver (Canada); Berkeley, CA. May 9−12, 1988; Kugler & Ghedini; 1989. pp. 313–324. Perimetry Update 1988/1989. [Google Scholar]
- 3.Wall M, Kutzko KE, Chauhan BC. Variability in patients with glaucomatous visual field damage is reduced using size V stimuli. Invest Ophthalmol Vis Sci. 1997;38:426–435. [PubMed] [Google Scholar]
- 4.Wilensky JT, Mermelstein JR, Siegel HG. The use of different-sized stimuli in automated perimetry. Am J of Ophthalmol. 1986;101:710–713. doi: 10.1016/0002-9394(86)90775-0. [DOI] [PubMed] [Google Scholar]
- 5.Pearson P, Swanson WH, Fellman RL. Chromatic and achromatic defects in patients with progressing glaucoma. Vision Res. 2001;41:1215–1227. doi: 10.1016/s0042-6989(00)00311-4. [DOI] [PubMed] [Google Scholar]
- 6.Pan F, Swanson WH, Dul MW. Evaluation of a two-stage neural model of glaucomatous defect: an approach to reduce test-retest variability. Optom Vis Sci. 2006;83:499–511. doi: 10.1097/01.opx.0000225091.60457.f4. [DOI] [PMC free article] [PubMed] [Google Scholar]
- 7.Artes PH, Hutchison DM, Nicolela MT, LeBlanc RP, Chauhan BC. Threshold and variability properties of matrix frequency-doubling technology and standard automated perimetry in glaucoma. Invest Ophthalmol Vis Sci. 2005;46:2451–2457. doi: 10.1167/iovs.05-0135. [DOI] [PubMed] [Google Scholar]
- 8.Sun H, Dul WM, Swanson HW. Linearity can account for the similarity among conventional, frequency-doubling, and Gabor-based perimetric tests in the glaucomatous macula. Optom Vis Sci. 2006;83:455–465. doi: 10.1097/01.opx.0000225103.18087.5d. [DOI] [PMC free article] [PubMed] [Google Scholar]
- 9.Ramesh SV, George R, Soni PM, et al. Population norms for frequency doubling perimetry with uncorrected refractive error. Optom Vis Sci. 2007;84(6):496–504. doi: 10.1097/OPX.0b013e31806db55e. [DOI] [PubMed] [Google Scholar]
- 10.White AJ, Sun H, Swanson WH, Lee BB. An examination of physiological mechanisms underlying the frequency-doubling illusion. Invest Ophthalmol Vis Sci. 2002;43:3590–3599. [PubMed] [Google Scholar]
- 11.Swanson WH, Dul MW, Fischer SE. Quantifying effects of retinal illuminance on frequency-doubling perimetry. Invest Ophthalmol Vis Sci. 2005;46:235–240. doi: 10.1167/iovs.04-0264. [DOI] [PubMed] [Google Scholar]
- 12.Harwerth RS, Crawford ML, Frishman LJ, Viswanathan S, Smith EL, 3rd, Carter-Dawson L. Visual field defects and neural losses from experimental glaucoma. Prog Retin Eye Res. 2002;21(1):91–125. doi: 10.1016/s1350-9462(01)00022-2. [DOI] [PubMed] [Google Scholar]
- 13.Anderson DR, Patella VM. Automated Perimetry. 2nd ed Mosby; St. Louis: 1999. pp. 152–153. [Google Scholar]
- 14.Campbell FW, Green DG. Optical and retinal factors affecting visual resolution. J Physiol. 1965;181(3):576–593. doi: 10.1113/jphysiol.1965.sp007784. [DOI] [PMC free article] [PubMed] [Google Scholar]
- 15.Bengtsson B, Olsson J, Heijl A, Rootzen H. A new generation of algorithms for computerized threshold perimetry, SITA. Acta Ophthalmol Scand. 1997;75:368–375. doi: 10.1111/j.1600-0420.1997.tb00392.x. [DOI] [PubMed] [Google Scholar]
- 16.Wetherill GB, Levitt H. Sequential estimation of points on a psychometric function. Br J Math Stat Psychol. 1965;18:1–10. doi: 10.1111/j.2044-8317.1965.tb00689.x. [DOI] [PubMed] [Google Scholar]
- 17.Heijl A, Krakau CE. An automatic perimeter for glaucoma visual field screening and control: construction and clinical cases. Albrecht Von Graefes Arch Klin Exp Ophthalmol. 1975;197:13–23. doi: 10.1007/BF00506636. [DOI] [PubMed] [Google Scholar]
- 18.Newkirk MR, Gardiner SK, Demirel S, Johnson CA. Assessment of false positives with the Humphrey Field Analyzer II perimeter with the SITA Algorithm. Invest Ophthalmol Vis Sci. 2006;47(10):4632–4637. doi: 10.1167/iovs.05-1598. [DOI] [PubMed] [Google Scholar]
- 19.Bengtsson B, Heijl A. False-negative responses in glaucoma perimetry: indicators of patient performance or test reliability? Invest Ophthalmol Vis Sci. 2000;41:2201–2204. [PubMed] [Google Scholar]
- 20.Heijl A, Lindgren G, Olsson J. Reliability parameters in computerized perimetry. Doc Ophthalmol. 1987;49:593–600. [Google Scholar]
- 21.Katz J, Sommer A. Reliability indexes of automated perimetric tests. Arch Ophthalmol. 1988;106:1252–1254. doi: 10.1001/archopht.1988.01060140412043. [DOI] [PubMed] [Google Scholar]
- 22.Katz J, Sommer A. Screening for glaucomatous visual field loss: the effect of patient reliability. Ophthalmology. 1990;97:1032–1037. doi: 10.1016/s0161-6420(90)32467-3. [DOI] [PubMed] [Google Scholar]
- 23.Swanson WH, Birch EE. Extracting thresholds from noisy psychophysical data. Percept Psychophys. 1992;51:409–422. doi: 10.3758/bf03211637. [DOI] [PubMed] [Google Scholar]
- 24.Bland JM, Altman DG. Statistical methods for assessing agreement between two methods of clinical measurement. Lancet. 1986;1:307–310. [PubMed] [Google Scholar]
- 25.Pointer JS, Hess RF. The contrast sensitivity gradient across the human visual field: with emphasis on the low spatial frequency range. Vision Res. 1989;29:1133–1151. doi: 10.1016/0042-6989(89)90061-8. [DOI] [PubMed] [Google Scholar]
- 26.Garway-Heath DF, Holder GE, Fitzke FW, Hitchings RA. Relationship between electrophysiological, psychophysical, and anatomical measurements in glaucoma. Invest Ophthalmol Vis Sci. 2002;43:2213–2220. [PubMed] [Google Scholar]


