

Abstract
The relationship between the free Ca2+ concentration and the apparent dissociation constant for the complex between calmodulin (CaM) and the neuromodulin IQ domain consists of two phases. In the first phase Ca2+ bound to the C-ter EF hand pair in CaM increases the Kd for the complex from the Ca2+-free value of 2.3±0.1 μM to a value of 14.4±1.3 μM. In the second phase Ca2+ bound to the N-ter EF hand pair reduces the Kd for the complex to a value of 2.5±0.1 μM, reversing the effect of the first phase. Due to energy coupling effects associated with these phases the mean dissociation constant for Ca2+-binding to the C-ter EF hand pair is increased ~3-fold, from 1.8±0.1 to 5.1±0.7 μM, and the mean dissociation constant for Ca2+-binding to the N-ter EF hand pair is decreased by the same factor, from 11.2±1.0 to 3.5±0.6 μM. These characteristics produce a bell-shaped relationship between the apparent dissociation constant for the complex and the free Ca2+ concentration, with a distance of 5–6 μM between the midpoints of the rising and falling phases. Release of CaM from the neuromodulin IQ domain therefore appears to be promoted over a relatively narrow range of free Ca2+ concentrations. Our results demonstrate that CaM-IQ domain complexes can function as a biphasic Ca2+ switches through opposing effects of Ca2+ bound sequentially to the two EF hand pairs in CaM.
The Ca2+-binding protein calmodulin (CaM) plays a central role in transducing Ca2+ signals through its interactions with more than 30 different target proteins. Many of these, such as phosphodiesterase, myosin light chain kinase and the constitutive nitric oxide synthases do not interact significantly with Ca2+-free CaM (apoCaM) (1–4). However, a large class of targets bind apoCaM at least as well as the Ca2+-liganded forms of the protein. The majority of these, including neuromodulin, neurogranin, the unconventional myosins and some Ca2+, K+ and Na+ channels interact with CaM via IQ domains, which have the consensus sequence: [I,L,V]QxxxR[G,x]xxx[R,K] (5, 6). These regions bind apoCaM and/or Ca2+-liganded CaM with dissociation constants ranging from subnanomolar to micromolar, depending upon their precise sequence and context (6). CaM-IQ domain complexes have been implicated in a variety of regulatory processes, including positive and negative regulation of ion channels and unconventional myosin based motility (6). Some IQ domain proteins have been proposed to function as local intracellular stores of CaM (7).
The potential importance of such stores has been heightened by recent investigations indicating that the intracellular CaM concentration is limiting: We have found that a dephosphorylation-dependent increase in the amount of CaM bound to nitric oxide synthase in endothelial cells significantly reduces the available CaM concentration during a Ca2+ signal, and inhibits the activity of the plasma membrane Ca2+ pump and presumably other CaM targets (8). Rahkilin and coworkers have recently demonstrated that a limiting CaM concentration in neurons results in similar coupling among target activities (9). Finally, the work of Isotani and coworkers suggests that the CaM concentration is limiting in smooth muscle tissue (10). Thus, CaM and its targets can be considered to form what we have termed the CaM network (11). Although the available CaM concentration is a function of all its various interactions, proteins that function as CaM stores are of particular interest, as they are likely to contribute in important ways to the form and function of the CaM network. Neuromodulin, a neuronal IQ domain protein found in axons and terminals, is perhaps the best studied example of such a protein (7). Neurogranin, a smaller protein with an essentially identical IQ domain, is thought to perform a similar function in dendritic spines (12, 13).
In this paper we describe a steady-state mechanism for Ca2+-dependent switching in the neuromodulin CaM-IQ domain complex. A surprising aspect of this mechanism is its fundamentally biphasic nature: Ca2+ binding one EF hand pair in CaM decreases the affinity of the complex; binding to the other then completely reverses this effect. The result is a bell-shaped relationship between the apparent dissociation constant for the complex and the free Ca2+ concentration.
Materials and Methods
Proteins
The cDNA encoding BSCaMIQ1, a fluorescent reporter that binds CaM via an IQ domain sequence derived from neuromodulin, was assembled in a modified pET30a vector (Novagen, Inc.). The composition of BSCaMIQ is similar to that of other CaM biosensors we have developed (14, 15), except that it contains a form of enhanced yellow fluorescent protein (EYFPC) in which the pKa for fluorescence quenching is shifted from a value of ~7 to a value of ~6, which increases EYFP fluorescence emission under the conditions used in these investigations (16). The CaM-binding sequence bridging the ECFP and EYFPC variants in BSCaMIQ: AAATKIQA[A]FRGHITRKKLKGEKKGAA, is based on the IQ domain region in neuromodulin (neuromodulin sequence underlined), differing only in the substitution of an Ala residue (in brackets) for a Ser. This corresponds with position 41 in the neuromodulin amino acid sequence (17). Phosphorylation at this position in full-length neuromodulin blocks CaM binding, but substitution of a Gly residue does not affect binding (17). We have also developed a bipartite fluorescent reporter system consisting of EYFPC-neuromodulin and ECFP-CaM fusion proteins. In the neuromodulin fusion the fluorescent protein is joined to the N-terminus of full-length native neuromodulin via a Gly-Thr amino acid pair. In the CaM fusion the fluorescent protein is joined to the N-terminus of native CaM via a GASGSAAAG polypeptide linker. All fluorescent protein constructs were expressed with amino-terminal 6-His tags in BL21(DE3), and were purified using Ni+-chelate affinity chromatography as described previously (18). Both of these fluorescent reporter systems are represented schematically in Fig. 1.
Fig. 1. Fluorescent reporter systems used to monitor interactions between CaM and the neuromodulin IQ domain. (A).
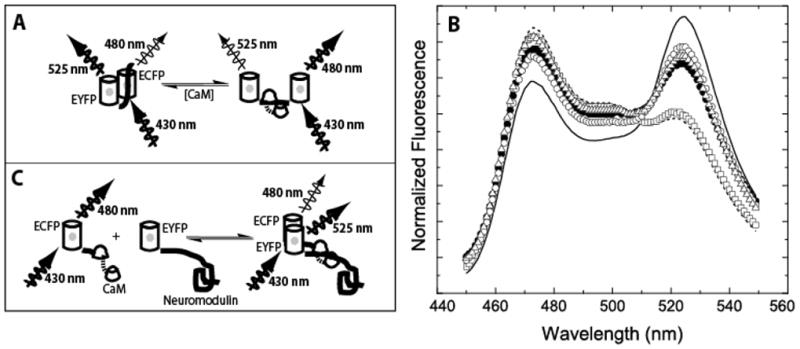
BSCaMIQ consists of ECFP and EYFP variants of GFP joined by an IQ domain. When CaM is bound to this domain changes in the orientation and/or distance between the two fluorescent proteins decrease fluorescence resonance energy transfer (FRET) between the ECFP and EYFP components. Thus, under 430 nm excitation ECFP donor fluorescence, measured at 480 nm, is increased and EYFP acceptor fluorescence, measured at 525 nm, is decreased. (B) Complete fluorescence emission spectra for BSCaMIQ under 430 nm excitation. The solid line is the emission spectrum determined in the absence of CaM, the dashed line is the spectrum determined in the presence of a saturating apoCaM concentration. The remaining spectra were determined in the presence of saturating concentrations of Ca2+-free NCxCaM or NxCCaM (□), Ca2+-saturated native CaM (●), NxC2CaM (○) and N2CxCaM (△). (C) A bipartite reporter system consisting of ECFP-CaM and EYFP-neuromodulin fusion proteins. As illustrated in the figure, formation of the complex between CaM and neuromodulin allows FRET between the ECFP and EYFP labels to occur under 430 nm excitation.
Native and mutant CaMs were expressed and purified as described in detail elsewhere (19, 20). The two mutant CaMs used in these studies are NxCCaM (NxC), in which glutamic acid residues at positions 31 and 67 in the N-ter EF-hands have been replaced by alanines, and NCxCaM (NCx), in which the homologous glutamic acid residues at positions 104 and 140 have been replaced. These mutations eliminate Ca2+ binding to the N-ter or C-ter EF hand pair, as indicated by the “x” subscript.
Fluorescence measurements
A Photon Technologies International (Monmouth Junction, NJ) QM-1 fluorometer operated in photon-counting mode was used for all steady-state fluorescence measurements. Monochromator excitation and emission slit widths were set to produce bandwidths of ~2.5 nm. All experiments were performed at 23 °C. The standard experimental buffer contained 25 mM Tris (pH 7.5), 0.1 M KCl, 100 μg/ml BSA, and other components as specified in the text or captions. For analysis of the Ca2+-dependencies of native and mutant CaM complexes, buffered free Ca2+ concentrations were produced using 1.5 mM BAPTA, 1.5 mM dibromo-BAPTA and various amounts of added of CaCl2. Stated free Ca2+ concentrations were measured using 250 nM indo-5F or mag indo-1 according to established procedures (Molecular Probes, Inc.). As we have demonstrated elsewhere, there is no significant spillover in the fluorescence emissions of these Ca2+ indicator dyes and the BSCaMIQ reporter (8, 21).
When required, proteins and buffers were decalcified by successive treatments with Chelex™ and a BAPTA-polystyrene column (Molecular Probes, Inc.). Contaminating amounts of Ca2+ in protein solutions at their stated working concentrations were 150 nM or less, based on the absence of any detectible effect on the A263 of dibromo-BAPTA.
Analysis of fluorescence data
Fractional changes in fluorescence were analyzed to extract apparent Kd values for native or mutant CaMs using a standard hyperbolic binding equation, where FR is fractional response as defined in the relevant figure legends:
| (1) |
A sequential Ca2+ binding model was used to analyze fractional changes in fluorescence due to Ca2+-dependent dissociation of the NxCCaM or NCxCaM complexes with BSCaMIQ:
| (2) |
where K1 and K2 in this case designate the apparent dissociation constants for the two sites in the functional EF hand pairs. A sequential mechanism for Ca2+ binding to the individual EF hands is assumed. This is supported by investigations in which Ca2+ binding to individual EF hands have been monitored spectrally (22–24). We have also assumed that dissociation requires occupancy of both sites in an EF hand pair. This may not be strictly correct, since NMR investigations indicate that occupancy of a single Ca2+-binding site can produce significant conformational changes in CaM (24). However, under steady-state conditions positive cooperativity between the sites in each EF hand pair restricts the amount of CaM with only one site occupied to negible levels (25).
Direct determinations of Ca2+ binding constants
Direct Ca2+-binding measurements were performed as described by Linse and coworkers (26, 27). In this approach Ca2+ binding to a BAPTA or dibromo-BAPTA chelator is measured based on its optical absorbance at 263 nm as known increments of Ca2+ are added to an initially decalcified solution containing the chelator and the Ca2+-binding protein of interest. The absolute amounts of free Ca2+ and Ca2+ bound to the chelator after each addition can thus be estimated, with the amount bound to the protein accounting for the remainder (28). We have found a 0.5 to 1 molar ratio of chelator to protein Ca2+-binding sites to yield the best determined Ca2+ dissociation constants. Apparent Ca2+ dissociation constants for proteins were derived from direct fits to observed chelator absorbance using the Caligator software package (28). A general four-site Adair equation was used to define Ca2+ binding to native CaM:
| (3) |
where θ is the fractional saturation of the four sites in this protein. An abbreviated form of this expression was used to describe binding to the two CaM mutants, NCxCaM and NxCCaM, which have only one functional EF hand pair:
| (4) |
Modeling
The theoretical curves presented in Figs 8 and 9 were calculated using the Berkeley Madonna software package (Macey and Oster, Inc). For this purpose an expanded version of the scheme presented in Fig. 7 was used in which Ca2+ binding to each EF hand pair is treated as a two-step sequential process. Since all simulations were allowed to reach a steady-state, only the ratios of the rate constants used for each step in the mechanism are important, and these are defined by the steady-state interaction parameters listed in Tables 1 and 2.
Fig. 8. The relationship between the free Ca2+-concentration and the dissociation constant for the complex between CaM and the neuromodulin IQ domain is bell shaped.
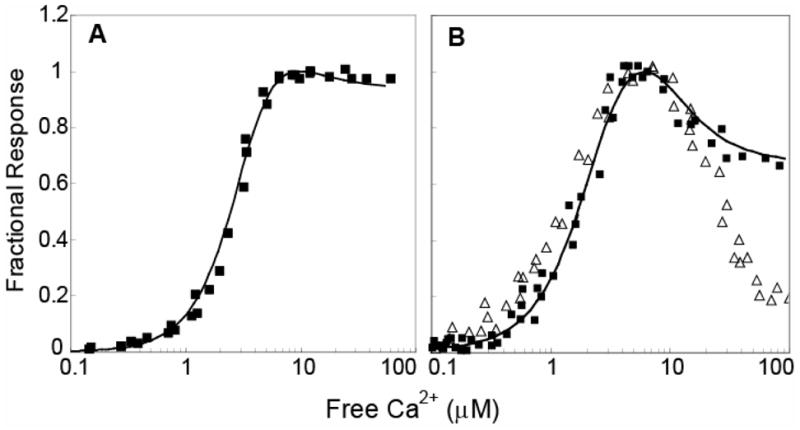
All free Ca2+ concentrations were verified using indo-5F or mag-indo-1. (A) The fractional fluorescence response of 250 nM BSCaMIQ in the presence of 20 μM CaM (B) The fractional fluorescence response of 5 μM BSCaMIQ in the presence of 1 μM CaM (■), and the fractional response of a solution of 1 μM ECFP-CaM and 5 μM EYFP-neuromodulin (△). Because FRET increases when this complex is formed, the fractional response in this case defined as (F−Fmin)/(Fmax−Fmin). The curves in both panels were calculated as described under “Materials and Methods” according to the scheme depicted in Fig. 7. The Fmin/Fmax values used to generate for these curves were adjusted slightly to achieve the fits shown. All adjusted values were within 3% of the mean values given in Table 1.
Fig. 9. Various species produced in a solution of neuromodulin (NM) and CaM as a function of the free Ca2+ concentration.
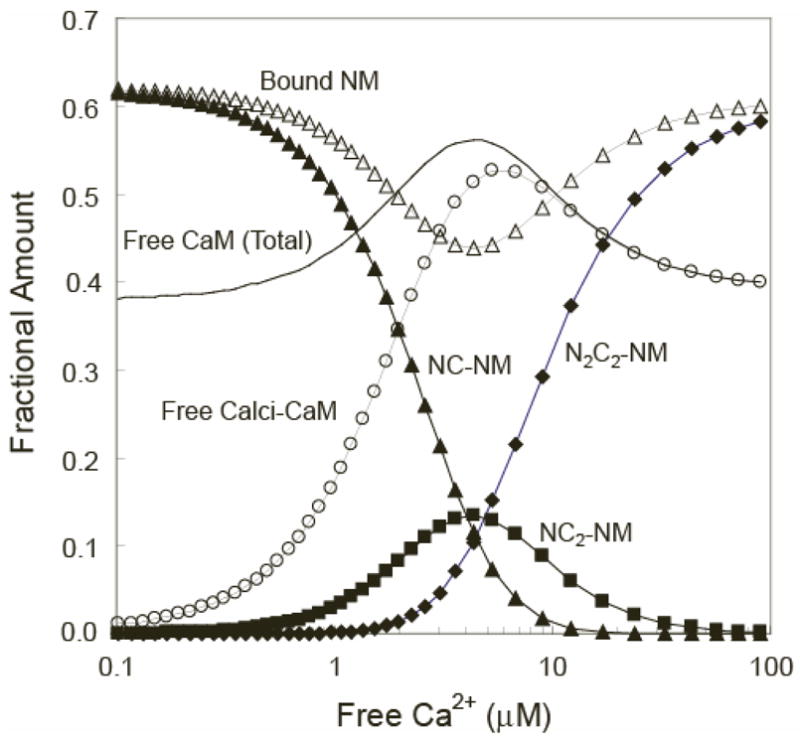
Calculations were performed as described under “Materials and Methods” using CaM and NM concentrations of 10 μM based on the scheme depicted in Fig. 7. All calculated concentrations are expressed relative to the total CaM concentration. Curves correspond with the relative concentrations of bound NM (△), total free CaM (no symbol), free calci-CaM (○), NCCaM-NM complex (▲), NC2CaM-NM complex (■), and N2C2CaM-NM complex (◆). Calci-CaM refers to the total of all free Ca2+-liganded CaM species, which primarily consist of NC2CaM and N2C2-CaM. Otherwise, the nomenclature for the various Ca2+-liganded species of CaM is given in the legend to Table 1.
Fig. 7. Minimal scheme for Ca2+-dependent switching in the neuromodulin CaM-IQ domain complex.
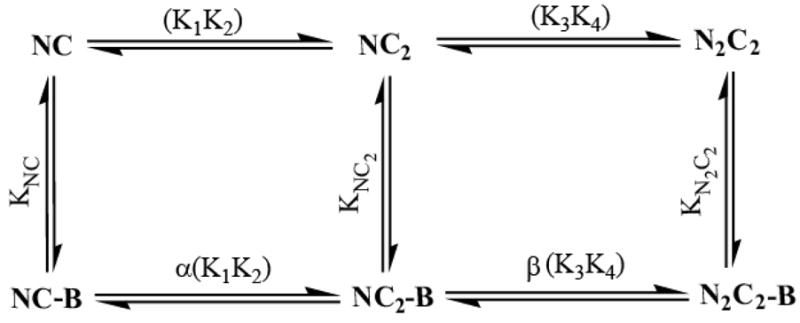
Ca2+ binding via the N-ter→C-ter pathway depicted in the general scheme appears to be strongly disfavored, so it can be omitted from the minimal scheme describing the Ca2+-dependence of the CaM-neuromodulin complex under steady-state conditions.
Table 1. Apparent Kd values for the complexes between BSCaMIQ and native or mutant CaMs.
B refers to bound BSCaMIQ. N and C refer to the C-ter and N-ter EF hand pairs in CaM, with subscripts indicating the Ca2+-liganded state or the inability to bind Ca2+ due to mutagenesis (x). The absence of a subscript indicates a native Ca2+-free EF hand pair. The nominal affinity given for the NC2-B complex was determined at a 10 μM free Ca2+ concentration. Standard errors were derived from the diagonal elements in the variance-covariance matrices for the fitted curves. Fmin/Fmax is the ratio of the 525 nm fluorescence emissions of the BSCaMIQ complex with native or mutant CaM (Fmin) and the emission of free BSCaMIQ (Fmax).
| NC-B | N2C2-B | NCx-B | N2Cx-B | NxC-B | NxC2-B | NC2-B | |
|---|---|---|---|---|---|---|---|
| Kd (μM) | 2.3±0.1 | 2.5±0.1 | 2.5±0.3 | 36.7±3.9 | 2.1±0.2 | 14.4±1.3 | 10.8±1.1 |
| Fmin/Fmax | 0.68±0.2 | 0.83±0.3 | 0.69±0.2 | 0.83±0.3 | 0.68±0.2 | 0.85±0.2 | 0.85±0.2 |
Table 2. Ca2+ binding constants for native and mutant CaMs in the presence and absence of BSCaMIQ.
The nomenclature used here is defined in the legend to Table 1. The “F” superscript identifies dissociation constants derived from data for Ca2+-dependent dissociation of mutant CaM-BSCaMIQ complexes. Otherwise, all dissociation constants were derived from direct Ca2+ binding measurements as described under “Materials and Methods.” Standard errors were derived from the diagonal elements in the variance-covariance matrices for fits to at least five pooled data sets. K1,2 and K3,4 are the geometric means of the Ca2+-binding constants for the C-ter or N-ter EF hand pair.
| μM | μM2 | |||||||
|---|---|---|---|---|---|---|---|---|
| K1 | K2 | K3 | K4 | K1,2 | K3,4 | K1K2 | K3K4 | |
| NC | 11.2±5.4 | 0.3±0.2 | 25.1±10.3 | 5.0±2.6 | 1.8±0.1 | 11.2±1.0 | 3.1±0.2 | 126±11.4 |
| NxC | 14.1±4.9 | 0.2±0.1 | – | – | 1.6±0.2 | – | 2.4±0.3 | – |
| NCx | – | – | 24.0±9.5 | 3.9±1.6 | – | 9.7±1.0 | – | 93.3±9.2 |
| NC-B | 10.7±3.8 | 2.4±0.8 | 7.8±3 | 1.6±0.7 | 5.1±0.7 | 3.5±0.6 | 25.7±3.5 | 12.3±1.9 |
| NxC-B | 22.4±11.3 | 1.1±0.6 | – | – | 4.9±0.5 | – | 24.6±2.7 | – |
| NxC-BF | 23.2±8.6 | 0.7±0.2 | – | – | 4.0±0.3 | – | 16.1±1.1 | – |
| NCx-BF | – | – | 122±68.0 | 9.4±4.0 | – | 33.8±4.0 | – | 1140±122.0 |
Results
Binding of native and mutant CaMs to BSCaMIQ in the presence and absence of Ca2+
The initial step in these investigations was to determine Kd values for the complexes between the BSCaMIQ fluorescent reporter containing the neuromodulin IQ domain and apoCaM or (Ca2+)4-CaM. Respective values of 2.3±0.1 and 2.5±0.1 μM were derived from the data presented in Fig. 2 (Table 1). Purified neuromodulin has previously been reported to bind apoCaM and (Ca2+)4-CaM with Kd values of 3.0 and 3.4 μM under similar experimental conditions (29, 30). As seen in Fig. 2, at a free Ca2+ concentration of 10 μM the apparent Kd value for the CaM-BSCaMIQ complex increases to 10.8±1.1 μM, suggesting that the transition between the apoCaM and (Ca2+)4-CaM complexes involves more weakly bound forms of CaM (Table 1).
Fig. 2. Binding of CaM to BSCaMIQ in the presence of 10 (◆) and 250 (□) μM free Ca2+, or 3 mM BAPTA (■).
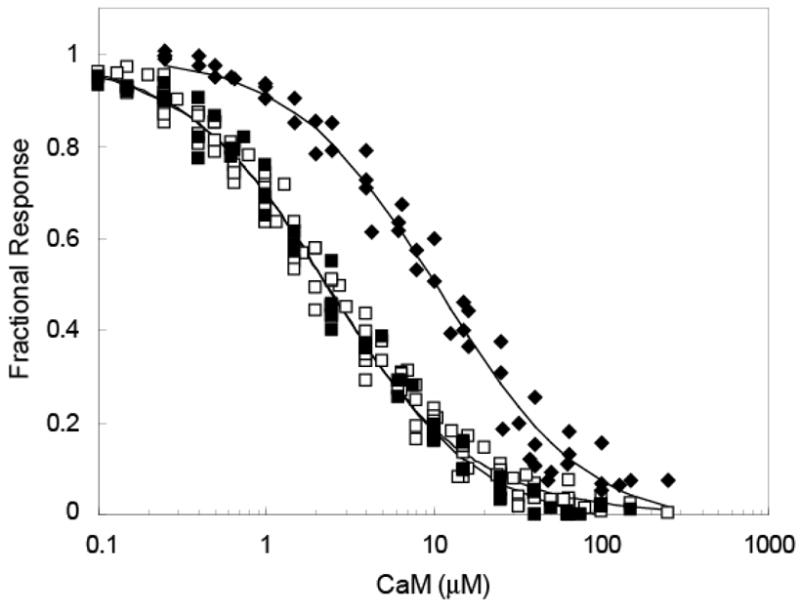
The fractional change in 525 nm fluorescence produced by the decrease in FRET associated with formation of the complex is defined as (Fmax−F)/(Fmax−Fmin), where F corresponds with the emission measured after each addition, and Fmax and Fmin correspond with the emissions of CaM-free and CaM-saturated BSCaMIQ. A 50 μM BSCaMIQ concentration was used for these experiments. The apparent Kd values determined from fits of these data to a simple one-site hyperbolic binding equation (not shown) are listed in Table 1.
To further investigate the basis for this apparent reduction in affinity at an intermediate free Ca2+ concentration we employed NxCCaM and NCxCaM, mutants of CaM in which Ca2+ binding to the N-ter or C-ter EF hand pair has been abolished (19). These mutants provide a convenient way to isolate the effects of Ca2+ binding to each EF hand pair. Our results indicate that the properties of these mutant proteins are consistent with the properties of native CaM. Nevertheless, it should be borne in mind that the mutant EF hands in these proteins are likely to adopt conformations that differ from the corresponding native Ca2+-free conformations (31). As seen in Fig 3A, in the absence of Ca2+ both mutants bind the BSCaMIQ reporter with a Kd value of ~2.3 μM, essentially identical to the value for native apoCaM (Table 1). In the presence of a saturating Ca2+ concentration the Kd values for the complexes with NxCCaM and NCxCaM are respectively increased to 14.4±1.3 and 36.7±3.9 μM (Fig. 3B, Table 1). Data for dissociation of the mutant CaM complexes as a function of the free Ca2+ concentration are presented in Fig. 4. Binding constants for the functional EF hand pair in each mutant complex can be estimated based on fits of these data to equation 2 (Table 2). The geometric means of the dissociation constants derived for the C-ter (K1,2) and N-ter (K3,4) EF hand pairs in bound NxCCaM and NCxCaM are 4.0±0.3 and 33.8±4.0 μM; the corresponding values for the free mutant proteins are 1.6±0.2 and 9.7±1.0 (Table 2). Thus, the mean Ca2+-binding affinities of the functional EF hand pairs in both mutant CaMs are reduced 3 to 4-fold when they are associated with BSCaMIQ.
Fig. 3. Binding of NxCCaM or NCxCaM to BSCaMIQ.
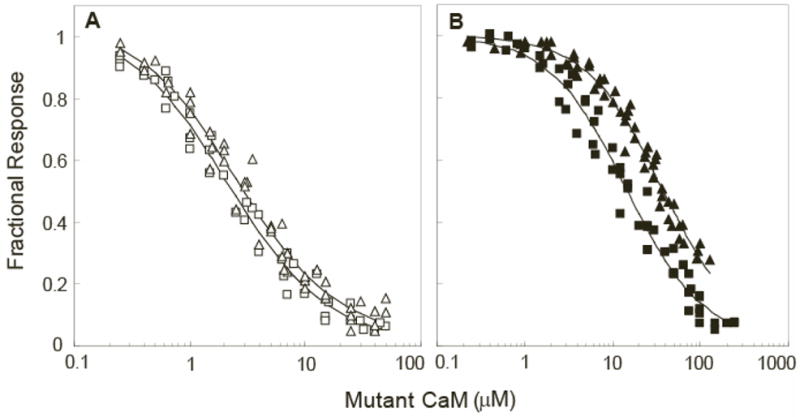
(A) Fractional changes in 525 nm fluorescence emission, defined as described in the legend to Fig. 2, associated with binding of NxCCaM (□) or NCxCaM (△) to 50 nM BSCaMIQ under nominally Ca2+ free conditions (3 mM BAPTA). (B) Fractional changes in 525 nm fluorescence emission associated with binding of NxCCaM (■) and NCxCaM (▲) to 150 nM BSCaMIQ at a free Ca2+ concentration of ~250 μM. Apparent Kd values derived from the data presented in panels A and B are listed in Table 1.
Fig. 4. Ca2+-dependent dissociation of the NxCCaM or NCxCaM complexes with BSCaMIQ.
Fractional changes in 525 nm fluorescence emission associated with formation of the complexes between 12.5 μM BSCaMIQ and 1 μM NxCCaM (◆) or NCxCaM (■). All free Ca2+ concentrations were verified using indo-5F or mag-indo-1. Fractional changes in fluorescence are defined using an Fmax value measured at the end of the experiment, which accounts for residual CaM binding in the presence of Ca2+. Otherwise fractional changes are defined as described in the legend to Fig. 2. Apparent Ca2+-binding constants derived from fits of these data to equation 2 are listed in Table 2.
Measurements of Ca2+ binding to native and mutant CaMs in the presence and absence of BSCaMIQ
Ca2+-binding data measured in the presence and absence of BSCaMIQ are presented in Figs 5A and 5B. Significant dissociation of CaM from the IQ domain is prevented during the course of these experiments by using at total concentration of CaM and BSCaMIQ that is ~10-fold or more above the Kd value for the lowest affinity form of the complex. Otherwise, one observes the Ca2+ binding characteristics of a mixture of free and bound CaM. Indeeed, this technique could not be applied to the complex between NCxCaM-BSCaMIQ because a total protein concentration of ~200 μM is required to prevent dissociation of this complex at elevated free Ca2+ concentrations, which was found to be above the usable limit due to solubility problems.
Fig. 5. Direct measurements of Ca2+ binding to native and mutant CaMs in the presence and absence of BSCaMIQ.
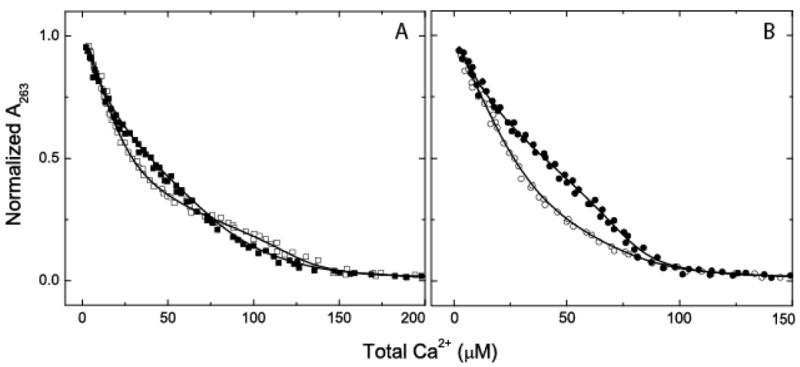
(A) 263 nm absorbance data for 40 μM dibromo-BAPTA measured in the presence of 20 μM native CaM (■) or 20 μM native CaM and 100 μM BSCaMIQ (□). (B) Absorbance data for 40 μM dibromo-BAPTA measured the presence of 20 μM NxCCaM (●) or 20 μM NxCCaM and 100 μM BSCaMIQ (○). For presentation purposes these data have been normalized to the absorbance of Ca2+-free dibromo-BAPTA determimed at the completion of each titration experiment. Pooled data from 3 separate Ca2+ binding experiments are presented for each set of conditions examined. The dissociation constants derived from fits of these and similar data to equation 3 or 4 are listed in Table 2 (28).
The Ca2+-binding constants we have derived for native CaM are essentially identical to the literature values (27), and the correspondence between these values and those determined for the NxCCaM and NCxCaM mutants suggests that the presence of a non-functional EF hand pair in one CaM lobe does not significantly perturb Ca2+ binding to the other (Table 2). There is also reasonable agreement between the mean dissociation constants for the C-ter EF hand pair (K1,2 ) derived for the NxCCaM-BSCaMIQ complex based on data for Ca2+-dependent dissociation (4.0±0.3) and from direct measurements of Ca2+ binding (4.9±0.5). Perhaps most importantly, our results demonstrate that in the native CaM-BSCaMIQ complex the affinity of the C-ter EF hand pair in CaM is decreased and the affinity of the N-ter EF hand pair is increased. These opposing effects result in similar mean dissociation constants of 5.1±0.7 and 3.5±0.6 μM for the two EF hand pairs. The first of these values is assumed to be K1,2, the mean dissociation constant for the C-ter EF hand pair, because it is closest to the value for the NxCCaM-BSCaMIQ complex (Table 2).
A general four-state mechanism for Ca2+-dependent switching in a CaM-target complex
A general steady-state mechanism for Ca2+-dependent switching in a CaM-IQ domain complex is presented in Fig. 6. It includes the four major Ca2+-liganded forms of CaM: apoCaM (NC), CaM with two Ca2+ ions bound to the C-ter (NC2) or N-ter (N2C) EF hand pair, and CaM with Ca2+ bound to both EF hand pairs (N2C2). In this model Ca2+ binding to the individual sites in an EF hand pair is treated as a single step governed by a K1K2 or K3K4 value.
Fig. 6. A general four-state scheme for Ca2+-dependent switching in a CaM-IQ domain complex.

B indicates the bound IQ domain protein; N and C indicate the N-ter and C-ter EF hand pairs in CaM, with subscripts denoting their Ca2+-liganded states; the absence of a subscript indicates a Ca2+-free EF hand pair.
Thermodynamic relationships
Thermodynamic linkage or energy coupling associated with formation of a CaM-target complex can be quantitively defined according to the relation:
| (5) |
where K1 and K2 are the Ca2+ binding constants for the C-ter EF hand pair and K3 and K4 are the constants for the N-ter pair. KNC and KN2C2 are the dissociation constants for the apoCaM (NC) and (Ca2+)4-CaM (N2C2) complexes with a target. The F and B subscripts identify the Ca2+ binding constants for free CaM and CaM bound to a target. These mathematical relationships formalize the basic thermodynamic requirement that a Ca2+-dependent change in the affinity of a CaM-target complex must be coupled to a corresponding change in the Ca2+-binding affinity of CaM when bound to the target. A negative ΔΔGC value is produced when Ca2+ binding increases the affinity of CaM for a target. This is termed favorable or “positive” energy coupling because it is linked to an increase in Ca2+-binding affinity. A positive ΔΔGC value is produced when Ca2+ binding decreases the affinity of CaM for a target. This type of energy coupling is termed unfavorable or “negative” because it is linked to a decrease in Ca2+-binding affinity. We can also define energy coupling in terms of the the individual EF hand pairs:
| (6) |
| (7) |
The C and N superscripts designate the ΔΔGC values for the C-ter and N-ter EF hand pairs. The proportionality constants α and β are coupling coefficients; values less than one correspond with positive coupling and values greater than one correspond with negative coupling. As seen in Fig. 6, Ca2+ can in principal bind first to either the N-ter or C-ter EF hand pair, so two sets of coupling coefficients and ΔΔG values must be considered. Unprimed symbols are used for the C-ter→N-ter pathway, and primed symbols for the alternative N-ter→C-ter pathway (see Fig. 6). Since the apoCaM and (Ca2+)4-CaM complexes with BSCaMIQ have essentially identical affinities, the complete transition from one type of complex to the other cannot produce significant net energy coupling (ΔΔGC ≈ 0). In terms of the individual EF hand pairs this means that and αβ ≈ α′β′ ≈ 1. Thus, in spite of an overall lack of energy coupling, energetically opposing effects of Ca2+-binding to the two EF hand pairs are not precluded, and this is in fact what we have observed.
As seen in Table 3, α has a value of ~ 8.5, indicating negative coupling, while β has a value of ~ 0.14, indicating positive coupling. The product of these values is ~1.2, satisfying the requirement that αβ ≈ 1. Thus, along the C-ter→N-ter pathway negatively coupled Ca2+ binding to the C-ter EF hand pair, which necessarily reduces the affinity of the CaM-BSCaMIQ complex, is followed by positively coupled binding to the N-ter EF hand, which in this case necessarily restores the affinity of the complex to its initial value. Based on the properties of the NCxCaM-BSCaMIQ complex, we have estimated a value of ~13.5 for β′, the coupling coefficient for the first step in the alternative N-ter→C-ter pathway (Table 3). This pathway thus appears to be strongly disfavored for at least three reasons: (1) The Ca2+-binding affinity of the N-ter EF hand pair in CaM is inherently ~6-fold lower than the affinity of the C-ter pair (Table 2), (2) The β′ value is ~2-fold larger than the α value, which widens this inherent difference by ~30%. (3) The affinity of the N2CCaM complex with BSCaMIQ is 2-fold lower than the affinity of the NC2CaM complex (Table 1). Thus, we can simplify our steady-state scheme by omitting the N-ter→C-ter pathway (Fig. 7). This pathway is likely to be of greater importance under transient conditions because the N-ter EF hand pair binds Ca2+ more rapidly than the C-ter pair (32).
Table 3. Coupling coefficients and ΔΔGC values for the CaM-BSCaMIQ complex.
The K3K4 value indicated by an “F” superscript was derived from data for Ca2+-dependent dissociation of the of NCx-B complex. All other K1K2 and K3K4 values were derived from direct measurements of Ca2+-binding. Dissociation constants for the various CaM-BSCaMIQ complexes are designated by subscripts identifying the bound CaM species. The products of the dissociation constants for the EF hand pairs are designated by subscripts identifying the bound or free CaM species. The nomenclature used for these subscripts is defined in the legends to Tables 1 and 2. Values given for ΔΔGC and coupling coefficients were calculated according to equations 6 and 7. As depicted in Fig. 6, unprimed values are those for the favored C-ter→N-ter order of Ca2+ binding, primed values are those for the alternative N-ter→C-ter order of binding.
| KNXC2/KNXC | KN2C2/KNXC2 | – | |||||
|---|---|---|---|---|---|---|---|
| α | 6.9±0.9 | 10.3±1.7 | 8.3±1.2 | β | 0.17±0.02 | – | 0.1±0.02 |
| 1.14±0.08 | 1.4±0.1 | 1.25±0.1 | −1.03±0.06 | – | −1.4±0.1 | ||
| KN2C2/KN2CX | – | – | KN2CX/KNCX | – | |||
| α′ | 0.07±0.01 | – | – | β′ | 14.7±2.4 | 12.2±1.8 | – |
| −1.59±0.07 | – | – | 1.58±0.1 | 1.48±0.1 | – |
The transition between the apoCaM and (Ca2+)4-CaM complexes with BSCaMIQ and full-length neuromodulin
The results we have presented thus far are consistent with a minimal biphasic mechanism (Fig. 7) in which the apparent affinity of the CaM-BSCaMIQ complex is decreased when Ca2+ is bound to the C-ter EF hand pair in CaM, and is restored to its initial value when Ca2+ is bound to the N-ter EF hand pair. This mechanism should produce a bell-shaped relationship between the apparent dissociation constant for the CaM-BSCaMIQ complex and the free Ca2+ concentration.
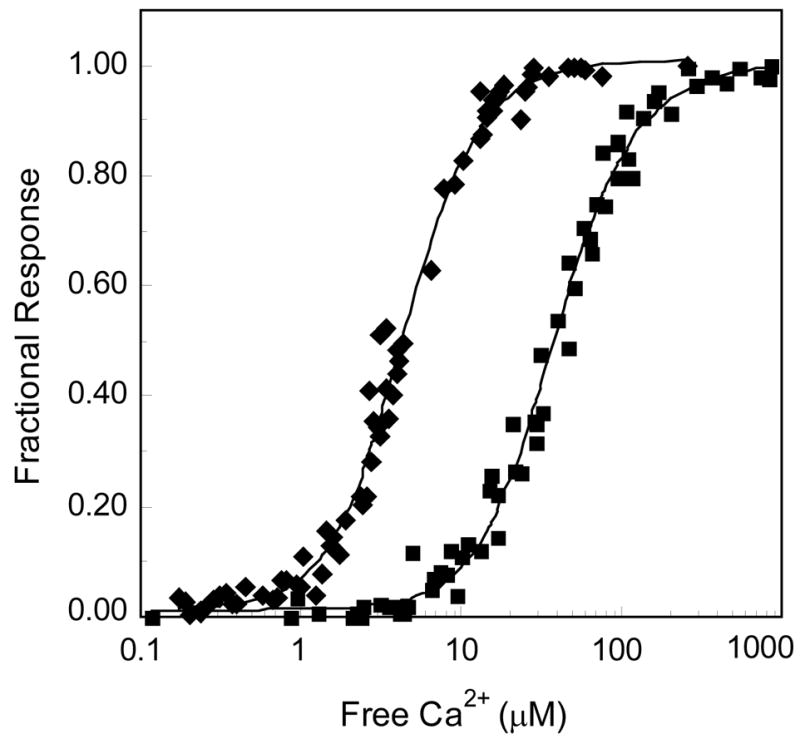
The fractional fluorescence response of 250 nM BSCaMIQ measured in the presence of 20 μM CaM is plotted versus the free Ca2+ concentration in Fig. 8A. The EC50(Ca2+) value for the transition between the apoCaM and (Ca2+)4-CaM forms of the CaM-BSCaMIQ complex is 2.5 μM, and there appears to be little dissociation of the complex at any free Ca2+ concentration. In contrast, the response of 5 μM BSCaMIQ measured in the presence of 1 μM CaM is bell-shaped, consistent with significant dissociation of the complex at intermediate free Ca2+ concentrations. The amount of dissociation appears to be maximal at a free Ca2+ concentration of ~6 μM, and the rising and falling phases of this relationship have EC50(Ca2+) values of ~2 and ~11 μM. The agreement between the observed BSCaMIQ fluorescence responses and the theoretical curves calculated based on our steady-state model is excellent under both sets of conditions (Fig. 8A, B).
To verify the applicability of our results to the complex between CaM and full-length neuromodulin, we employed fluorescently-labeled versions of CaM (ECFP-CaM) and full-length neuromodulin (EYFPC-neuromodulin). As illustrated in Fig. 1C, under 430 nm illumination formation of the complex between these proteins results in an increase in fluorescence emission at 525 nm due to FRET between the CFP and EYFPC moieties. The fractional fluorescence response of a mixture of 5 μM EYFPC-neuromodulin and 1 μM ECFP-CaM is plotted as a function of the free Ca2+ concentration in Fig. 8B. This relationship has a more marked bell shape than the accompanying BSCaMIQ response determined under essentially identical experimental conditions. This is because the complexes between labeled neuromodulin and labeled apoCaM or (Ca2+)4-CaM have the same fluorescence emission, while the complexes between the two forms of CaM and BSCaMIQ have different emissions (Table 1, Fig. 1B). These results clearly demonstrate that the apparent dissociation constants for the complexes between CaM and BSCaMIQ or full-length neuromodulin have similar biphasic dependencies on the free Ca2+ concentration.
Discussion
The relationship between the apparent dissociation constant for the complex between calmodulin (CaM) and the neuromodulin IQ domain and the free Ca2+ concentration consists of two phases. In the first phase Ca2+ bound to the C-ter EF hand pair in CaM increases the Kd for the complex from the Ca2+-free value of 2.3±0.1 μM to a value of 14.4±1.3 μM. In the second phase Ca2+ bound to the N-ter EF hand pair reduces the Kd for the complex to a value of 2.5±0.1 μM, reversing the effect of the first phase. This behavior demonstrates that CaM-IQ domain complexes can function as a biphasic Ca2+ switches through opposing effects of Ca2+ bound sequentially to the two EF hand pairs in CaM. In the case of neuromodulin these opposing effects serve to promote dissociation of CaM over a relatively narrow range of free Ca2+ concentrations.
Gaertner and coworkers (33) recently published a study of the Ca2+-dependencies of the CaM-neurogranin complex. This protein has essentially the same IQ domain as neuromodulin, and it is thought to have a similar CaM-buffering function (34). These investigators report that Ca2+ is released from the CaM-neurogranin complex at an accelerated rate compared with the rate for free CaM, consistent with negative coupling, although they were unable to verify this with steady-state Ca2+ binding measurements (33).
During a Ca2+ signal in an excitable cell such as a neuron CaM must be rapidly provided to targets like CaM kinase II that have high local concentrations (35, 36). It has been proposed that CaM-binding proteins such as neuromodulin provide the required local stores of CaM (37–40). However, if neuromodulin were simply to release CaM above a threshold free Ca2+ concentration, any not taken up by targets would be free to diffuse away until the free Ca2+ concentration fell below this threshold. Our results suggest that release of CaM from neuromodulin is promoted only within a relatively narrow 5 to 6-fold range in the free Ca2+ concentration. Our current hypothesis is that during a Ca2+ transient in a neuron the local free Ca2+ concentration passes rapidly through this range, producing a transient burst of free CaM that rebinds neuromodulin if not taken up by targets. Maintenance of a defined distribution of CaM through this and similar mechanisms may be of particular importance in neurons and other cells whose specific responses to different types of Ca2+ signals suggest a high degree of spatial discrimination (41–43).
The concentrations of the major species produced in a solution of CaM and neuromodulin as a function of the free Ca2+ concentration can be calculated based the minimal mechanism presented in Fig. 7 and the parameters listed in Tables 1 and 2. Given physiologically reasonable total neuromodulin and CaM concentrations of 10 μM, these calculations indicate that essentially all of the CaM remains Ca2+-free at Ca2+ concentrations below 0.1 μM, with ~60% of the protein bound to the IQ domain. As the free Ca2+ concentration is increased the total concentration of free CaM rises by ~40% with an EC50(Ca2+) of ~2 μM, peaks at a free Ca2+ concentration of ~5 μM, and declines back to the starting value with an EC50(Ca2+) of ~10 μM. To place the range of free Ca2+ concentrations over which this occurs in a physiological context, it appears that local free Ca2+ concentrations as high as 50–100 μM are produced in a variety of cell types, including neurons (44–49). There is of course also an inverse bell-shaped relationship between the concentration of the CaM-IQ domain protein complex and the free Ca2+ concentration. This highlights the possibility that the switching mechanism we have identified produces biphasic responses in the activities of some IQ domain proteins.
Footnotes
This work was supported by NIH Grant DK53863 to A.P.
Abbreviations: BSCaMIQ, fluorescent biosensor containing a CaM-binding sequence based on the IQ domain in neuromodulin; ECFP, cyan emitting variant of green fluorescent protein, EYFPC, yellow emitting variant of green fluorescent protein that has been modified to reduce the dependence of its fluorescence emission on pH over the physiological range; NxCCaM (NxC), mutant CaM with E31A and E67A substitutions; NCxCaM (NCx), mutant CaM with E104A and E140A substitutions; N2CCaM (N2C), CaM with Ca2+ bound to both N-ter EF hands; NC2CaM (NC2), CaM with Ca2+ bound to both C-ter EF hands; N2C2CaM (N2C2), CaM with Ca2+ bound to all four EF hands; N2CxCaM (N2Cx) and NxC2CaM (NxC2); mutant CaMs with Ca2+ bound to the remaining functional EF hands; K1,2, the geometric mean of K1 and K2; K3,4, the geometric mean of K3 and K4; BAPTA, 1,2-bis(2-aminophenoxy)ethane-N,N,N′,N′-tetraacetic acid; dibromo-BAPTA, 1,2-bis(2-amino-5,5′-dibromophenoxy)ethane-N,N,N′,N′-tetraacetic acid; FRET, fluorescence resonance energy transfer.
References
- 1.Yagi K, Yazawa M, Kakiuchi S, Ohshima M, Uenishi K. Identification of an activator protein for myosin light chain kinase as the Ca2+-dependent modulator protein. J Biol Chem. 1978;253:1338–1340. [PubMed] [Google Scholar]
- 2.Bredt DS, Snyder SH. Isolation of nitric oxide synthetase, a calmodulin-requiring enzyme. Proc Nat Acad Sci USA. 1990;87:682–685. doi: 10.1073/pnas.87.2.682. [DOI] [PMC free article] [PubMed] [Google Scholar]
- 3.Venema RC, Sayegh HS, Arnal JF, Harrison DG. Role of the enzyme calmodulin-binding domain in membrane association and phospholipid inhibition of endothelial nitric oxide synthase. J Biol Chem. 1995;270:14705–14711. doi: 10.1074/jbc.270.24.14705. [DOI] [PubMed] [Google Scholar]
- 4.Dabrowska R, Sherry JM, Aromatorio DK, Hartshorne DJ. Modulator protein as a component of the myosin light chain kinase from chicken gizzard. Biochemistry. 1978;17:253–258. doi: 10.1021/bi00595a010. [DOI] [PubMed] [Google Scholar]
- 5.Jurado LA, Chockalingam PS, Jarrett HW. Apocalmodulin. Physiol Rev. 1999;79:661–682. doi: 10.1152/physrev.1999.79.3.661. [DOI] [PubMed] [Google Scholar]
- 6.Bahler M, Rhoads A. Calmodulin signaling via the IQ motif. FEBS Lett. 2002;513:107–113. doi: 10.1016/s0014-5793(01)03239-2. [DOI] [PubMed] [Google Scholar]
- 7.Estep RP, Alexander KA, Storm DR. Regulation of free calmodulin levels in neurons by neuromodulin: relationship to neuronal growth and regeneration. Curr Top Cell Regul. 1990;31:161–180. doi: 10.1016/b978-0-12-152831-7.50006-8. [DOI] [PubMed] [Google Scholar]
- 8.Tran QK, Black DJ, Persechini A. Intracellular coupling via limiting calmodulin. J Biol Chem. 2003;278:24247–24250. doi: 10.1074/jbc.C300165200. [DOI] [PubMed] [Google Scholar]
- 9.Rakhilin SV, Olson PA, Nishi A, Starkova NN, Fienberg AA, Nairn AC, Surmeier DJ, Greengard P. A network of control mediated by regulator of calcium/calmodulin-dependent signaling. Science. 2004;306:698–701. doi: 10.1126/science.1099961. [DOI] [PubMed] [Google Scholar]
- 10.Isotani E, Zhi G, Lau KS, Huang J, Mizuno Y, Persechini A, Geguchadze R, Kamm KE, Stull JT. Real-time evaluation of myosin light chain kinase activation in smooth muscle tissues from a transgenic calmodulin-biosensor mouse. Proc Natl Acad Sci USA. 2004;101:6279–6284. doi: 10.1073/pnas.0308742101. [DOI] [PMC free article] [PubMed] [Google Scholar]
- 11.Tran QK, Black DJ, Persechini A. Dominant affectors in the calmodulin network shape the time courses of target responses in the cell. Cell Calcium. 2005;37:541–553. doi: 10.1016/j.ceca.2005.02.001. [DOI] [PubMed] [Google Scholar]
- 12.Gnegy ME. Calmodulin: effects of cell stimuli and drugs on cellular activation. Prog Drug Res. 1995;45:33–65. doi: 10.1007/978-3-0348-7164-8_2. [DOI] [PubMed] [Google Scholar]
- 13.Gerendasy DD, Herron SR, Watson JB, Sutcliffe JG. Mutational and biophysical studies suggest RC3/neurogranin regulates calmodulin availability. J Biol Chem. 1994;269:22420–22426. [PubMed] [Google Scholar]
- 14.Persechini A, Cronk B. The relationship between the free concentrations of Ca2+ and Ca2+-calmodulin in intact cells. J Biol Chem. 1999;274:6827–6830. doi: 10.1074/jbc.274.11.6827. [DOI] [PubMed] [Google Scholar]
- 15.Persechini A, Stemmer PM. Calmodulin is a limiting factor in the cell. Trends Cardiovasc Med. 2002;12:32–37. doi: 10.1016/s1050-1738(01)00144-x. [DOI] [PubMed] [Google Scholar]
- 16.Griesbeck O, Baird GS, Campbell RE, Zacharias DA, Tsien RY. Reducing the environmental sensitivity of yellow fluorescent protein - Mechanism and applications. J Biol Chem. 2001;276:29188–29194. doi: 10.1074/jbc.M102815200. [DOI] [PubMed] [Google Scholar]
- 17.Chapman ER, Au D, Alexander KA, Nicolson TA, Storm DR. Characterization of the calmodulin binding domain of neuromodulin. Functional significance of serine 41 and phenylalanine 42. J Biol Chem. 1991;266:207–213. [PubMed] [Google Scholar]
- 18.Persechini A. Monitoring the intracellular free Ca(2+)-calmodulin concentration with genetically-encoded fluorescent indicator proteins. Methods Mol Biol. 2002;173:365–382. doi: 10.1385/1-59259-184-1:365. [DOI] [PubMed] [Google Scholar]
- 19.Fruen BR, Black DJ, Bloomquist RA, Bardy JM, Johnson JD, Louis CF, Balog EM. Regulation of the RYR1 and RYR2 Ca2+ release channel isoforms by Ca2+-insensitive mutants of calmodulin. Biochemistry. 2003;42:2740–2747. doi: 10.1021/bi0267689. [DOI] [PubMed] [Google Scholar]
- 20.Tang W, Halling DB, Black DJ, Pate P, Zhang JZ, Pedersen S, Altschuld RA, Hamilton SL. Apocalmodulin and Ca2+ calmodulin-binding sites on the Ca(V)1.2 channel. Biophys J. 2003;85:1538–1547. doi: 10.1016/s0006-3495(03)74586-x. [DOI] [PMC free article] [PubMed] [Google Scholar]
- 21.Black DJ, Tran QK, Persechini A. Monitoring the total available calmodulin concentration in intact cells over the physiological range in free Ca2+ Cell Calcium. 2004;35:415–425. doi: 10.1016/j.ceca.2003.10.005. [DOI] [PubMed] [Google Scholar]
- 22.Haiech J, Klee CB, Demaille JG. Effects of cations on affinity of calmodulin for calcium: ordered binding of calcium ions allows the specific activation of calmodulin-stimulated enzymes. Biochemistry. 1981;20:3890–3897. doi: 10.1021/bi00516a035. [DOI] [PubMed] [Google Scholar]
- 23.Kilhoffer M-C, Kubina M, Travers F, Haiech J. Use of engineered proteins with internal tryptophan reporter groups and perturbation techniques to probe th emechanism of ligand-protein ineteractions: Investigation of the mechanism of calcium binding to calmodulin. Biochemistry. 1992;31:8098–8106. doi: 10.1021/bi00149a046. [DOI] [PubMed] [Google Scholar]
- 24.Evenas J, Malmendal A, Thulin E, Carlstrom G, Forsen S. Ca2+ Binding and Conformational Changes in a Calmodulin Domain. Biochemistry. 1998;37:13744–13754. doi: 10.1021/bi9806448. [DOI] [PubMed] [Google Scholar]
- 25.Malmendal A, Evenas J, Forsen S, Akke M. Structural dynamics in the C-terminal domain of calmodulin at low calcium levels. J Mol Biol. 1999;293:883–899. doi: 10.1006/jmbi.1999.3188. [DOI] [PubMed] [Google Scholar]
- 26.Linse S, Johansson C, Brodin P, Grundström T, Drakenberg T, Forsén S. Electrostatic contributions to the binding of Ca2+ in calbindin D9k. Biochemistry. 1991;30:154–162. doi: 10.1021/bi00215a023. [DOI] [PubMed] [Google Scholar]
- 27.Linse S, Helmersson A, Forsen S. Calcium binding to calmodulin and its globular domains. J Biol Chem. 1991;266:8050–8054. [PubMed] [Google Scholar]
- 28.Andre I, Linse S. Measurement of Ca2+-binding constants of proteins and presentation of the CaLigator software. Anal Biochem. 2002;305:195–205. doi: 10.1006/abio.2002.5661. [DOI] [PubMed] [Google Scholar]
- 29.Alexander K, Cimler B, Meier K, Storm D. Regulation of calmodulin binding to P-57. A neurospecific calmodulin binding protein. J Biol Chem. 1987;262:6108–6113. [PubMed] [Google Scholar]
- 30.Alexander K, Wakim B, Doyle G, Walsh K, Storm D. Identification and characterization of the calmodulin-binding domain of neuromodulin, a neurospecific calmodulin-binding protein. J Biol Chem. 1988;263:7544–7549. [PubMed] [Google Scholar]
- 31.Carlstrom G, Chazin WJ. Two-dimensional 1H nuclear magnetic resonance studies of the half-saturated (Ca2+)1 state of calbindin D9k. Further implications for the molecular basis of cooperative Ca2+ binding. J Mol Biol. 1993;231:415–430. doi: 10.1006/jmbi.1993.1291. [DOI] [PubMed] [Google Scholar]
- 32.Forsén S, Vogel HJ, Drakenberg T. Biophysical studies of calmodulin. In: Cheung WY, editor. Calcium and Cell Function. Academic Press; New York: 1986. pp. 113–157. [Google Scholar]
- 33.Gaertner TR, Putkey JA, Waxham MN. RC3/neurogranin and Ca2+/calmodulin-dependent protein kinase II produce opposing effects on the affinity of calmodulin for calcium. J Biol Chem. 2004;279:39374–39382. doi: 10.1074/jbc.M405352200. [DOI] [PubMed] [Google Scholar]
- 34.Baudier J, Deloulme JC, Van Dorsselaer A, Black D, Matthes HW. Purification and characterization of a brain-specific protein kinase C substrate, neurogranin (p17). Identification of a consensus amino acid sequence between neurogranin and neuromodulin (GAP43) that corresponds to the protein kinase C phosphorylation site and the calmodulin-binding domain. J Biol Chem. 1991;266:229–237. [PubMed] [Google Scholar]
- 35.Strack S, Choi S, Lovinger DM, Colbran RJ. Translocation of Autophosphorylated Calcium/Calmodulin-Dependent Protein Kinase II to the Postsynaptic Density. J Biol Chem. 1997;272:13467–13470. doi: 10.1074/jbc.272.21.13467. [DOI] [PubMed] [Google Scholar]
- 36.Colbran RJ, Soderling TR. Calcium/calmodulin-dependent protein kinase II. Curr Topics Cell Reg. 1990;31:181–221. doi: 10.1016/b978-0-12-152831-7.50007-x. [DOI] [PubMed] [Google Scholar]
- 37.Prichard L, Deloulme JC, Storm DR. Interactions between Neurogranin and Calmodulin in Vivo. J Biol Chem. 1999;274:7689–7694. doi: 10.1074/jbc.274.12.7689. [DOI] [PubMed] [Google Scholar]
- 38.Gamby C, Waage MC, Allen RG, Baizer L. Growth-associated protein-43 (GAP-43) facilitates peptide hormone secretion in mouse anterior pituitary AtT-20 cells. J Biol Chem. 1996;271:10023–10028. doi: 10.1074/jbc.271.17.10023. [DOI] [PubMed] [Google Scholar]
- 39.Gamby C, Waage MC, Allen RG, Baizer L. Analysis of the Role of Calmodulin Binding and Sequestration In Neuromodulin (GAP-43) Function. J Biol Chem. 1996;271:26698–26705. doi: 10.1074/jbc.271.43.26698. [DOI] [PubMed] [Google Scholar]
- 40.Gerendasy DD, Sutcliffe JG. RC3/NEUROGRANIN, A POSTSYNAPTIC CALPACITIN FOR SETTING THE RESPONSE THRESHOLD TO CALCIUM INFLUXES [Review] Mol Neurobiol. 1997;15:131–163. doi: 10.1007/BF02740632. [DOI] [PubMed] [Google Scholar]
- 41.Hernandez-Cruz A, Sala F, Adams PR. Subcellular calcium transients visualized by confocal microscopy in a voltage-clamped vertebrate neuron. Science. 1990;247:858–862. doi: 10.1126/science.2154851. [DOI] [PubMed] [Google Scholar]
- 42.Deisseroth K, Heist EK, Tsien RW. Translocation of Calmodulin to the Nucleus Supports CREB Phosphorylation In Hippocampal Neurons. Nature. 1998;392:198–202. doi: 10.1038/32448. [DOI] [PubMed] [Google Scholar]
- 43.Bito H, Deisseroth K, Tsien RW. CREB phosphorylation and dephosphorylation: a Ca2+- and stimulus duration-dependent switch for hippocampal gene expression. Cell. 1996;87:1203–1214. doi: 10.1016/s0092-8674(00)81816-4. [DOI] [PubMed] [Google Scholar]
- 44.Etter EF, Minta A, Poenie M, Fay FS. Near-membrane [Ca2+] transients resolved using the Ca2+ indicator FFP18. Proc Natl Acad Sci USA. 1996;93:5368–5373. doi: 10.1073/pnas.93.11.5368. [DOI] [PMC free article] [PubMed] [Google Scholar]
- 45.Marsault R, Murgia M, Pozzan T, Rizzuto R. Domains of high Ca2+ beneath the plasma membrane of living A7r5 cells. EMBO J. 1997;16:1575–1581. doi: 10.1093/emboj/16.7.1575. [DOI] [PMC free article] [PubMed] [Google Scholar]
- 46.Davies EV, Hallett MB. High micromolar Ca2+ beneath the plasma membrane in stimulated neutrophils. Biochem Biophys Res Commun. 1998;248:679–683. doi: 10.1006/bbrc.1998.9031. [DOI] [PubMed] [Google Scholar]
- 47.Klingauf J, Neher E. Modeling Buffered Ca2+ Diffusion Near the Membrane - Implications For Secretion In Neuroendocrine Cells. Biophys J. 1997;72:674–690. doi: 10.1016/s0006-3495(97)78704-6. [DOI] [PMC free article] [PubMed] [Google Scholar]
- 48.Simon SM, Llinas RR. Compartmentalization of the submembrane calcium activity during calcium influx and its significance in transmitter release. Biophys J. 1985;48:485–498. doi: 10.1016/S0006-3495(85)83804-2. [DOI] [PMC free article] [PubMed] [Google Scholar]
- 49.Llinas R, Moreno H. Local Ca2+ signaling in neurons. Cell Calcium. 1998;24:359–366. doi: 10.1016/s0143-4160(98)90059-8. [DOI] [PubMed] [Google Scholar]