

Abstract
Fluorescence detection and imaging are vital technologies in the life sciences and clinical diagnostics. The key to obtaining high-resolution images and sensitive detection is to use fluorescent molecules or particles that absorb and emit visible light with high efficiency. We have synthesized supramolecular complexes consisting of a branched DNA template and fluorogenic intercalating dyes. Since dyes can intercalate up to every other base pair, high densities of fluorophores are assembled, yet the DNA template keeps them far enough away from each other to prevent self-quenching. The efficiency with which these noncovalent assemblies absorb light is more than 10-fold greater than that of the individual dye molecules. Förster resonance energy transfer (FRET) from the intercalated dyes to covalently attached acceptor dyes is very efficient, allowing for wavelength shifting of the emission spectrum. Simple biotinylation of the DNA template allows for labeling of streptavidin-coated synthetic microspheres and mouse T-cells.
INTRODUCTION
Multichromophore arrays consist of collections of dye molecules arranged into precise supra- and/or macromolecular structures. Nature uses multichromophore arrays to improve the efficiency and wavelength sensitivity of photosynthetic systems1 while scientists and engineers are developing synthetic arrays for applications in photonics2, solar energy conversion3 and fluorescence imaging and detection4. These assemblies provide two significant advantages over individual chromophores. First, arrays absorb light much more efficiently than single molecules because in principle the extinction coefficient of the array is the sum of the extinction coefficients of all dyes in the array. Second, appropriate positioning of dyes within the array can promote highly efficient and vectorial energy transfer pathways.
An important design criterion for multichromophore arrays is to use structures that prevent self-quenching of electronically excited dyes by ground state dyes. This effect is seen in antibodies5,6 or oligonucleotides7 that are labeled with multiple fluorophores in an effort to improve their brightness. In such systems, the fluorescence quantum yield can decrease at high labeling densities, resulting in a deterioration of performance. While many fluorescent dyes exhibit self-quenching behavior, notable exceptions include aromatic hydrocarbon dyes that form fluorescent excimers or exciplexes8. For example, attachment of such fluorophores to adjacent positions on a DNA scaffold through either chemical9,10 or enzymatic11 synthesis results in fluorescent exciplexes. Moreover, libraries of DNA-conjugated polyfluors having a broad range of colors can be synthesized combinatorially9,10. Nevertheless, most dyes do not form fluorescent excimers or exciplexes, so strategies that allow assembly of multichromophore arrays where the dyes are not in contact with one another continue to be actively pursued.
Synthetic approaches to multichromophore arrays can employ covalent or noncovalent attachment of the dyes to the material that acts as a scaffold or matrix for the assembly. Covalent structures rely on scaffolds that fix the dyes’ positions with varying degrees of precision. Dendritic polymers12–14, nucleic acid nanostructures15, rigid hydrocarbons16 and even viral particles17 have been used in various arrays. A scaffold also plays a key role in natural systems. The light-harvesting antenna complexes that improve the efficiency and action spectrum of photosynthesis in plants and bacteria are natural multichromophore arrays18. The phycobiliproteins found in the light-harvesting complexes of plants, bacteria and algae feature dozens of linear tetrapyrrole dyes covalently attached to specific cysteine side chains in the protein. Although there is a high density of dyes within the protein structure, there is sufficient protein matrix separating individual dyes to avoid self-quenching. Phycobiliproteins can have extinction coefficients and fluorescence quantum yields in excess of 106 M−1cm−1 and 0.80, respectively18–20, although their large size can be problematic in some applications4.
Noncovalent approaches for assembling multichromophore arrays have typically involved materials that lack well-defined binding sites for the fluorescent dyes. For example, dyes have been embedded in organic polymer hosts to create fluorescent microspheres that are widely used in bioimaging and detection technology21. Alternatively, a variety of fluorescent dyes have been loaded into inorganic zeolite structures22 and silica nanoparticles23 with varying degrees of organization. Helical arrays of dyes have also been assembled using nucleic acid24,25 and polypeptide templates25. Supramolecular arrays can also be prepared in the absence of a template by relying on self-assembly of the molecular components26. While noncovalent assemblies generally lack the structural precision offered by covalent structures, the ease of synthesis is appealing.
Our goal was to reproduce the basic design evolved by nature for the phycobiliproteins, namely embedding many fluorescent dye molecules within a biopolymer matrix in a manner that inhibits self-quenching but facilitates energy migration and transfer reactions. In the systems reported here, the protein matrix is replaced by a branched double-helical DNA nanostructure and the dyes are bound noncovalently to the DNA by intercalation between base pairs. The resulting self-assembled multichromophore arrays exhibit high effective extinction coefficients and efficient energy transfer between co-intercalated dyes or from intercalated dyes to covalently attached acceptor fluorophores. These assemblies can be used as bright fluorescent labels for microscope imaging and flow cytometry experiments.
RESULTS
Design of Fluorescent DNA Nanostructures
In our design, DNA nanostructures serve as a template for organizing and concentrating multiple fluorescent dye molecules in a very small region of space while also preventing the dyes from quenching one another (Figure 1). This is accomplished by using intercalating dyes, which bind between adjacent base pairs in the DNA helix27. Steric constraints prevent multiple dyes from binding at the same intercalation site. In fact, according to the neighbor exclusion principle, saturation of the helix occurs when dyes are intercalated at every other base pair28, meaning adjacent dye molecules are separated by approximately 7Å. In addition to serving as a template for assembly of the fluorescent dye array, the DNA can be functionalized with groups that can serve as Förster energy acceptors as well as with reactive groups or recognition elements that allow attachment to other molecules or surfaces.
Figure 1.

Fluorescent “nanotags” based on linear and branched DNA templates and intercalating dyes. Self-quenching is avoided by confining the dyes within separate intercalation sites. “2WJ” = 2-way junction, “3WJ” = 3-way junction, etc.
Branched DNA nanostructures29 serve as the template for assembly of the intercalator arrays (Figure 1). The amount of light absorbed by a single DNA “nanotag” is determined solely by the number of intercalated dyes. This number is in turn determined by the number of base pairs in the DNA template. Thus, the extinction coefficient of a nanotag can be increased simply by using longer and/or more highly branched DNA templates (Figure 1)30. For most of the experiments described here, the template was a three-way junction (3WJ) consisting of three 10 base pair arms31, meaning up to 15 intercalating chromophores can be bound to each DNA nanostructure.
The intercalating dyes used for these experiments are based on the oxazole yellow chromophore (Chart 1)32. YO-PRO-1 and YOYO-1 are classified respectively as mono- and bisintercalators33 and YO-PRO-1 exhibits moderate affinity for double-stranded DNA34 (Kb = ca. 106 M−1). The binding constant for the bisintercalator has not been reported, but a similar dimeric version of the monointercalator ethidium exhibits ca. 1000-fold higher affinity35 than its monomeric counterpart, implying that YOYO-1 should bind with Kb of at least 109 M−1. The dyes also have large extinction coefficients (εmax), 52,000 M−1 cm−1 for YO-PRO-1 and 98,900 M−1 cm−1 for YOYO-1 in DNA, both at 491 nm. Organic dyes often form aggregates in which the extinction coefficient is lower than expected due to pi stacking, but the DNA templates will prevent this because each dye will bind to a distinct intercalation site. Moreover, the twist of the DNA helix will cause the transition moments of successive dyes to be misaligned. Therefore, minimal perturbation of the extinction coefficient is to be expected, and a DNA 3WJ with 15 YO-PRO-1 molecules should have an effective εmax ≈ 780,000 M−1 cm−1. Moreover, these dyes have little to no intrinsic fluorescence when free in solution but show strong fluorescence when bound to DNA (quantum yield φf = 0.44 for YO-PRO-1 and 0.52 for YOYO-1)36. Overall, the extinction coefficients and fluorescence quantum yields for the DNA nanotags will be comparable to widely used phycobiliproteins while having approximately one-tenth the molecular weight.
Chart 12.

Assembly and Characterization of DNA 3WJ Nanotags
The sequences of the three DNA 20mers used to assemble the 3WJ were taken from the literature and are given in the Materials and Methods section. UV melting curves of the 3WJ alone and in the presence of saturating amounts of YO-PRO-1 or YOYO-1 are shown in Figure 2. Heating of the DNA 3WJ causes denaturation at a characteristic melting temperature (Tm) due to disruption of the hydrogen bonds and the pi stacking interactions that hold the strands together. The 3WJ dissociates to the individual single strands at Tm = 45 °C. The Tm increases by 11 and 29 °C in the presence of the mono- and bis-intercalating dyes, respectively. The dye-enhanced stability of the 3WJ is due to the higher affinities of the dyes for duplex versus single-stranded DNA37. YOYO-1 provides greater stabilization than YO-PRO-1 because it has an additional intercalating group and two extra positive charges.
Figure 2.

UV melting curves recorded for a DNA 3WJ consisting of three ten base pair arms in the absence of intercalating dye as well as in the presence of mono- (YO-PRO-1) and bis- (YOYO-1) intercalating dyes.
The central idea of our design is that the DNA acts as a matrix for assembling the intercalating dyes into fluorescent arrays. A common feature of organic dyes is a tendency to aggregate in aqueous solution38, which usually leads to self-quenching of fluorescence. However, as shown in Figure 3, the fluorescence increases monotonically for both YO-PRO-1 and YOYO-1 as they are titrated into a solution containing the DNA 3WJ. (The ratio of dye/DNA is expressed in terms of intercalator concentrations, with YOYO-1 having two intercalating groups per molecule.) In both cases, the fluorescence saturates at approximately 0.5 intercalators/base pair, in accord with neighbor exclusion. The quenching observed for YOYO-1 at ratios in excess of 0.65 is likely the result of alternative, nonintercalative binding that can occur at relatively high loading39. Nevertheless, working at a ratio of 0.6 or lower yields highly fluorescent DNA-templated dye arrays.
Figure 3.
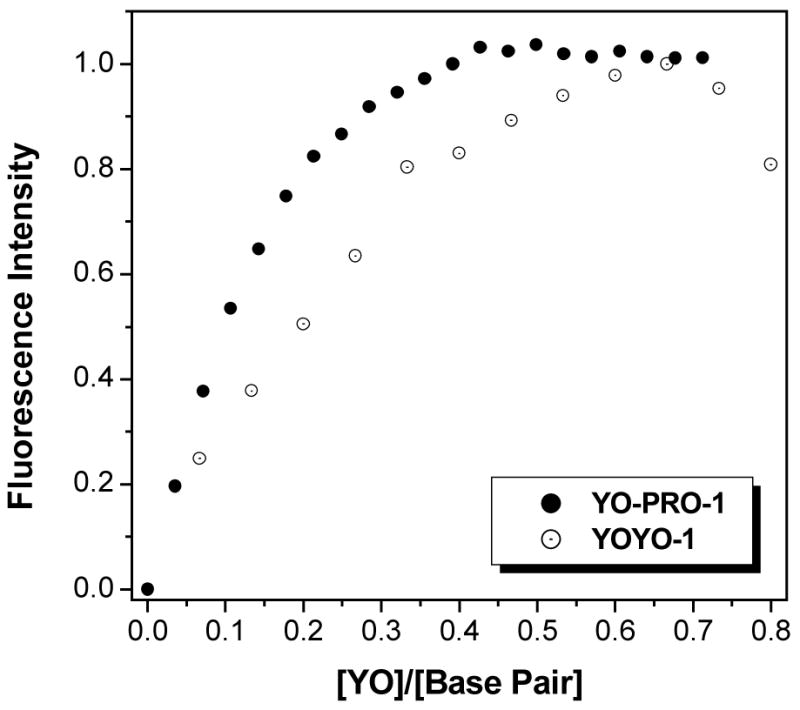
Dependence of maximum fluorescence intensity on ratio of intercalating YO groups per DNA base pair. [DNA] = 1 μM 3WJ = 30 μM base pairs for YO-PRO-1 and 0.1 μM 3WJ = 3.0 μM base pairs for YOYO-1. Spectra were recorded with excitation at 440 nm and data were normalized to the highest value at the emission wavelength (507 nm for YO-PRO-1, 510 nm for YOYO-1).
Use of FRET for Wavelength Shifting
In the phycobiliproteins, multiple chromophore types are present40, allowing one group of chromophores to absorb higher energy light and transfer the excitation energy to another group of chromophores by a dipole-dipole coupling mechanism known as Förster resonance energy transfer (FRET)41. The emission spectrum of a phycobiliprotein can also be shifted to longer wavelengths by covalent attachment of a dye molecule that acts as a FRET acceptor42. For example, phycoerythrin (PE) fluoresces at 575 nm but attachment of Texas Red (TR) leads to emission at 615 nm. This is useful for imaging applications because two distinct populations of objects (e.g. cells or microspheres) can be detected with the same excitation wavelength if one population is labeled with PE while the other is labeled with the PE-TR conjugate. We sought to incorporate this capability into the DNA nanotags.
Two strategies for utilizing FRET in the DNA nanotags are illustrated in Figure 4. First, energy donor and acceptor intercalator dyes can be co-intercalated into the same DNA 3WJ (Figure 4A). The wide variety of intercalating dyes with absorption and emission spectra spanning the visible region facilitates this strategy. In addition, the short distance separating a given acceptor dye from the closest donor (ca. 7 Å) in the co-intercalation format illustrated in Figure 4A should allow efficient FRET to occur for dyes that have moderate or even poor overlap between the donor emission and acceptor absorption spectra.
Figure 4.

Two strategies for using Forster resonance energy transfer (FRET) to shift emission wavelength away from excitation wavelength. (A) Co-intercalated donor (blue) and acceptor (red) dyes allow efficient FRET to occur, but some donors must be displaced to accommodate acceptors. (B) Non-intercalated acceptor dyes (red spheres) linked to DNA termini allow FRET without displacing donor dyes. Note that efficient energy migration among intercalated donor dyes prior to energy transfer to an acceptor dye can occur in both formats.
Figure 5A illustrates FRET in a 3WJ system in which YO-PRO-1 (donor) and TO-PRO-3 (acceptor) are co-intercalated. (Compared with YO-PRO-1, TO-PRO-3 has a sulfur instead of an oxygen and a trimethine instead of a monomethine bridge, Chart 1.) This pair has a calculated R0 (i.e. distance where FRET efficiency is 50%) of 40Å. Emission from YO-PRO-1 is quenched by 37% and replaced by TO-PRO-3 emission even when only 6.7 mol % of the acceptor (14:1) is co-intercalated. Further substitution of acceptor for donor results in greater quenching: 53% and 67% quenching for 13.3 mol % and 20 mol % TO-PRO-3, respectively. However, the sensitized emission from TO-PRO-3 at 660 nm does not increase as the donor quenching increases.
Figure 5.

FRET experiments in which donor (YO-PRO-1) and acceptor (TO-PRO-3) were cointercalated at varying ratios in a DNA 3WJ template. Legend lists YO-PRO-1 and TO-PRO-3 concentrations in micromolar (e.g. 14:1 = 14 μM YO-PRO-1 and 1 μM TO-PRO-3. (A) Experimental data acquired with excitation at 440 nm. [DNA 3WJ] = 1.0 μM. (B) Simulated data corresponding to FRET efficiencies determined based on quenching of donor from spectra in (A), as described in Materials and Methods section.
Based on the extent of donor quenching at each TO-PRO-3 concentration shown in Figure 5A, spectra were calculated for the expected FRET efficiency. These show the expected TO-PRO-3 emission increases at 660 nm correlating with quenching of the donor at 510 nm (Figure 5B). The lack of enhanced emission from the acceptor could be due to (a) quenching of YO-PRO-1 by a non-FRET pathway, such as electron transfer and/or (b) self-quenching of TO-PRO-3 at higher loadings. Direct excitation of TO-PRO-3 in the 14:1, 13:2 and 12:3 samples results in progressively lower fluorescence even though the TO-PRO-3 concentration increases (supporting information Figure S1), favoring explanation (b). Petty and coworkers reported that TO-PRO-3 can bind to DNA by both intercalative and nonintercalative modes43, so the lack of enhanced long wavelength emission in Figure 5A could be due to self-quenching of the intercalated acceptors by nonintercalated dyes.
While efficient FRET can occur within the DNA template, addition of each acceptor dye requires removal of one donor dye, thereby reducing the effective ε for the assembly. An alternative strategy, illustrated in Figure 4B, involves covalent attachment of energy acceptor dyes at the 3WJ termini. In addition to allowing full loading by the light-absorbing intercalator dye, this approach allows use of virtually any fluorescent acceptor dye, many of which have higher quantum yields than the unsymmetrical cyanines. For example, Figure 6 shows efficient FRET from intercalated YOYO-1 dyes to covalently attached Cy3 dyes. The FRET efficiency is ca. 95% (based on quenching of the donor) when only two Cy3 dyes are present. The high efficiency is due to the large critical transfer distance (R0 = 72.9 Å) for the YOYO-1/Cy3 pair and the fact that most intercalated dyes are within this distance of one of the terminal Cy3 dyes. The 3WJ acts as an antenna that efficiently harvests blue light, transfers that energy to terminal Cy3 acceptors with near unit quantum yield, which then emit orange light (λ = 570 nm).
Figure 6.

FRET in a 3WJ DNA nanotag loaded with YOYO-1 intercalator dyes and covalently attached Cy3 acceptor dyes. This experiment corresponds to the format illustrated in Figure 4B. Vertical arrows indicate quenching of YOYO-1 donors and sensitized emission of Cy3 acceptors. Samples were excited at 440 nm.
The concept can be extended further by replacing Cy3 with the longer wavelength absorbing “WellRed D2” as the energy acceptor. This dye absorbs maximally at 750 nm, meaning there is very little spectral overlap with the emission of YOYO-1 (Figure 7A). The calculated R0 value for this pair is only 20Å, yet a FRET efficiency of 94% is observed when three WellRed D2 acceptors are attached to the 3WJ termini (Figure 7B). The wavelength shift due to this FRET process is greater than 250 nm.
Figure 7.

FRET in a DNA 3WJ loaded with YOYO-1 intercalator (donor) dyes and 3 covalently attached terminal WellRed (acceptor) dyes. A: Overlap between donor emission and acceptor absorption spectra. (B) Efficient FRET is observed in spite of poor spectra overlap between donor and acceptor dyes. Samples were excited at 440 nm.
Fluorescent DNA nanotags for flow cytometry applications
Flow cytometry is an efficient method for sorting different populations of micron-sized objects such as cells or synthetic particles, leading to increased applications in biodetection assays44. Fluorescent labels on these objects allow detection and discrimination can be achieved based on intensity and/or wavelength. We performed a series of flow cytometry experiments to illustrate the utility of DNA nanotags for these applications.
As a proof of concept, streptavidin-coated polystyrene microspheres were combined with 3WJ assemblies functionalized with a single biotin group. A variety of experiments were performed comparing mono- and bisintercalating dyes, as well as using zero, one or two terminal Cy3 labels to study FRET. The commonly used 488nm argon ion laser line is particularly useful for exciting the labels because it is very close to the absorbance maximum for the intercalator dyes (491 nm) but gives very little direct excitation of the Cy3 acceptor dyes. Two different detectors were used to monitor the fluorescence: the “donor” channel collects fluorescence in the green, where the intercalating dyes emit, while the “acceptor” channel collects fluorescence in the orange region, where the Cy3 emits. However, the emission spectrum of the intercalator is sufficiently broad (Figures 6 and 7a) to allow detection in both channels.
Beads labeled with biotinylated 3WJ assemblies but no intercalating dyes exhibited very low mean fluorescence intensities (peak “A” in Figure 8), similar to control beads that lacked 3WJs. Addition of the monointercalator YO-PRO-1 failed to significantly increase the fluorescence intensity above background levels (data not shown). This is most likely due to the fact that the binding constant (Kb) of YO-PRO-1 for duplex DNA is ca. 106 M−134. Under the conditions of the flow cytometry experiment, submicromolar concentrations of the DNA 3WJ are present meaning YO-PRO-1 likely dissociated from the DNA. In contrast, the bisintercalator YOYO-1 should remain intercalated even at nanomolar DNA concentrations. This is verified by the data shown in Figure 8a, where addition of the bisintercalator increased the mean fluorescence intensity of beads displaying 3WJ nanotags by over 50-fold (compare peaks A and B; note that fluorescence intensity is shown on the x-axis of flow cytometry plots.)
Figure 8.

Flow cytometry results recorded for 4 different bead populations monitoring the donor channel (a) and acceptor channel (b). Beads labeled with 3WJs but no intercalating dye gave only background signal (A). Beads labeled with 3WJs and YOYO-1 (B) gave strong signals in both channels due to the broad emission spectrum of the intercalator. Addition of one (C) or two (D) Cy3 acceptor dyes led to a decrease in intensity in the donor channel due to efficient FRET (left). A corresponding increase in fluorescence was observed in the acceptor channel due to sensitized emission from the Cy3 labels (right).
Evidence of energy transfer was observed in both the donor and acceptor channels when Cy3 labels were attached to the 3WJ. Quenching of YOYO-1 fluorescence is revealed as a decreasing intensity in the donor channel (Figure 8a) with a corresponding increase in intensity in the acceptor channel (Figure 8b). The efficiency of energy transfer can be estimated from the decreased intensities observed in the donor channel and gives values of 62% and 71% for one and two Cy3 labels, respectively. The lower FRET efficiencies compared to the bulk solution results given above are likely due to having somewhat less bound YOYO-1 at the lower concentrations for flow cytometry. However, in contrast to the mono-intercalating dye, there is still sufficient intercalated YOYO-1 to permit the microspheres to be easily detected with 1–2 orders of magnitude brighter fluorescence relative to unlabeled beads. Using DNA junctions with more and/or longer arms should yield even brighter fluorescent labels.
The results shown in Figure 8 indicate that two different populations of beads should be readily distinguished based on whether or not the 3WJ is labeled with Cy3. Figure 9 illustrates an experiment in which two separate populations of beads were labeled with a YOYO-1-loaded 3WJ having zero or two Cy3 labels. The beads were mixed and then analyzed by flow cytometry using the donor channel to detect YOYO-1 emission. As shown in the figure, baseline resolution of the two bead populations is achieved.
Figure 9.
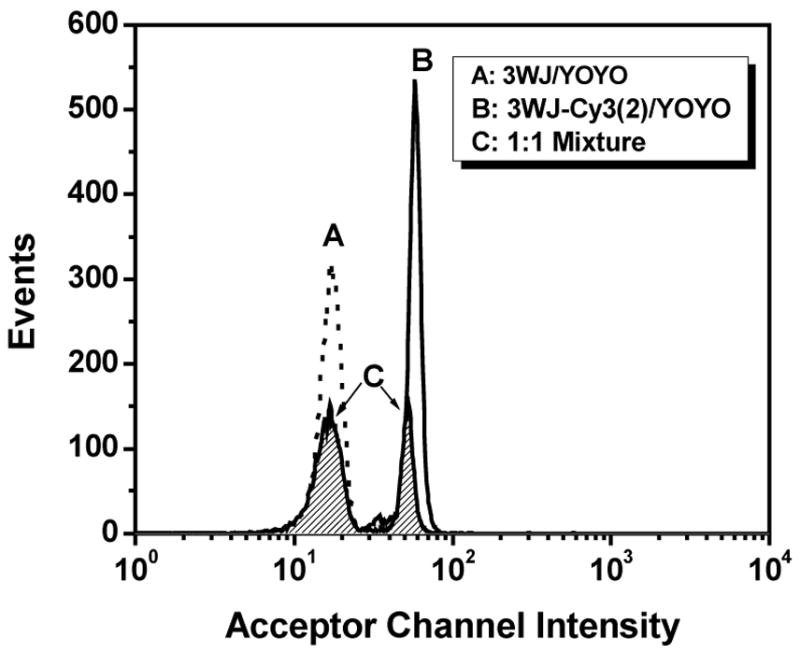
Flow cytometry analysis of bead mixture labeled with 3WJs, YOYO-1 and either 0 or 2 Cy3 acceptors. Peaks for separate populations are unfilled; peaks for bead mixture are filled. Samples were monitored in the Cy3 (acceptor) channel.
A key element in the design of our nanotags is the use of nanostructured DNA as a matrix for the assembly of fluorescent intercalator arrays. If more base pairs are added to the DNA template, then more dyes can be accommodated and the fluorescence should become brighter. To test this prediction, we designed four different DNA nanotags: a linear 20 base pair (bp) duplex, i.e. effectively a 2WJ, a 3WJ having three 10 bp arms, a 4WJ having four 10 bp arms, and a bis-3WJ consisting of four 10 bp arms and a central 20 bp segment linking the two hubs of the 3WJs. (These structures are shown schematically in Figure 1.) Biotinylated versions of these nanotags were mixed with streptavidin-coated polystyrene microspheres (beads) and were then analyzed by flow cytometry. Fluorescence intensities for microspheres labeled with the four different DNA nanotags clearly reveal the increase in intensity with the number of base pairs in the DNA template (Figure 10). Although the linear 2WJ template yields only modestly enhanced fluorescence relative to a 3WJ labeled with a single fluorescein group, the various branched templates yields intensities that match well with the expected values based on the maximum number of intercalated dyes: 15, 20 and 30 chromophores for the 3WJ, 4WJ and bis3WJ, respectively.
Figure 10.

Flow cytometry results illustrating increasing brightness with the number of base pairs in the nanotag. Samples included 50 nM DNA nanotag and YOYO-1 dye concentrations that equaled one dye per 4 DNA base pairs. Sample labeled 3WJ+Fluorescein did not have any YOYO-1, but instead had one covalently attached 5′-fluorescein label. Nanotag structural schematics are shown in Figure 1.
Labeling of mammalian cell membranes using DNA nanotags
Immunophenotyping involves staining of cells with antibodies or other specific ligands that are either directly or indirectly labeled with fluorescent dyes and is typically used for characterizing individual cells according to their expression of different surface molecules42. We wanted to compare our DNA nanotags to phycoerythrin (PE) reagents conventionally used in fluorescent immunophenotyping assays. Phycoerythyrin has an emission maximum in the same region as Cy3 and can therefore be compared to DNA nanotags that have terminal Cy3 acceptor molecules. The general staining procedure for both the 3WJ assembly and PE begins with a biotinylated anti-CD3 antibody which was used to stain all CD3+ mouse T-cells. The cells were then stained either with a streptavidin-PE conjugate or with free streptavidin followed by the biotinylated 3WJ nanotag loaded with YOYO-1 and labeled with 2 Cy3 acceptor dyes.
Confocal microscope images are shown in Figure 11 and illustrate that the 3WJ nanotags stain the mouse T-cells in a pattern similar to what is observed with a PE label, namely clusters of bright spots are observed around the periphery of the cells, as expected for CD3-specific labeling. However, the 3WJ image also includes a very bright object in the lower left quadrant. This object is most likely a dead cell since forward scatter versus side scatter dot plots obtained by flow cytometry indicate the presence of both dead and live cells in the preparation (data not shown). Live cells are impermeant to the tetracationic YOYO-1, but dead cells have compromised cell membranes, so dye molecules that dissociate from the 3WJ can enter these cells and readily stain endogenous nucleic acids. (In fact, unsymmetrical cyanine dyes are marketed for this very application.) In contrast, the PE is covalently attached to the streptavidin, making dissociation virtually impossible.
Figure 11.

Fluorescence microscope images of CD3+ mouse T cells labeled with biotinylated anti-CD3-antibody and phycoerythrin-streptavidin conjugate (a) or streptavidin + biotinylated 3WJ/YOYO-1/Cy3 DNA labels (b).
DISCUSSION
The DNA-templated intercalator arrays (i.e. nanotags) reported here offer (1) ease of assembly, (2) flexibility in choice of excitation and emission wavelengths and (3) very high brightness. Several noteworthy features of these nanotags are discussed here.
DNA Nanotag Assembly
DNA has found numerous applications in nanoscience and nanotechnology largely because it is a versatile construction material that can be designed and assembled into intricate, three-dimensional nanostructures45,46. Our strategy took advantage of the structural regularity of the DNA double helix to organize and orient multiple chromophores through self-assembly and noncovalent interactions. One of the primary advantages of our system is based on the simplicity of its design. Watson-Crick base pairing was used to assemble a well-defined DNA nanostructure, such as the three-way junction (3WJ) illustrated in Figure 1. Then, a fluorogenic intercalating dye was added to the solution and each DNA structure bound multiple dyes, thereby producing dye-DNA complexes with large light-harvesting capabilities and very high fluorescence intensities.
A number of DNA-based “polyfluors” have been reported. Kool and coworkers connect various fluorophores directly to the deoxyribose sugar, replacing the nucleobase9–11. Elaboration into phosphoramidites or triphosphates allows solid phase chemical synthesis or enzymatic synthesis to produce DNA oligomers having multiple attached fluorophores. (As noted above, the use of planar aromatic dyes allows formation of fluorescent excimers and exciplexes, avoiding the self-quenching effects normally observed when placing dyes in contact.) Alternatively, Luo and coworkers reported the synthesis of fluorescent DNA “nanobarcodes” in which individual DNA strands are labeled with single fluorophores15. Assembly into higher order structures such as 3WJs or higher-order dendritic structures yields fluorescent labels having several covalently attached dyes.
Our DNA nanotags offer unprecedented densities of fluorescent dyes and therefore the potential for extremely bright fluorescent labels. We rely on intercalation of dyes between DNA base pairs, a binding mode that was first proposed over 40 years ago by Lerman27. The geometrical constraints of the DNA backbone and the structural distortion imposed by creating an intercalation site strongly disfavors co-intercalation of a second dye at the same site or even at a directly adjacent site. This “neighbor-exclusion” effect results in saturation of the DNA helix at roughly one intercalator for every two base pairs28. This equates to 1.4 dye molecules per nm of DNA helix, a very high density and, as described above, the intervening base pairs prevent the dyes from quenching one another. Moreover, the brightness of the nanotag increases with the number of base pairs in the DNA template, as shown clearly in Figure 10, where several different DNA nanotags were used to label microspheres.
There is a symbiotic relationship between the DNA 3WJ and the intercalating dyes. The higher affinity of the dyes for double-stranded versus single-stranded DNA results in stabilization of the 3WJ against thermal denaturation (Figure 2). Meanwhile, intercalation into the DNA dramatically increases the fluorescence quantum yield of the dyes. This is because the constraints imposed by the stacked base pairs suppress the torsional motion about the methine bridge that is responsible for nonradiative decay of the dye excited state in fluid solution47. In practice, the use of such fluorogenic dyes is important for a noncovalent system, since unbound dyes do not contribute background fluorescence (unless they are able to bind to another component in the sample, as shown in Figure 11).
FRET in DNA Nanotags
Due to the close proximity between dyes in multichromophore arrays, efficient FRET processes are to be expected in the absence of self-quenching. In the case of biological arrays such as phycobiliproteins, the main purpose of the array is to broaden the action spectrum for photosynthetic reaction centers. Light is harvested by the array and then funneled by FRET to the reaction center where the excitation energy is used to promote electron transfer chemistry18. In our synthetic arrays, FRET is used to promote wavelength shifting, meaning the emission wavelength is well resolved from the excitation wavelength, to minimize interference of the excitation source with the detector.
We demonstrated efficient FRET in two different classes of nanotags (Figure 4). In the first case, donor and acceptor dyes are cointercalated into the same DNA 3WJ. The results shown in Figure 5 illustrate that the YO donor is readily quenched by TO-PRO-3 acceptor dyes. In this system, an excited YO donor can transfer energy directly to a TO acceptor, but it is also possible that the excitation energy can migrate among several YO dyes before ultimately reaching a lower energy TO acceptor. Time-resolved fluorescence experiments will help delineate the energy migration and transfer pathways in these multichromophore arrays.
The co-intercalated nanotags are analogous to dye-loaded polymer microspheres (or “beads”) that are widely used in flow cytometric diagnostics21. In the beads, dyes are suspended in polymers such as polystyrene and inclusion of two different dyes within the same bead leads to FRET. Fine tuning of the FRET efficiency is achieved by varying the ratio of the two dyes and the beads are extremely bright by virtue of having many dyes bound within. This concept was recently extended to dye mixtures embedded in silica nanoparticles23. The DNA nanotags reported here similarly concentrate fluorescent dyes while also providing discrete binding sites that preclude self-quenching. In addition, in both fluorescent beads and DNA nanotags, addition of acceptor dyes to enhance FRET requires removal of donor dyes, leading to a sacrifice in brightness.
The second FRET format shown in Figure 4 involves covalently attached acceptor dyes such as Cy3 and WellRed D2. This format does not require removal of any donor dyes so there is no loss of extinction coefficient at the excitation wavelength. The results shown in Figure 6 illustrate that addition of only two Cy3 dyes to a 3WJ having ca. 15 intercalated donors results in greater than 90% FRET. Similarly, three WellRed D2 acceptors also exhibit >90% FRET efficiency. This illustrates an important feature of DNA nanotags: donor and acceptor groups need not have large spectral overlap in order to observe efficient energy transfer. While FRET pairs are usually chosen based on their overlap, if the donor and acceptor can be positioned in close proximity, even poor overlap such as that between YOYO-1 and WellRed D2 (Ro = 20Å) can be tolerated. (Similarly, a donor having a low fluorescence quantum yield can still give efficient FRET if the distance separating the donor and acceptor is short.) The ability to localize donor and acceptor groups within 10Å of one another without allowing contact quenching to occur is a significant advantage of DNA nanotags.
The YOYO-1/WellRed D2 pair also illustrates the potential for wavelength shifting in DNA nanotags (Figure 7). The intercalators were excited at 440 nm and emission from WellRed D2 was observed at 783 nm. Due to the close distance between the donor and acceptor dyes that can be achieved in our arrays, even greater wavelength shifts should be possible for dyes that exhibit even modest spectral overlap.
Applications and Outlook
The results shown here demonstrate the utility of the fluorescent DNA nanotags as labels for both flow cytometry and confocal microscopy. The oxazole yellow dyes used to give the nanotags their fluorescence have fairly broad emission profiles. While this could complicate detection of differently labeled particles or cells using different channels, the data shown in Figure 9 illustrate that two distinct microsphere populations can be easily distinguished using a single excitation wavelength and a single detector channel. This discrimination occurs because the fluorescence intensity of the labels at a given wavelength is readily tuned by FRET.
There is great interest in studying chemical and biochemical reactions at the level of individual molecules. These experiments typically rely on fluorescent labels for tracking the reactions, so the high brightness of our DNA nanotags immediately suggests applications in single molecule experiments, although it will be important to evaluate the basic photophysical properties of these arrays (e.g. photobleaching, blinking). Perhaps even more importantly, higher affinity dye-DNA interactions will need to be utilized in order to prevent dissociation of the dyes under the extremely dilute conditions employed at the single molecule level. While the ease of assembly for these supramolecular arrays is appealing, it will be important to develop covalently attached analogues to fully exploit the potential of these fluorescent labels for applications that require low concentrations and/or where alternative binding sites for the dyes are present in the sample, as in the microscopy experiment shown in Figure 11. A recent report by Carell and coworkers48 illustrates an attractive route to this goal involving “click” cycloaddition chemistry49,50 to attach dye-azides to alkynyl-functionalized DNA. Finally, DNA nanostructures including tetrahedra51,52, octahedra53 and even more complex objects54 offer the possibility of assembling hundreds of fluorescent dye molecules within a single DNA template that is less than 10 nm in diameter. Such objects would be more than 10fold brighter than phycobiliproteins.
METHODS
Materials
DNA oligonucleotides were purchased from Integrated DNA Technologies, Inc. (www.idtdna.com) as lyophilized powders. Unmodified and 5′-biotinylated oligonucleotides were purified by gel-filtration chromatography while Cy3-, WellRed D2-, and Fluorescein-labeled oligonucleotides were purified by HPLC. Sequences for the DNA strands were:
| DNA 3WJ | |
| S1: | 5′-GGTGGCGAGAGCGACGATCC-3′ |
| S2: | 5′-GGATCGTCGCAGAGTTGACC-3′ |
| S3: | 5′-GGTCAACTCTTCTCGCCACC-3′ |
| DNA 2WJ | |
| S2: | 5′-GGATCGTCGCAGAGTTGACC-3′ |
| S2 Com: | 5′-GGTCAACTCTGCGACGATCC-3′ |
| DNA 4WJ | |
| S1: | 5′-GGTGGCGAGAGCGACGATCC-3′ |
| S2: | 5′-GGATCGTCGCAGAGTTGACC-3′ |
| S3 4WJ: | 5′-GGTCAACTCTCTATGCTACC-3′ |
| S4 4WJ: | 5′-GGTAGCATAGTCTCGCAACC-3′ |
| Bis-3WJ | |
| S1ex: | 5′-GGTGGCGAGAGCGACGATCCCAAAAGCTTTTG-3′ |
| S2: | 5′-GGATCGTCGCAGAGTTGACC-3′ |
| S3: | 5′-GGTCAACTCTTCTCGCCACC-3′ |
When needed, oligonucleotides were purchased with biotin conjugated to the 5′-end of S1, S2 com, and S1ex, Cy3 conjugated to the 5′-end of S2 and/or S3, and WellRed D2 conjugated to the 5′-end of S1, S2 and/or S3. Intercalating dyes YO-PRO-1® and YOYO-1® were purchased from Molecular Probes (Eugene, OR). R-Phycoerythrin-conjugated streptavidin was purchased from Jackson ImmunoResearch Laboratories, Inc. (West Grove, PA). Streptavidin polystyrene beads (2 μM) were purchased from Spherotech, Inc. (Libertyville, IL). Balb/c mice were purchased from Harlon (Indianapolis, IN).
Assembly and Characterization of Fluorescent DNA Nanostructures
Each DNA three-way junction (3WJ) nanostructure consisted of three mutually complementary oligonucleotides. DNA solutions were prepared in 10 mM aqueous sodium phosphate buffer (pH = 7.0) and stored at −4 °C. Concentrations were determined by UV absorbance at 260 nm using a Varian Cary 3 Bio UV-vis spectrophotometer. Equal concentrations of each strand were used and the DNA strands were annealed to 25 °C in 100 mM sodium chloride, 10 mM sodium phosphate, 0.1 mM EDTA at pH = 7.0. After hybridization, the 3WJ structures (30 bp) were stained with saturating concentrations of YO-PRO-1 (1 dye: 2 bp) or YOYO-1 (1 dye: 4bp). Dye concentrations were determined spectrophotometrically using the following molar absorptivities (in DNA) ε491 = 52,000 M−1cm−1 for YO-PRO-1 and ε491 = 98,900 M−1cm−1 for YOYO-1. Melting curves were measured by monitoring the absorbance at 260 nm while the temperature was increased at a rate of 1 °C/min.
Fluorescence Measurements
All fluorescence measurements were taken on a Photon Technologies International fluorimeter. For titrations, solutions of unmodified 3WJ nanostructures (1.0 μM for YO-PRO-1 titrations and 0.1 μM for YOYO-1 titrations) were prepared and titrated with 0.1 μM aliquots of YO-PRO-1 or YOYO-1. In bulk FRET experiments, where both the donor and the acceptor are intercalating dyes, all binding sites in the DNA 3WJ (1.0 μM nanostructure) were saturated. The different ratios of YO-PRO-1/TO-PRO-3 used were 15:0, 14:1, 13:2, and 12:3. After the addition of mono-intercalating dye to the DNA nanostructures, samples were incubated at room temperature for 10 minutes. For bulk FRET experiments with a covalently attached acceptor (0.1 μM nanostructure), a saturating concentration of YOYO-1 (1 dye: 4 bp) was added to Cy3 labeled, Cy5 labeled, Well Red D2 labeled and unlabeled 3WJ nanostructures (30 bp). After the addition of bis-intercalating dye to the DNA nanostructures, samples were incubated at room temperature for 30 minutes. All FRET samples were excited at 440 nm and the fluorescence intensity was measured from 450–750 nm. TO-PRO-3 was also directly excited at 610 nm in experiments where both the donor and acceptor were intercalating dyes. The bandpass for both the excitation and emission monochromators were 4 nm. The FRET efficiency (E) was measured based on the relative fluorescence intensity of the donor (YO-PRO-1/YOYO-1) in the presence (FDA) and absence (FD) of the acceptor:
Simulated FRET spectra for the co-intercalator experiments (Figure 5) were calculated as follows: Normalized fluorescence spectra for the individual intercalated dyes are available on the Invitrogen website (www.probes.com). The TO-PRO-3 reference spectrum was multiplied by a factor of 0.25 to account for the lower fluorescence quantum yield of TO-PRO-3 (φf = 0.11) relative to YO-PRO-1 (φf = 0.44). The percent quenching of the YO-PRO-1 emission in the presence of a certain fraction of TO-PRO-3 was used to scale the TO-PRO-3 emission spectrum. For example, for 20% quenching of YO-PRO-1, the TO-PRO-3 emission spectrum would be multiplied by a factor of 0.2. Meanwhile, the YO-PRO-1 reference spectrum was multiplied by a factor to account for the quenching due to the TO-PRO-3. In the example above, this factor would be 0.8 (due to 20% quenching). The resulting YO-PRO-1 and TO-PRO-3 spectra were then added and plotted as shown in Figure 5B.
Microbead Labeling with DNA Nanostructures
For all bead labeling experiments DNA nanostructures contained a single biotinylated strand (2WJ/S2-com, 3WJ/S1, 4WJ/S1, and bis-3WJ/S1-ex). Saturating amounts of YO-PRO-1 (1 dye: 2 bp) and YOYO-1 (1 dye: 4bp) were added to respective hybridized 2WJ (20 bp), 3WJ (30 bp), 4WJ (40bp), and bis-3WJ (60bp) samples, and incubated for 30 minutes at room temperature. 5.0 μg of streptavidin polystyrene beads (0.5 % w/v) were suspended in 50 μl PBS (calcium and magnesium free) containing 0.02% Triton X-100. Uniform labeling of streptavidin beads was achieved by incubating beads (106 beads/50 μl) with 2.5 picomoles of biotinylated 3WJ assemblies for 30 minutes. The beads were then washed 2× with 200 μl of FACS buffer (PBS containing 0.02% Triton X-100). Samples were resuspended in 0.7 ml of FACS buffer. Simultaneous detection of distinct bead populations was achieved by mixing two different samples of beads previously labeled with fluorescent 3WJ nanostructures Individual labeled beads were analyzed by fluorescence activated cell sorting (FACS) using a Coulter Epix Elite flow cytometer (Beckman-Coulter, Fullerton, CA) equipped with a 488 nm argon-ion laser. The following dichroic lenses (DL)\band pass (BP) filters were used: 500DL\488BP (PMT1), 550DL\525BP (PMT2), and 600DL\575BP (PMT3). For detection of YO-PRO-1, YOYO-1 and fluorescein (green emission) fluorescence was monitored in the PMT2 “donor” channel and for detection of Cy3 (orange emission) fluorescence was monitored in the PMT3 “acceptor” channel.
Labeling Mouse T-Cell Populations with a Biotinylated Antibody
Lymphocytes were isolated from the spleens of BALB/C mice. Cells were counted and were nonspecifically blocked with anti-mouse nonspecific Fc-blocker (CD32/CD16, Fc322.402, BD Biosciences). Samples of 106 cells in 50 μl of 1% calf serum PBS (calcium and magnesium free) were incubated for 30 minutes at 4 °C with 1 μg of biotinylated anti-mouse hamster CD3 (Caltag Laboratories, Burlingame, CA). Cells were washed 3X with 2.0 ml of PBS containing 1.0 % serum and were suspended in 50 μl of PBS.
Fluorescent Staining of T-Cells Labeled with Biotinylated CD3
Cells labeled with biotinylated anti-mouse hamster CD3 were labeled either with R-phycoerythrin-conjugated streptavidin or fluorescent biotinylated 3WJ nanostructures. 5.0 μg of R-phycoerythrin was used to stain biotinylated T-cells and cells were stained for 30 minutes. A two-step staining protocol was used to label cells with DNA nanostructures. First, 1.5 μg of streptavidin was added to cells and after 20 minutes, cells were again washed with PBS containing 1.0 % serum, and suspended in 50 μl of PBS. Separately, 3WJ DNA (30 bp) nanostructures were hybridized containing a single biotinylated strand and were incubated with saturating concentrations of YOYO-1 (1 dye: 4 base pairs). Cells were then stained for 30 minutes with 10 μM fluorescent DNA label. All fluorescently stained cell suspensions were washed, suspended in 1.0 ml of PBS and analyzed by FACS.
Fluorescence Imaging of Labeled T-Cells
A Solamer Spinning Confocal Microscope (Solamer Technology Group, Salt Lake City, UT) mounted with an Olympus IX50 (Olympus, Melville, NY) inverted microscope was used for fluorescence microscopy analysis. Samples were prepared according to the fluorescent staining protocol outlined above, except after the final wash, cells were suspended in 200 μl of PBS. Approximately 5 μl of concentrated cell suspension was added onto a glass slide and excited with a 488 nm argon-ion laser. Images were obtained at 60-fold magnification (UPlanFL Olympus objective) and cells were photographed with a photometric Cool Snap HQ Camera (Roper Scientific, Trenton, NJ).
Supplementary Material
Acknowledgments
We are grateful to the American Chemical Society (Petroleum Research Fund 44470-AC 4 to BAA), the National Science Foundation (CHE-1120408 to BAA), the National Institutes of Health (1U54RR022241-01 to ASW) and the Pennsylvania Department of Health for generous support of this research. We also thank Sue Andreko for expert technical assistance and Dr. Lauren Ernst for helpful discussions
References
- 1.Melkozernov AN, Barber J, Blankenship RE. Biochemistry. 2006;45:331–345. doi: 10.1021/bi051932o. [DOI] [PubMed] [Google Scholar]
- 2.Garcia-Parajo MF, Hernando J, Mosteiro GS, Hoogenboom JP, van Dijk EMHP, van Hulst NF. ChemPhysChem. 2005;6:819–827. doi: 10.1002/cphc.200400630. [DOI] [PubMed] [Google Scholar]
- 3.Gombert A, editor. Photonics for Solar Energy Systems. 2006. Proceedings of SPIE-The International Society for Optical Engineering. [Google Scholar]
- 4.Waggoner A. Curr Opin Chem Biol. 2006;10:62–66. doi: 10.1016/j.cbpa.2006.01.005. [DOI] [PubMed] [Google Scholar]
- 5.Anderson GP, Nerurkar NL. J Immunol Meth. 2002;271:17–24. doi: 10.1016/s0022-1759(02)00327-7. [DOI] [PubMed] [Google Scholar]
- 6.Gruber HJ, Hahn CD, Kada G, Riener CK, Harms GS, Ahrer W, Dax TG, Knaus HG. Bioconjugate Chem. 2000;11:696–704. doi: 10.1021/bc000015m. [DOI] [PubMed] [Google Scholar]
- 7.Randolph JB, Waggoner AS. Nucleic Acids Res. 1997;25:2923–2929. doi: 10.1093/nar/25.14.2923. [DOI] [PMC free article] [PubMed] [Google Scholar]
- 8.Turro NJ. Modern Molecular Photochemistry. Benjamin/Cummings; Menlo Park, CA: 1978. pp. 137–146. [Google Scholar]
- 9.Gao JM, Strassler C, Tahmassebi D, Kool ET. J Am Chem Soc. 2002;124:11590–11591. doi: 10.1021/ja027197a. [DOI] [PubMed] [Google Scholar]
- 10.Gao JM, Watanabe S, Kool ET. J Am Chem Soc. 2004;126:12748–12749. doi: 10.1021/ja046910o. [DOI] [PubMed] [Google Scholar]
- 11.Cho Y, Kool ET. ChemBioChem. 2006;7:669–672. doi: 10.1002/cbic.200500515. [DOI] [PubMed] [Google Scholar]
- 12.Nantalaksakul A, Reddy DR, Bardeen CJ, Thayumanavan S. Photosynth Res. 2006;87:133–150. doi: 10.1007/s11120-005-8387-3. [DOI] [PubMed] [Google Scholar]
- 13.De Schryver FC, Vosch T, Cotlet M, Van der Auweraer M, Muellen K, Hofkens J. Acc Chem Res. 2005;38:514–522. doi: 10.1021/ar040126r. [DOI] [PubMed] [Google Scholar]
- 14.Grimsdale AC, Vosch T, Lor M, Cotlet M, Habuchi S, Hofkens J, De Schryver FC, Muellen K. J Luminescence. 2005;111:239–253. [Google Scholar]
- 15.Li Y, Cu YTH, Luo D. Nature Biotechnol. 2005;23:885–889. doi: 10.1038/nbt1106. [DOI] [PMC free article] [PubMed] [Google Scholar]
- 16.Hindin E, Forties RA, Loewe RS, Ambroise A, Kirmaier C, Bocian DF, Lindsey JS, Holten D, Knox RS. J Phys Chem B. 2004;108:12821–12832. [Google Scholar]
- 17.Soto CM, Szuchmacher Blum A, Vora GJ, Lebedev N, Meador CE, Won AP, Chatterji A, Johnson JE, Ratna BR. J Am Chem Soc. 2006;128:5184–5189. doi: 10.1021/ja058574x. [DOI] [PubMed] [Google Scholar]
- 18.Glazer AN. Methods Enzymol. 1988;167:291–303. doi: 10.1016/0076-6879(88)67034-0. [DOI] [PubMed] [Google Scholar]
- 19.Glazer AN, Stryer L. Methods Enzymol. 1990;184:188–194. doi: 10.1016/0076-6879(90)84273-j. [DOI] [PubMed] [Google Scholar]
- 20.Chang W-r, Jiang T, Wan Z-l, Zhang J-p, Yang Z-x, Liang D-c. J Mol Biol. 1996;262:721–731. doi: 10.1006/jmbi.1996.0547. [DOI] [PubMed] [Google Scholar]
- 21.Kellar KL, Iannone MA. Experimental Hematol. 2002;30:1227–1237. doi: 10.1016/s0301-472x(02)00922-0. [DOI] [PubMed] [Google Scholar]
- 22.Calzaferri G, Huber S, Maas H, Minkowski C. Angew Chem Int Ed. 2003;42:3732–3758. doi: 10.1002/anie.200300570. [DOI] [PubMed] [Google Scholar]
- 23.Wang L, Tan WH. Nano Lett. 2006;6:84–88. doi: 10.1021/nl052105b. [DOI] [PMC free article] [PubMed] [Google Scholar]
- 24.Hannah KC, Armitage BA. Acc Chem Res. 2004;37:845–853. doi: 10.1021/ar030257c. [DOI] [PubMed] [Google Scholar]
- 25.Pasternack RF, Giannetto A, Pagano P, Gibbs EJ. J Am Chem Soc. 1991;113:7799–7800. [Google Scholar]
- 26.Ahrens MJ, Sinks LE, Rybtchinski B, Liu W, Jones BA, Giaimo JM, Gusev AV, Goshe AJ, Tiede DM, Wasielewski MR. J Am Chem Soc. 2004;126:8284–8294. doi: 10.1021/ja039820c. [DOI] [PubMed] [Google Scholar]
- 27.Lerman LS. J Mol Biol. 1961;3:18–30. doi: 10.1016/s0022-2836(61)80004-1. [DOI] [PubMed] [Google Scholar]
- 28.Crothers DM. Biopolymers. 1968;6:575. doi: 10.1002/bip.1968.360060411. [DOI] [PubMed] [Google Scholar]
- 29.Seeman NC, Kallenbach NR. Annu Rev Biophys Biomol Struct. 1994;23:53–86. doi: 10.1146/annurev.bb.23.060194.000413. [DOI] [PubMed] [Google Scholar]
- 30.Lilley DMJ. Quart Rev Biophys. 2000;33:109–159. doi: 10.1017/s0033583500003590. [DOI] [PubMed] [Google Scholar]
- 31.Stühmeier F, Welch JB, Murchie AIH, Lilley DMJ, Clegg RM. Biochemistry. 1997;36:13530–13538. doi: 10.1021/bi9702445. [DOI] [PubMed] [Google Scholar]
- 32.Rye HS, Yue S, Wemmer DE, Quesada MA, Haugland RP, Mathies RA, Glazer AN. Nucleic Acids Res. 1992;20:2803–2812. doi: 10.1093/nar/20.11.2803. [DOI] [PMC free article] [PubMed] [Google Scholar]
- 33.Johansen F, Jacobsen JP. J Biomol Struct Dynam. 1998;16:205–222. doi: 10.1080/07391102.1998.10508240. [DOI] [PubMed] [Google Scholar]
- 34.Petty JT, Bordelon JA, Robertson ME. J Phys Chem B. 2000;104:7221–7227. [Google Scholar]
- 35.Gaugain B, Barbet J, Capelle N, Roques BP, Lepecq JB, Lebret M. Biochemistry. 1978;17:5078–5088. doi: 10.1021/bi00617a002. [DOI] [PubMed] [Google Scholar]
- 36.Netzel TL, Nafisi K, Zhao M, Lenhard JR, Johnson I. J Phys Chem. 1995;99:17936–17947. [Google Scholar]
- 37.Bjorndal MT, Fygenson DK. Biopolymers. 2002;65:40–44. doi: 10.1002/bip.10220. [DOI] [PubMed] [Google Scholar]
- 38.West W, Pearce S. J Phys Chem. 1965;69:1894–1903. [Google Scholar]
- 39.Larsson A, Carlsson C, Jonsson M, Albinsson B. J Am Chem Soc. 1994;116:8459–8465. [Google Scholar]
- 40.Glazer AN. J Biol Chem. 1989;264:1–4. [PubMed] [Google Scholar]
- 41.Förster T, Konig E. Z Elektrochem. 1957;61:344–348. [Google Scholar]
- 42.Baumgarth N, Roederer M. J Immunol Meth. 2000;243:77–97. doi: 10.1016/s0022-1759(00)00229-5. [DOI] [PubMed] [Google Scholar]
- 43.Sovenyhazy KM, Bordelon JA, Petty JT. Nucleic Acids Res. 2003;31:2561–2569. doi: 10.1093/nar/gkg363. [DOI] [PMC free article] [PubMed] [Google Scholar]
- 44.Nolan JP, Sklar LA. Nature Biotechnol. 1998;16:633–638. doi: 10.1038/nbt0798-633. [DOI] [PubMed] [Google Scholar]
- 45.Seeman NC. Chem Biol. 2003;10:1151–1159. doi: 10.1016/j.chembiol.2003.12.002. [DOI] [PubMed] [Google Scholar]
- 46.Feldkamp U, Niemeyer CM. Angew Chem Int Ed. 2006;45:1856–1876. doi: 10.1002/anie.200502358. [DOI] [PubMed] [Google Scholar]
- 47.Silva GL, Ediz V, Armitage BA, Yaron D. Manuscript in preparation. [Google Scholar]
- 48.Gierlich J, Burley GA, Gramlich PME, Hammond DM, Carell T. Org Lett. 2006;8:3639–3642. doi: 10.1021/ol0610946. [DOI] [PubMed] [Google Scholar]
- 49.Huisgen R. Pure Appl Chem. 1989;61:613–628. [Google Scholar]
- 50.Lewis WG, Green LG, Grynszpan F, Radic Z, Carlier PR, Taylor P, Finn MG, Sharpless KB. Angew Chem Int Ed. 2002;41:1053–1057. doi: 10.1002/1521-3773(20020315)41:6<1053::aid-anie1053>3.0.co;2-4. [DOI] [PubMed] [Google Scholar]
- 51.Goodman RP, Berry RM, Turberfield AJ. Chem Commun. 2004:1372–1373. doi: 10.1039/b402293a. [DOI] [PubMed] [Google Scholar]
- 52.Goodman RP, Schaap IAT, Tardin CF, Erben CM, Berry RM, Schmidt CF, Turberfield AJ. Science. 2005;310:1661–1665. doi: 10.1126/science.1120367. [DOI] [PubMed] [Google Scholar]
- 53.Shih WM, Quispe JD, Joyce GF. Nature. 2004;427:618–621. doi: 10.1038/nature02307. [DOI] [PubMed] [Google Scholar]
- 54.Rothemund PWK. Nature. 2006;440:297–302. doi: 10.1038/nature04586. [DOI] [PubMed] [Google Scholar]
Associated Data
This section collects any data citations, data availability statements, or supplementary materials included in this article.