

Abstract
Microarray techniques using cDNA array and comparative genomic hybridization (CGH) have been developed for several discovery applications. They are frequently applied for the prediction and diagnosis of cancer in recent years. Many studies have shown that integrating genomic data from different sources may increase the reliability of gene expression analysis results in understanding cancer progression. Therefore, developing a good prognostic model dealing simultaneously with different types of dataset is important. The challenge with these types of data is high background noise. We describe an analytical two-stage framework with a multi-parallel data analysis method named wavelet-based generalized singular value decomposition and shaving method (WGSVD-shaving). This method is proposed for de-noising and dimension-reduction during early stage prognosis modeling. We also applied a supervised gene clustering technique with penalized logistic regression with Cox-model on an integrated data. We show the accuracy of the method using a simulated dataset with a case study on Hepatocelluar Carcinoma (HCC) cDNA and CGH data. The method shows improved results from GSVD-shaving and has application in the discovery of candidate genes associated with cancer.
Keywords: wavelets, generalized singular decomposition, Cox-model, HCC
Background
Hepatocellular carcinoma (HCC) is one of the major malignancies worldwide and more than half of the cases occur in China. The course of the disease (HCC) does not only vary depending on disease characteristics, but also the association between genotype-related differences. There is a poor prognosis for HCC. DNA micro-array technology has been proved to be an effective tool for prognosis and to identify genes that are potential therapeutic molecular targets [1-3]. The drawback of this type of data is the lack of potential power for detecting the regional impacts. Even if conventional CGH allows assessment of changes in chromosomal DNA sequence copy numbers across the genome and provide valuable information regarding genetic alternations in cancer [4-6].
The CGH cannot detect changes in small chromosomal regions. Researchers [7,8] have developed methods to identify the regions 1q, 4q, 8q, 16q, 20q and Y, which show common alterations in the given HCC samples. Many of the related HCC studies have similar results but with different approaches. However, the analysis of locating genes with highest variation in copy number with the strongest correlation across all samples together with clinical factors is rarely addressed. It is known that integrating data from different sources such as DNA, gene and protein level data may increase the reliability of the analysis results. A combination of copy number data with gene expression data can address cases with increased or decreased copy number in gene over or under expression [9,10].
Berger and colleagues applied a generalized singular valued decomposition with iterative shaving method (GSVD-shaving algorithm) to examine the patterns of expression which correlate to patterns of copy number on a global scale. They also examine the effects of including array CGH profiles in conjunction with expression profiles for variable selection in breast cancer data [11]. Attaining a suitable global scale is quite limited by the data type and there are noisy signals leaking into the transformed scaled data. This is true when the conventional CGH measurements have less size than gene expression measurements.
Here, we describe the construction of a two stage analytical framework. We propose a multi-parallel data analysis method, named wavelet-based generalized singular value decomposition and shaving method (WGSVD-shaving). Subsequently, we apply a supervised gene clustering with penalized logistic regression [13] with Cox-model method on the combination of clinical factors and reduced data from early stage to find prognostic indicators. We use the data from Berger and colleagues [11] for the analysis. We also conduct a case study on HCC with gene expression and CGH data. It should be noted that during the early stage we are describing a new data scale transformation method using wavelet coefficients from robust smoothing-cleaner wavelet approach [14]. In the HCC study, we apply the WGSVD-shaving for dimension reduction analysis of combined CGH and cDNA expression in 20 samples (including 9 short survivors and 11 long survivors).
A penalized logistic regression with Cox model is used on retained genes with clinical data from HCC samples. Throughout the analysis, the comparison of WGSVD-shaving and GSVD-shaving method is used. Using the WGSVD-shaving method with the proper choice of projection angle q in the GSVD, we are able to improve the results by using GSVD-shaving method. Moreover, the results have shown that the most frequent aberration of genomic material was gain of 1q and loss of 16q. The impacted genes include H20345, R71531 and H20256. The major detected region is C8p23.1 and the detected clinical factor is histology differentiation (hdif). We used a diagnostic test of Receiver Operating Characteristics (ROC) curve is applied to verify these results.
The objective of this study is to develop a method to improve the GSVD-shaving [11,12] for de-noising by analyzing both gene expression and copy number data in conjunction to detect useful genes (and regions). We use these genes (regions) with clinical factors in cancer to find significant prognostic indicators. We are particularly interested in examining genes from the common region for increasing the reliability of the analysis results.
Methodology
Conventional CGH data for HCC
Conventional CGH analysis on surgical HCC is performed on the 202 HCC samples. This is carried out according to our previously described method by Wong and colleagues [15]. There are 20 samples (patients) with 858 preprocessed CGH regions each used in the analysis.
cDNA gene expression profiling for HCC
Expression microarray study is done according to the protocol of UHN Microarray Centre [16]. We used the same sample set in CGH data but with 2050 preprocessed genes each. We describe here a framework of a prognostic analysis as shown in figure 1 for the HCC dataset. The detailed procedure of WGSVD-shaving algorithm is illustrated in supplementary material.
Figure 1.

The framework for prognosis analysis based on wavelet-based combined with the analysis of cDNA and CGH data.
Analysis
The analysis is divided into two stages as illustrated in Figure 1.
Wavelet-based GSVD-Shaving method
We integrated CGH copy number data with gene expression profiles for locating similar and dissimilar patterns of variation. We preprocessed and transformed the datasets by using wavelet transformation (RSCWT) since the similarity of data scales from two different types of data sets is essential. The detailed procedures are described in steps 1-6 (see supplementary materials). We applied (steps 7-13) the joint dimension reduction formulation to analyze gene expression and copy number alterations over experimental HCC datasets to extract results. We also adapted a simulation method from Berger and colleagues [11] to generate the random data sets and to provide a de-noising comparison between WGSVD-shaving and GSVD-shaving. The de-noising measurement is given in equation 1 (see supplementary material). In step 2, we applied the robust smoother-cleaner wavelet transform (RSCWT) [14], a fast wavelet decomposition which is robust towards outliers. Smoother-cleaner wavelets behave like the classical L2 wavelet transform for Gaussian signals. However, it prevents outliers and outliers patched from leaking into the wavelet coefficients at coarse levels. We used the “b-spline” bi-orthogonal wavelets sine. It is a class of filters which satisfy both requirements: short filters can be used for decomposition and longer filters for reconstruction. The smoother-cleaner step is based on a median filter. We selected the median filters of length L ≥ 2M + 1 for a low-pass wavelet filter of length M to avoid smearing for most types of wavelets and the usual value assigned to L is 5.
Multivariate analysis for prognostics indicators
We applied the penalized logistic regression method [13] to cluster the combined datasets (from early stage) and clinical factors. It is an algorithm that is based on penalized logistic regression analysis by using external information about response variables for clustering genes. The toolkit for the implementation of this method in R is Pelora. Then the multivariate Cox-model is applied to select those statistically significant prognostic indicators that are highly associated with HCC. The significant factors are finally verified by ROC curve analysis and with previously published data [7,8]. The ROC curve [17] by varying the parameter survival time is plotted for selected indicators and performance evaluation corresponding to WGSVD-shaving and GSVD-shaving is established.
Discussion
De-noising performance
We used wavelet-based GSVD-Shaving method and GSVD-Shaving method to analyze the datasets which is an ensemble of 1000 expression and copy number data derived in a simulation study. Each set has n = p = 1500 genes in 3 samples. We compared the two methods based on the percentage similarity (PS) index (see equation 1 in supplementary material). The simulated result also shows that analysis of 75 remaining genes in the dataset by adding random noise with repeating 1000 separate times for each variance level. Each set is in the ensemble of generated data and variance is incremented in the range 0 to 5. The results from Figure 2 show that the range of cDNA in PS is from 1 decreasing to nearly 0.21 based on GSVD-shaving method. Simultaneously, the range of cDNA in PS based on wavelet is from 1 decreasing to about 0.23. In array CGH, the GSVD-shaving method gives 1 to 0.26 and the wavelet-based approach the ranges from 1 down to 0.36. The de-noising is consistently improved as variance is changed and in average about 8% greater accuracy is achieved than GSVD-shaving for cDNA data and 12% for array CGH data. It is observed that de-noising using wavelet is high.
Figure 2.

Effect of random noise on gene lists. We compared the effects of additive noise on cDNA and CGH data using both GSVD-shaving and WGSVD-shaving algorithms.
HCC data analysis
We have CGH and cDNA expression data from 20 HCC cell lines comprising 11 short survivors and 9 long survivors at median survival time of 1.96 years. On the basis of the described framework, we used both WGSVD-Shaving and GSVD-Shaving to analyze the HCC datasets for dimensionality reduction. We then applied penalized logistic regression to analyze these reduced HCC genomic data in addition to clinical information. We are interested in three angular distances θmax, θ≈0 and θmin and these distances explain biological insights from gene expression data analysis. In some genes with over-regulated state in expression and are associated with deleted region from copy number in parallel we examine angular distances of θmax or θmin (in many cases they have similar results). Here we present the comparison between GSVD-shaving and wavelet GSVD shaving at θmax (see Figure 3a, Figure 3b for cDNA reduced data and Figure 4a, Figure 4b for CGH reduced data).
Figure 3.

The retained top 49 highest variant genes display their expressions across 20 HCC samples and the patterns show that the highest parallel contributions to the iterative projections after shaving out all other genes: (a) by GSVD-shaving approach, (b) by WGSVD-shaving approach.
Figure 4.

The retained top 49 highest variant genes display their copy number ratio (transformed) across 20 HCC samples and the patterns shows genes with highest variation in copy number and strongest correlation across all samples: (a) by GSVD-shaving approach, (b) by WGSVD-shaving approach.
We see that the overall patterns from WGSVD-shaving are more orderly distributed for classification in two interested states (under-expression/green and over-expression/red) on comparison to GSVD-shaving (Figure 3a and Figure 3b). The method described here show less noise. A similar observation is seen in Figure 4a and Figure 4b. The patterns in WGSVD-shaving are more ordered distributed for classification in two states (deletion/green and amplification/red) on comparison to GSVD-shaving. This indicates the analyzed data has less noise disturbances under the method. The ranked genes and regions selected are more ordered (classified) from any of three angular distances described in the method. We also applied penalized logistic regression to analyze both retained (reduced) genomic data supplemented with clinical information. The usual multivariate analysis of Cox-model is applied for the results obtained from penalized logistic regression and the results are shown in Figure 5.
Figure 5.
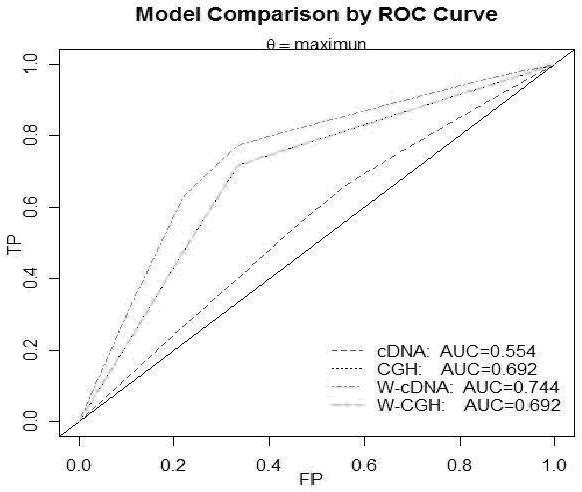
Comparison of results between GSVD and wavelet-scaled GSVD at θmax.
The results of GSVD-shaving approach present three genes from cDNA data with respect to high-low risk (dead/alive) of patients T74214 (p=0.0313), H43974 (p=0.0176), H08892 (p=0.0435) with no detection of clinical factors at qmax. The ROC curve analysis shows that the Area-Under-the-Curve (AUC) is 0.554. We obtained H20345 (p=0.0070) and histology differentiation (hdif) (p=0.0237) using WGSVD-Shaving. The observed AUC is 0.744 and is much higher than GSVD shaving method. Both methods with Multivariate Cox Model show no significant regions (at 95%CI) for CGH data in HCC. However, clinical factor “hdif” is detected by WGSVD-shaving. Other angular distances show similar results except for WGSVD-shaving which discovered the significant region C8p23.1. Thus the method described is useful for the discovery of candidate genes with associated regions in cancer.
Conclusion
We developed a useful framework for cancer prognosis and described an effective combination genomic data analysis method named WGSVD-shaving. The method was first tested by a simulation study and then compared with the GSVD-shaving method with 8% and 12% higher de-noising (in accuracy) for cDNA and CGH data, respectively. Results show that performance by WGSVD-shaving is higher than GSVD-shaving. The methods were evaluated using ROC curve analysis and data show that WGSVD-shaving has a higher probability to classify HCC with selected prognostic indicators than GSVD-shaving. The method can also pick genes and chromosome locations of biological significance with histological information.
Supplementary material
Acknowledgments
This study is funded by the Research Grant Council of Hong Kong #CUHK4469/03M.
References
- 1.Khan J, et al. Nat Med. 2001;7:673. doi: 10.1038/89044. [DOI] [PMC free article] [PubMed] [Google Scholar]
- 2.Pomeroy SL, et al. Nature. 2002;415:436. doi: 10.1038/415436a. [DOI] [PubMed] [Google Scholar]
- 3.Beer DG, et al. Nat Med. 2002;8:816. doi: 10.1038/nm733. [DOI] [PubMed] [Google Scholar]
- 4.Kallioniemi OP, et al. Gene Chromosomes Cancer. 1994;10:231. doi: 10.1002/gcc.2870100403. [DOI] [PubMed] [Google Scholar]
- 5.Knuutila S, et al. Am J Pathol. 1998;152:1107. [PMC free article] [PubMed] [Google Scholar]
- 6.James LA. J Pathol. 1999;187:385. doi: 10.1002/(SICI)1096-9896(199903)187:4<385::AID-PATH290>3.0.CO;2-5. [DOI] [PubMed] [Google Scholar]
- 7.Joseph J, Kyle A. Genome Biology. 2002;3:12. [Google Scholar]
- 8.Park SJ, et al. Cancer Genet Cytogenet. 2006;166:56. doi: 10.1016/j.cancergencyto.2005.08.022. [DOI] [PubMed] [Google Scholar]
- 9.Pollack JR, et al. Proc Nat Acad Sci USA. 2002;99:12963. doi: 10.1073/pnas.162471999. [DOI] [PMC free article] [PubMed] [Google Scholar]
- 10.Hautaniemi S, et al. J Franklin Inst. 2004;341:77. [Google Scholar]
- 11.Berger JA, et al. IEEE Trans Computl Bio Bioinform. 2006;3:2. [Google Scholar]
- 12. http://www.ece.ucsb.edu/pubs/ieee/
- 13.Marcel D, Peter B. Report No.: 115; SfS Research; Zuerich. 2003. [Google Scholar]
- 14.Bruce AG, et al. In SPIE Proceedings: Wavelet Applications; Orlando. 1994. p. 325. [Google Scholar]
- 15.Wang P, et al. Biostatistics. 2005;6:45. doi: 10.1093/biostatistics/kxh017. [DOI] [PubMed] [Google Scholar]
- 16. http://www.uhnres.utoronto.ca/services/microarray/protocols/
- 17.Heagerty PJ, Zheng Y. Genome Biology. 2003;61:92. [Google Scholar]
Associated Data
This section collects any data citations, data availability statements, or supplementary materials included in this article.