


Abstract
The RecG helicase of Escherichia coli unwinds both Holliday junction (HJ) and replication fork DNA substrates. Our lab previously identified and characterized peptides (WRWYCR and KWWCRW) that block the activity of RecG on these substrates. We determined that the peptides bind HJ DNA and prevent the binding of RecG. Herein, we present further evidence that the peptides are competitive inhibitors of RecG binding to its substrates. We have generated structural models of interactions between WRWYCR and a junction substrate. Using the fluorescent probe 2-aminopurine, we show that inhibitors interact with highest affinity with HJs (Kd = 14 nM) and ∼4- to 9-fold more weakly with replication fork substrates. The fluorescence assay results agree with the structural model, and predict the molecular basis for interactions between HJ-trapping peptides and branched DNA molecules. Specifically, aromatic amino acids in the peptides stack with bases at the center of the DNA substrates. These interactions are stabilized by hydrogen bonds to the DNA and by intrapeptide interactions. These peptides inhibit several proteins involved in DNA repair in addition to RecG, have been useful as tools to dissect recombination, and possess antibiotic activity. Greater understanding of the peptides’ mechanism of action will further increase their utility.
INTRODUCTION
Holliday junctions (HJ) and other branched DNA intermediates are processed during recombination and repair in all organisms by a variety of ubiquitous helicase enzymes (1–5). In general, helicases translocate along DNA in an ATP-dependent manner in order to separate DNA strands or to drive branch migration (6,7). Unlike hexameric helicases such as DnaB and RuvB (4,8), the monomeric RecG helicase of Escherichia coli catalyzes the interconversion of replication forks and HJ (9,10). This interconversion is likely accomplished by the simultaneous unwinding of the leading and lagging strands of a replication fork, which then reanneal with each other to form a HJ (11,12). RecG was first characterized for its role in promoting DNA recombination and repair in conjunction with the RuvABC resolvase complex (13,14). A role for RecG at the interface between replication, recombination and repair (15) is consistent with the finding that RecG binds to both HJ and replication forks in vitro with high affinity (10,16,17). RecG has very low activity on partially duplex ‘flayed’ DNA molecules, and binds to these substrates with as much as 100-fold lower affinity in comparison to the HJ (17).
We previously identified hexapeptides that inhibit several site-specific tyrosine recombination enzymes and lead to the accumulation of HJ intermediates both in vitro and in vivo (18–25; Boldt,J. and Segall,A., unpublished data). The enzymes inhibited include bacteriophage lambda Integrase (Int), the Cre recombinase of bacteriophage P1, the XerCD site-specific recombinase of E. coli, and the Flp recombinase of the 2 μm plasmid in Saccharomyces cerevisiae (20,24; Conway,A. and Rice,P., unpublished data). Peptides WRWYCR and KWWCRW are the most potent inhibitors and are capable of trapping virtually all HJ formed during Int-mediated recombination with a half-maximal inhibitory concentration (IC50) of 5–20 nM (19,20). The active form of each peptide is a dimer linked through a disulfide bridge (20,22), and thus we denote these peptides herein as (WRWYCR)2 and (KWWCRW)2. These peptides also inhibit unwinding of branched DNA substrates by RecG and HJ resolution by the RuvABC complex (22), and inhibit the D-loop unwinding activity of the human RAD54 protein (26). The basis for inhibition is shared substrate specificity for HJ DNA: peptides (WRWYCR)2 and (KWWCRW)2 bind specifically to free HJ DNA (22). The relatively weaker inhibitory peptide WKHYNY traps HJ during Int- and Cre-mediated recombination (IC50 0.2–20 μM, depending on the recombination pathway), and inhibits RecG activity weakly (IC50 20–100 μM) (18,20,21,23; Kepple,K. and Segall,A., unpublished data). While WKHYNY does not contain a cysteine and thus is unlikely to form a stable dimer in solution, crystal structure data indicate that this peptide also associates with Cre–HJ complexes as a dimer (23).
There are many intriguing parallels between peptide (WRWYCR)2 and the RecG helicase. The specificity of RecG for branched DNA molecules resides in a ‘wedge’ domain linked to the helicase domains (12,27). In the crystal structure of Thermotogota maritima RecG bound to a replication fork with only a lagging strand, Phe204 and Tyr208 contact the central bases of the fork in a manner that mimics base stacking (12). RecG activity decreases significantly in vivo and in vitro when the equivalent or near-equivalent residues in E. coli RecG were mutated (27), and aromatic residues are present in the analogous positions in RecG throughout the bacterial domain (Patel,N. et al., in preparation). The most potent peptide inhibitors all contain 2–3 aromatic residues, particularly Tyr and Trp (19,20) with a similar spacing to that between Phe204 and Tyr208 of T. maritima RecG. Like RecG, the peptides prefer square-planar HJ structures, and binding is strongly inhibited by Mg2+ or spermidine, that fold the junction arms into a ‘stacked-X’ conformation (17,22,28–30). Finally, when peptide and RecG are added together to HJ, we observed mostly peptide–HJ complexes, indicating that the peptide prevents RecG from binding to its substrate (22). Based upon these parallels and supporting data, we reasoned that the peptides may bind in the same manner as the RecG wedge domain to the central region of the junction and may compete with RecG for the HJ substrate by making similar contacts (22). Our hypothesis is supported by the observation that the RecG wedge domain by itself binds HJ with high affinity (Kd ≈ 1.6 nM), although additional contacts not found in the wedge domain are required for binding to replication forks (27).
Inhibition of RecG helicase activity on replication forks would be easily explained if the peptides bound to these structures and competed with the binding of the helicase. However, we were unable to detect binding of (WRWYCR)2 or (KWWCRW)2 to replication fork substrates using band shift assays (K. Kepple, Ph.D. Thesis, 2006). This could be either because the peptide–substrate complexes are too unstable during gel electrophoresis, or because the peptides interact with RecG in solution and prevent its interactions with the DNA substrate. In order to test whether complexes form between the peptide and replication forks we have used the fluorescent adenine analog 2-aminopurine (2-AP) in a fluorescence quenching assay.
We also investigated the similarity of binding interactions with DNA substrates between the peptides and RecG in order to get more insights into the interactions of the peptides with DNA substrates. One of the peptides we identified, WKHYNY, was co-crystallized in a complex of Cre–protein with HJ; however, the resolution of the WKHYNY peptide-dependent electron density was too low to determine any detailed interactions (23). We, now present further evidence that the peptides directly compete with RecG for HJ substrates. We have generated structural models for peptide interactions with branched DNA and used 2-AP to test binding and validate the models based on its previous wide utility as a probe for protein–DNA interactions, including protein–HJ binding interactions (23,31,32). We show that (WRWYCR)2 and (KWWCRW)2 quench the fluorescence of 2-AP bases placed in the center of both HJ and replication forks. The fluorescence data was used to calculate the affinity of (WRWYCR)2 to the various substrates. The relatively weak inhibitor WKHYNY does not bind protein-free junctions. The results of the modeling experiments between (WRWYCR)2 and a HJ are confirmed by the 2-AP fluorescence results and provide a nice framework for our hypothesis.
MATERIALS AND METHODS
Oligonucleotide synthesis and purification
Oligonucleotides 1–4 (Supplementary Table 1) were purchased from Integrated DNA Technologies (San Diego, CA, USA) and were purified on 12% polyacrylamide gels containing 7 M urea. Oligonucleotides 5–18 were synthesized on an Applied Biosystems Model 392 DNA/RNA synthesizer using standard phosphoramidite chemistry. The oligonucleotides were purified by reverse-phase HPLC (Gemini C18, 10 μm, 110 Å, 250 × 21.2 mm column, Phenomenex) using a 5–60% acetonitrile linear gradient in 100 mM TEAA buffer, pH 7.0. The trityl group was subsequently removed with 80% acetic acid and ethanol precipitated. The size and purity of oligonucleotides were assessed using polyacrylamide gel electrophoresis followed by ethidium bromide staining. Nucleotides and reagents for DNA synthesis were purchased from Glen Research (Sterling, VA, USA).
Peptides, proteins and assembly of branched DNA substrates
Peptides were synthesized with a C-terminal amide group and purified to >95% at Sigma-Genosys Inc. (St. Louis, MO, USA) and dissolved in 100% DMSO. Dr Peter McGlynn (University of Aberdeen, Scotland) generously provided the RecG protein. Synthetic oligonucleotides 1–4 (Supplementary Table 1) were used to make HJ DNA for RecG and peptide band shift assays. Oligonucleotide 1 was labeled at the 5′ end using [γ-32P]ATP and T4 polynucleotide kinase (New England Biolabs, Ipswich, MA, USA). Combinations of oligonucleotides 5–15 were used to assemble HJ substrates for 2-AP assays. Combinations of oligonucleotides 5, 6 and 11–18 were used to assemble replication fork substrates. The appropriate mixtures of oligonucleotides were combined in 40 μl 10 mM Tris–HCl (pH 7.8)/1 mM EDTA/0.2 M NaCl buffer and boiled for 5 min followed by slow cooling at room temperature. Substrates were purified by nondenaturing electrophoresis on a 12% polyacrylamide gel followed by band excision and elution into a small volume of TE/0.5 M NaCl. The DNA was quantified by spectrophotometry.
RecG/peptide band shift and dissociation assays
Gel mobility shift assays were performed in a 20 μl volume and contained 20 mM Tris–HCl (pH 8.0), 0.1 mM EDTA, 55 mM NaCl, 0.01% DMSO, 50 ng salmon sperm DNA, 0.1 mg/ml BSA, 6% (v/v) glycerol and 2 nM 32P-labeled HJ substrate. A final concentration of 0.025, 0.1 or 0.5 μM (WRWYCR)2 was added to the reaction buffer and this was immediately followed by addition of the indicated amounts of RecG. Reactions were incubated for 30 min on ice and loaded onto a 5% native polyacrylamide gel. Electrophoresis was performed in 0.5X TBE buffer at 4°C.
Dissociation experiments based on methods detailed previously (17,30) were performed with 0.015 μM (WRWYCR)2 in buffer that contained 20 mM Tris–HCl (pH 8.0), 55 mM NaCl, 0.1 mM EDTA, 0.01% DMSO, 0.1 mg/ml BSA, 6% (v/v) glycerol and 1 nM 32P-labeled HJ substrate. Reactions were assembled on ice in a total volume of 229 μl and allowed to equilibrate for 15 min. A 20 μl aliquot was then loaded onto a running 8% native polyacrylamide gel in 0.5X TBE at 4°C. Unlabeled HJ competitor (11 μl, giving a final concentration of 0.2 μM) was added to the remaining reaction mix and 20 μl aliquots were immediately loaded on the gel at increasing time points after stirring. A reaction containing competitor HJ DNA prior to addition of peptide was also included to verify that sufficient competitor was present to act as a sink for unbound peptide. This experiment was repeated using 0.02 μM RecG in order to compare the dissociation rates of peptide and RecG under these conditions.
For the dissociation experiment in Figure 2D, a 191 μl reaction mix was assembled containing 0.02 μM RecG and was preincubated for 15 min on ice. A 20 μl aliquot of this reaction mixture was then loaded on a running 8% native polyacrylamide gel in 0.5X TBE at 4°C. Unlabeled HJ competitor (9 μl, final concentration of 0.2 μM) was added to the reaction mix and 20 μl aliquots were loaded on the gel at increasing time points. A second reaction mixture was set up in parallel under identical conditions, except that (WRWYCR)2 was added (0.1 μM final concentration) in place of unlabeled HJ competitor. Reactions containing competitor HJ DNA or peptide prior to addition of RecG were also run on the gel as controls. All gels containing 32P-labeled DNA were dried and exposed to a Molecular Dynamics PhosphorImager screen, then visualized with ImageQuant software from Molecular Dynamics.
Figure 2.

Dissociation rate of the (WRWYCR)2/HJ complex. (A) 0.015 μM (WRWYCR)2 was added to reaction buffer with 1 nM 32P-labeled synthetic junction DNA and incubated for 15 min at 4°C. A final concentration of 0.2 μM unlabeled HJ DNA competitor was added and reactions (20 μl) were loaded at increasing time points on a running 8% native polyacrylamide gel at 4°C. DMSO is present in all reactions, in both panels A and B. The first three lanes are controls showing labeled HJ substrate alone, substrate preincubated with 0.2 μM unlabeled HJ competitor before addition of 0.015 μM (WRWYCR)2, and substrate preincubated with (WRWYCR)2 only. (B) Stability of RecG on HJ under identical conditions. The first three lanes are controls showing labeled HJ substrate alone, substrate preincubated with 0.2 μM unlabeled HJ competitor before addition of 0.02 μM RecG and substrate preincubated with RecG only. (C) Quantification of the data in part A and B. (D) Experiment demonstrating that (WRWYCR)2 can displace RecG from HJ DNA. In lanes 5–12, 0.02 μM RecG was preincubated with 1 nM labeled synthetic junction DNA and then a final concentration of 0.2 μM unlabeled HJ DNA competitor was added before loading the reactions on a running polyacrylamide gel as in part B. In parallel, 0.1 μM (WRWYCR)2 was used as the competitor for a second set of reactions instead of unlabeled HJ DNA (lanes 13–20). (WRWYCR)2 immediately abolishes the HJ/RecG complex but not the HJ/RecGx2 complex. Lanes 1–4 are controls showing HJ substrate alone, substrate preincubated with 0.2 μM unlabeled HJ DNA competitor before addition of 0.02 μM RecG, substrate preincubated with 0.1 μM (WRWYCR)2 before addition of 0.02 μM RecG, and substrate preincubated with 0.02 μM RecG only.
(WRWYCR)2/HJ modeling
The DNA from the crystal structure of the Cre/loxP HJ (33, PDB: 3CRX; NDB: PD0104) was used for modeling of the (WRWYCR)2/HJ complex. The loxP HJ is composed of four DNA strands denoted as C, D, E and F. The WRWYCR monomer (from Supplementary Figure 1C) was dimerized using the Biopolymer module of InsightII (Accelrys, San Diego, CA, USA) (34,35). The amino acid residues of the first monomer are labeled with an ‘a’, while those of the second monomer are labeled with a ‘b’ (e.g. W1a versus W1b). A series of manual rotation and minimization steps were carried out to obtain the trans-dimer structure of peptide WRWYCR (Figure 4A), which was expected to fit better with the 2-fold symmetry of the HJ substrate. The missing hydrogen atoms were added with the MSI/Biopolymer module (34,35). Energy minimization was performed using the InsightII/Discover module (34–38) using a consistent valance force field (CVFF, Biosym Inc.) (39–43). This trans-peptide dimer was manually docked into the loxP HJ. Several different configurations were tested by rotating the molecule in different orientations. Amino acids W1a, Y4a, W1b and W3b were manually rotated to achieve the best initial fit at the junction center (Figure 3B). This starting structure was further refined using three different energy minimization steps. In the first step, the preliminary model shown in Figure 3B was subjected to 1500 iterations of conjugate gradient energy minimization, while keeping all DNA chains and the amino acids W1a, W1b and W3b constrained. The resulting model is shown in Figure 3C. A second round of minimization (1000 iterations) was performed in order to optimize potential interactions between amino acids W1a, W1b, W3b and Y4a and the corresponding nucleotides with which they interact (D: A18, E: A18, C: A19, C: T18); the remaining structure was kept constrained, and the resulting model is shown in Figure 4D. This was followed by an additional 2000 iterations in which the HJ was constrained except for the C: T18 and C: A19 bases. Subsequently, amino acids W1a and W1b were constrained but the remaining peptide dimer structure was released for this minimization. The final (WRWYCR)2/HJ models are presented in space-filling views in Figure 3E, after a 90° clockwise rotation from 3D and F, after 180° rotation along the Y-axis from 3E.
Figure 4.

Peptide (WRWYCR)2 quenches the fluorescence of 2-AP at the branch point of a HJ substrate. The locations of each 2-AP in the HJ substrate are shown with boxes, and are named first by strand number and then by sequential location from the 5′ end of the oligonucleotide. The numbers pointing to each trace represent the ratio of (WRWYCR)2 concentration to substrate concentration. Peptide dimer concentrations used in each reaction were 0.05 μM (0.25:1 peptide to substrate ratio), 0.2 μM (1:1 peptide to substrate ratio), 0.8 μM (4:1 peptide to substrate ratio) and 1.6 μM (8:1 peptide to substrate ratio). Fcorr is the corrected fluorescence intensity (arbitrary units) obtained by subtracting the emission spectrum of a junction containing adenine at the position of 2-AP from the emission spectra of an equivalent reaction containing 2-AP.
Figure 3.

Modeling of (WRWYCR)2 on HJ DNA. Arginine residues (R2a, R6a, R2b and R6b) are green and the two cysteine residues are yellow. The four tryptophan residues are: W1a (magenta), W1b (pink), W3a (turquoise) and W3b (blue), and the two tyrosine residues are Y4a (purple) and Y4b (red). (A) The trans-conformation of (WRWYCR)2. (B) Preliminary structure of (WRWYCR)2 docked into the Cre-loxP HJ after manual rotation of amino acids W1a, Y4a, W1b and W3b. The resulting four potential stacking interactions between these amino acids and the four corners of the HJ (bases highlighted in orange) are shown. (C) Interactions between (WRWYCR)2 and HJ after the first minimization step. Two stacking interactions are observed, one between W1a and D: A18 and the other between W1b and E: A18. Two possible stacking interactions are found between W3b and C: A19 and between Y4a and C: T18. (D) Model after the second minimization step. The stacking interactions between W1a and D: A18 and between W1b and E: A18 remain, but the two possible stacking interactions observed in part C are lost. After minimization, C: A19 is rotated away from W3b and Y4a moved farther from C: T18. (E) Space-filling model of (WRWYCR)2 and HJ DNA after the final minimization step, rotated ∼45° clockwise with respect to panel D. The stacking interactions between W1a and D: A18 and between W1b and E: A18 are still present. The C: A19 base moved into its original position and a new stacking interaction between the W3b residue and F: T18 was created. (F) Space-filling model of (WRWYCR)2 and HJ DNA after the final minimization step, 180° rotation along the Y-axis with respect to panel E. This view highlights an additional aromatic interaction between W1b and Y4b near the junction center, leading to a continuous parallel stack between E: A18, W1b and Y4b.
Fluorescence measurements and data processing
Fluorescence spectra were recorded using a Photon Technology International Model QM-4/2005 scanning spectrofluorometer (Birmingham, NJ, USA). Samples (125 μl) contained 0.2 μM substrate, 20 mM Tris–HCl (pH 7.8), 100 mM NaCl, 1 mM EDTA, 0.032% DMSO and the specified concentration of peptide. Reactions were allowed to equilibrate for a least 10 min before transferring to a quartz cuvette. Emission spectra between 330 and 430 nm were recorded at 1 nm intervals using an excitation wavelength of 315 nm to minimize interference by tryptophan residues in the peptides. Monochromator bandpasses were fixed at 4 nm for excitation and 8 nm for emission in all measurements. Experiments were performed at 24°C and the spectra obtained were corrected for lamp fluctuations. When necessary, spectra were also corrected for instrumental variations caused by sample manipulation. DTT was present at 10 mM where applicable.
Peptide titrations (2 ml starting volume) contained 0.1 or 0.2 μM substrate as indicated, 20 mM Tris–HCl (pH 7.8), 25 mM NaCl, 1 mM EDTA and 1.6% DMSO. Peptide was diluted in the same buffer and added directly to the sample cuvette with reaction mixture at 24°C. Reactions were allowed to equilibrate for at least 3 min with gentle stirring with a magnetic stir bar before taking measurements. Corrections to fluorescence intensity resulting from small dilutions were made after measurements were complete. All emission spectra and fluorescence intensity measurements were corrected for background emission by subtracting spectra in which the 2-AP in each substrate was replaced with adenine. The fluorescence values at each peptide concentration between 365 and 375 nm were averaged. The data were processed and analyzed using FeliX32 Fluorescence Analysis Software (PTI). The corrected fluorescence spectra (Fcorr) were smoothed for clarity, fitted to the equation below and re-plotted using MATLAB (MATLAB2007a, fminsearch).
Model fitting of fluorescence data to obtain the Kd of peptide for each substrate
The model for the fits was based on expressing the fraction bound in terms of the total ligand and receptor present, and the equilibrium constant. The data was fit to the equation (44):
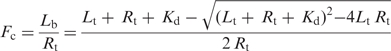 |
where Lb is the concentration of bound ligand; Lt, concentration of total ligand added to the solution; Rt, concentration of receptor molecules; and Kd, dissociation constant for the binding site.
The fitting was accomplished by adjusting the dissociation constant Kd to measured values of total peptide (ligand) added, Lt, and spectroscopically measured values of the fraction complexed, Fc, in a reaction with a prepared concentration of substrate (receptor) molecules, Rt. The values of Kd were adjusted to minimize the sum squared error between the measured Fc and the value predicted by this equation for the concentration of ligand added. The measurements were performed with unaged peptide solutions which had a monomer concentration approximately equal to the dimer concentration, as seen using HPLC. To correct for this, the Lt value in the equation was taken to be 0.67X of the total peptide monomers added.
Minimizing the sum squared error is equivalent to maximizing the fraction of explained variation, R2. Two (in some cases, three) independent dilution series were measured to obtain the data for each of the curves. The fits were made to the pooled measurements for all the dilution series for that substrate. The error bars shown were shifted for readability. Our methods for estimating the error bars and for finding confidence intervals for our Kd values are described in the Supplementary Data.
RESULTS
(WRWYCR)2 inhibits RecG by competing for the HJ substrate
Previously, gel mobility shift and footprinting assays demonstrated that RecG cannot bind to a HJ substrate when peptide is bound (22). We performed a competition experiment between RecG and peptide (WRWYCR)2 to expand this data (Figure 1). The formation of a peptide/HJ complex typically results in a very slight upward band shift (Figure 1A, compare lanes 1 and 2 or Figure 2A lane 2 versus 3). Peptide concentrations are given for the dimeric form throughout this work. Binding of 0.02 μM RecG to the HJ substrate is strongly inhibited by 0.025 μM peptide dimer, and binding is almost completely inhibited in the presence of 0.1 μM peptide. However, when more RecG is present in the reaction, more peptide is required to see inhibition: at 0.2 μM RecG there is only weak inhibition by 0.025 μM peptide (Figure 1A, lane 14). This data illustrates that inhibition of RecG by (WRWYCR)2 occurs by a competitive mechanism.
Figure 1.

(WRWYCR)2 competes with RecG for the HJ substrate. Peptide concentrations are represented in dimeric form since (WRWYCR)2 is active as a dimer (20,22). (A) The indicated amounts of RecG and (WRWYCR)2 (0.025, 0.1 and 0.5 μM) were added to reaction buffer with 2 nM 32P-labeled synthetic junction DNA. Reactions were incubated for 30 min at 4°C, and then run on a 5% native polyacrylamide gel at 4°C. The slow-migrating band consists of two RecG monomers bound to one HJ substrate (17). (B) Quantification of the data in part (A). The % DNA bound includes both one and two RecG monomers bound to the HJ substrate.
Peptide (WRWYCR)2 has a dissociation constant (Kd) of 12.5 nM by band shift assay, which is very similar to what we observe for RecG in our gel mobility shift assays in the presence of 50 ng nonspecific double-stranded DNA (dsDNA) (data not shown). We also examined the relative stabilities of peptide/HJ and RecG/HJ interactions by testing the dissociation of either peptide or RecG from HJ substrates (Figure 2). Peptide (WRWYCR)2 was preincubated in reactions containing 32P-labeled HJ DNA, then a 200X excess of unlabeled HJ competitor was added and reactions were loaded on a polyacrylamide gel at increasing time points (Figure 2A). For comparison, the experiment was repeated with RecG under the same conditions (Figure 2B). More than an hour is required for half of the peptide bound to the labeled junction to dissociate and bind to the excess unlabeled junction (Figure 2C). In contrast, half of the RecG bound to the labeled junction dissociates in 25 min. We conclude that (WRWYCR)2 dissociates from HJ about 2X slower than the RecG protein. Inhibition of RecG–DNA complexes by peptide dimer occurs whether the peptide is added to DNA 10 min before or after RecG (data not shown; Saha,R. and Segall,A. unpublished data).
Thus, when RecG dissociates from the junction, peptide (WRWYCR)2 can take its place in a ‘passive’ competition. Another possibility we considered is that the peptide may be able to actively displace RecG from the HJ. This might be possible if the peptide makes additional or more favorable interactions with the junction that are not made by RecG. As described above, RecG specifically interacts with DNA via stacking of two aromatic residues with branch point bases (12,27); however, other central HJ bases might be targeted by the peptide inhibitor. This was tested by determining the dissociation rate of RecG after challenge with both unlabeled HJ competitor and an inhibitory concentration of peptide (Figure 2D). Half of RecG bound to the labeled junction dissociated between 15 and 30 min after addition of excess unlabeled HJ competitor, as before (Figure 2D, lanes 5–12). In contrast, addition of peptide almost immediately (from the time required to add peptide, mix and the load gel) eliminated the RecG/HJ complex (Figure 2D, lanes 13–20). Both sets of reactions were done in parallel under identical conditions. Interestingly, the slow-migrating band previously identified as two RecG monomers bound to one HJ substrate (17) takes far longer to disappear, indicating that RecG interferes with peptide binding when more than one RecG monomer is bound. In the model of the RecG/HJ complex based on the RecG crystal structure, one RecG monomer occupies one ‘face’ of the HJ (12). The second RecG monomer could conceivably occupy the other side of the junction, blocking access of the peptide to the junction center. Alternatively, the second monomer could change the conformation of the junction in a way that makes it a worse target for the peptide.
Modeling of (WRWYCR)2 bound to a HJ
Based on the results described above indicating that the peptide is a competitive inhibitor of RecG, and based on the co-crystal structure of RecG interacting with a replication fork (12), we hypothesized that the peptide interacts with branched DNA substrates very similarly to RecG. We performed molecular modeling experiments in order to further test the plausibility of this proposal, and present a model of the interactions between the peptide and a replication fork in Supplementary Figure 1. To model peptide interactions with HJ DNA, we first dimerized the peptide and then docked it to a junction. For the DNA substrate, we used the HJ coordinates from the crystal structure of the Cre/loxP HJ complex (33), since (WRWYCR)2 inhibits Cre/lox recombination with an IC50 of 0.2 μM by trapping HJ intermediates in the reaction (20). The WRWYCR monomer was dimerized through a disulfide bridge and energy-minimized to yield a trans-dimer peptide, based on the hypothesis that a trans-dimer will dock better into the 2-fold symmetric structure of the HJ (Figure 3A). This dimer peptide was manually docked into the Cre/loxPHJ–peptide co-crystal. After manual rotation of amino acids W1a, Y4a, W1b and W3b (Figure 3B; a and b refer to the different peptide monomers within the dimer), the structure was run through three different energy minimization steps (Materials and methods section), whose respective results are shown in Figure 3C–F.
In the first minimization, the DNA chains and amino acids W1a, W1b and W3b were kept constrained. This minimization process was carried out to relax the peptide at the center of the junction (Figure 3C; in this panel, the junction has been rotated 180° around the vertical axis with respect to its orientation in Figure 3B). Four possible stacking interactions between W1a and D: A18, W1b and E: A18, W3b and C: A19 and between Y4a and C: T18 were observed at the four corners of the HJ. In the second round of minimization amino acids W1a, W1b, W3b and Y4a and their corresponding interacting DNA bases were allowed to move but all other atoms were constrained. While the second minimization did not affect the two stacking interactions on the left side of the junction (between W1a and D: A18 and between W1b and E: A18), the two possible stacking interactions between W3b and C: A19 at bottom right and between Y4a and C: T18 at the top right corner were lost (Figure 3D). This may have been due either to gain of stability from additional interactions or to steric clashes at these two corners of HJ. After moving away from the C: T18 base, the Y4a residue at the top right corner established a T-shaped aromatic–aromatic interaction (45) with the W1a residue. The base C: A19 moved far from W3b, possibly because of steric clashes either due to the short distance (<3 Å) between them or with other amino acids (R6b is <3 Å away from C: A19; Figure 3D).
The final (WRWYCR)2/HJ model after the third minimization is shown in space-filling form (front view in Figure 3E and rear view in 3F). The change in view from Figure 3D to 3E was obtained by a ∼90° clockwise rotation. The change in view from Figure 3E to 3F was obtained by 180° rotation along the Y-axis. In this minimization, all residues except the C: T18 and C: A19 nucleotides and the W1a and W1b amino acids were kept constrained. Most of the amino acids from the peptide were released here to gain better contacts between the peptide and DNA. After this third minimization, the W3b residue prefers stacking with the F: T18 base rather than with C: A19 in the bottom right corner (Figure 3D). We also found that the W3a may substitute for Y4a previously interacting with the C: T18 base at the top right corner. This competition between Y4a and W3a indicates that W3a is an important residue for making stacking interactions. This redundancy is also seen when testing single alanine-substituted peptides both in vitro in binding assays and in vivo for antimicrobial activity, where the alanine substitution at the third position (W3A) reduces the potency of the peptide more severely than the substitution at the fourth position (Y4A) (A. Flores, N. Patel and A. Segall, in preparation). The predicted aromatic interactions between W1a and D: A18, W1b and E: A18 and W3b and F: T18 are all clearly visible in Figure 3F. The intra-peptide T-shaped aromatic interactions (45,46) between Y4a and W1a, present even in the initial model, are retained after the third minimization (clearly visible in Figure 3D and E). In the final model we also found a π-cationic intrapeptide interaction (47,48) between the R6a and Y4a (purple) (Supplementary Figure 2). An additional 3-member stacking interaction between E: T18, W1b (pink) and Y4b (red) near the junction center is also evident. These intrapeptide π-stacking and π-cationic interactions may further stabilize binding between the peptide and the DNA, and reveal why the active peptide form is a dimer. We started with two aromatic stacking interactions between a peptide monomer and a replication fork (summarized in Table 1); the dimer had a third aromatic stacking interaction between the peptide and the DNA via the second peptide, and three new H-bonds, one between R6 and a backbone phosphate, and two between R2 and a backbone oxygen. By far, the peptide dimer had the most interactions with the HJ substrate: four peptide–DNA aromatic stacking interactions; one intrapeptide π-cationic interaction (R6a–Y4a); one T-shaped aromatic–aromatic interaction (Y4a and W1a) and four H-bonding interactions.
Table 1.
Summary of predicted interactions between peptide WRWYCR and DNA substrates
| Substrate | Peptide–DNA π–π stacking interactions | Intra-peptide π – cationic interactions | H-bonds (donor – recipient) |
|---|---|---|---|
| Fork + WRWYCR | W1 – X: G10 | ||
| Y4 – Y: G10 | |||
| Fork + (WRWYCR)2 | W1a1 – X: G10 | R6a (NH2) – Y: T8 (PO4) | |
| Y4a – Y: G10 | R2b (NH2) → X: G10 (O6) | ||
| W1b – X: A11 | R2b (NH) – X: G10 (O6) | ||
| HJ + (WRWYCR)2 | W1a – D: A18 | R2a (NH2) – C: A17 (PO4) | |
| W3a or Y4a2 – C: T18 | R6a – Y4a | R6b (NH2) – C: A19 (ribose O) | |
| W1b – E: A18 | R6b (OH) – C: A19 (PO4) | ||
| W3b – F: T18 | W1b (CO) – F: T19 (N3) |
1Each individual peptide monomer is denoted by a or b.
2W3a and Y4a both appeared able to interact with C: T18, depending on the minimization round. W3a was the amino acid which interacted in the final model, shown in Figure 4E and F.
Peptide (WRWYCR)2 interacts with the central bases of a HJ substrate
The fact that the peptide can displace RecG from a HJ substrate as well as the results from the molecular modeling experiments above suggest that (WRWYCR)2 might make more favorable interactions with the HJ than the wedge domain of RecG. In order to test our hypothesis and the stacking interactions predicted by our molecular models, we used a 2-AP fluorescence-based assay. The 2-AP fluorescent analog is structurally similar to adenine, allowing it to base pair with thymine with similar conformation and stability (49–51). The fluorescence of 2-AP is strongly quenched by stacking interactions with neighboring bases (52,53), generally having the lowest fluorescence intensity in dsDNA and the highest intensity in single-stranded DNA (ssDNA). Bases at the center of the HJ have a fluorescence intensity that is intermediate between ssDNA and dsDNA because only one side of each central base is stacked (31). 2-AP is readily incorporated into oligonucleotides using standard solid-phase DNA synthesis, and is particularly suited for studying protein–DNA interactions because its fluorescence excitation and emission maxima are well separated from those of tryptophan and tyrosine (50,54,55).
We synthesized and assembled HJ substrates containing 2-AP at several different positions in order to more closely examine potential contacts between the peptide and each arm of the junction. For comparison, we also placed 2-AP two or three bases away from the junction center. Partially unstacked central bases typically lead to a 1.5- to 2-fold increase in fluorescence when compared to bases that are completely stacked, while complete unstacking leads to an even greater increase in fluorescence (31). The sequence of the central region of the junction substrate used is shown in Figure 4. All junction arms are 25-bp long except for the right arm, which is 35 bp. The adenines individually replaced by 2-AP are boxed. The 2-AP residues are identified by strand number (1–4) and then by sequential location of the AP from the 5′ end of the strand.
Reactions containing each 2-AP HJ substrate were assembled with peptide (WRWYCR)2 and fluorescence emission spectra were recorded between 365 and 375 nm after excitation at a wavelength of 315 nm. The presence of (WRWYCR)2 quenches the fluorescence of HJ-4AP1 in a concentration-dependent manner. At a 1:4 ratio of peptide dimer to substrate (indicated as 0.25 on the graph; 0.05 μM peptide dimer) there is little if any change in fluorescence intensity. Maximal quenching of 1.8- to 1.9-fold is observed at 4- and 8-fold excess of peptide (0.8 and 1.6 μM peptide dimer, respectively, assuming 100% dimer in the preparation) over HJ substrate (Figure 4 and Table 2).
Table 2.
Summary of fluorescence data
| Peptide:substrate ratioa (peptide dimer) | 0.25 (0.05 μM) | 1 (0.2 μM) | 4 (0.8 μM) | 8 (1.6 μM) | |
|---|---|---|---|---|---|
| HJ | 4AP1*b | 1.0 | 1.2 | 1.9 | 1.8 |
| HJ | 4AP2* | 1.0 | 1.2 | 2.0 | 2.2 |
| HJ | 4AP3 | 1.0 | 1.2 | 1.5 | 1.7 |
| HJ | 4AP4 | 1.0 | 1.0 | 1.2 | 1.2 |
| HJ | 1AP1* | 1.1 | 1.2 | 1.6 | 1.8 |
| HJ | 3AP1* | 1.1 | 1.3 | 2.0 | 2.2 |
| HJ | 3AP2 | 0.9 | 1.0 | 1.1 | 1.1 |
| Fork | 4AP1* | 1.0 | 1.1 | 1.5 | 1.7 |
| Fork | 4AP2* | 1.0 | 1.0 | 1.4 | 2.0 |
| Fork | 4AP3 | 1.0 | 1.0 | 1.2 | 1.5 |
| Fork | 4AP4 | 1.0 | 1.0 | 1.0 | 1.2 |
| Fork | 1AP1* | 1.0 | 1.0 | 1.2 | 1.5 |
| Fork | 3AP2 | 0.9 | 1.0 | 1.1 | 1.2 |
| Lag | 4AP1* | 1.0 | 1.1 | 1.3 | 1.9 |
| Lag | 4AP2* | 1.0 | 1.1 | 1.3 | 1.6 |
| Lag | 4AP3 | 1.0 | 1.0 | 1.2 | 1.3 |
| Lag | 4AP4 | 1.0 | 1.0 | 1.1 | 1.0 |
| Lag | 1AP1* | 1.0 | 1.0 | 1.3 | 2.0 |
| Lag | 3AP2 | 1.0 | 1.0 | 1.1 | 1.1 |
| Lead | 4AP1* | 1.0 | 1.1 | 1.3 | 1.7 |
| Lead | 4AP2* | 1.0 | 1.1 | 1.2 | 1.5 |
| Lead | 4AP3 | 1.0 | 1.1 | 1.2 | 1.5 |
| Lead | 4AP4 | 1.1 | 1.0 | 1.1 | 1.2 |
| Lead | 1AP1* | 1.0 | 1.1 | 1.1 | 1.3 |
| Flayed | 4AP1* | 1.1 | 1.1 | 1.2 | 1.5 |
| Flayed | 4AP2* | 1.0 | 1.1 | 1.3 | 1.4 |
| Flayed | 4AP3 | 1.0 | 1.1 | 1.2 | 1.3 |
| Flayed | 4AP4 | 1.0 | 1.0 | 1.1 | 1.2 |
| Flayed | 1AP1* | 1.1 | 1.1 | 1.1 | 1.3 |
Values represent the fold decrease in 2-AP fluorescence at 370 nm in the presence of the indicated amounts of peptide relative to the absence of peptide.
aThe ratio of peptide dimer concentration to substrate concentration is given, with the actual concentration of peptide dimer shown in parentheses. The concentration of DNA substrate in each reaction was 0.2 μM.
b2-AP residues at the center of the DNA substrate are marked with an asterisk.
HJ-4AP2 shows a similar pattern of fluorescence quenching. A 1.2-fold decrease in fluorescence intensity is observed in the presence of an equimolar ratio of (WRWYCR)2 to substrate, and fluorescence intensity decreases by 2- to 2.2-fold at a 4- and 8-fold excess of peptide over substrate, respectively (Figure 4 and Table 2). As distance of the 2-AP residue from the branch point of the junction increases, there is a corresponding decrease in absolute fluorescence intensity in the absence of peptide, as expected (HJ-4AP3 and HJ-4AP4). Only the fluorescence of the HJ-4AP3 substrate is quenched significantly (up to 1.7-fold) by the peptide. The maximal decrease in fluorescence observed with HJ-4AP4 is 1.2-fold. This is consistent with previous results showing that (WRWYCR)2 interacts specifically with the accessible central bases of the junction, but not with linear dsDNA (22).
The remaining adenines near the branch point of the HJ were also tested for interactions with peptide (WRWYCR)2. HJ-1AP1 and HJ-3AP1 are located at the branch point and are both quenched significantly by the peptide, but the more distal base HJ-3AP2 is not quenched even at an 8-fold excess of peptide over substrate. The overall fluorescence intensity of HJ-1AP1 and HJ-3AP1 is lower than the other branch point bases (Figure 4), but is still strongly quenched in the presence of peptide (1.8- and 2.2-fold maximum, Table 2). It is unclear why the fluorescence of these bases is less intense in the absence of peptide than HJ-4AP1 and HJ-4AP2, but this could be the result of structural variations due to sequence differences in each strand. 2-AP fluorescence is efficiently quenched by neighboring guanine bases (30), and has been shown to be particularly well-stacked and solvent-protected within certain alternating AT-sequences (56). The position of HJ-3AP2 corresponds to one of these alternating AT-sequences. Consistent with this, the overall fluorescence intensity of HJ-3AP2 is lower than HJ-4AP3, which is the ‘equivalent’ base on the neighboring junction arm. Thus, the overall fluorescence intensity of 2-AP is extremely context-dependent. Stacks of adjacent adenine residues have also been reported to transfer excitation energy to 2-AP (57). It is conceivable that the adjacent adenines in strand 4 could have higher fluorescence emissions due to this transfer of energy or as a result of a change in base stacking, solvent protection or rotational flexibility. The observation that comparable quenching by peptide is still observed at each of the four central bases despite the difference in fluorescence intensity indicates that the overall fluorescence intensity (usually interpreted as the degree of base exposure) does not necessarily predict specific peptide-base interactions. Strong quenching is observed in five of the seven bases tested, with the greatest quenching occurring at the branch point of the junction regardless of overall fluorescence intensity.
We tested additional peptides in order to determine if there is a correlation between peptide potency and fluorescence quenching of HJ substrates. Peptide (KWWCRW)2 is nearly as potent as (WRWYCR)2 and binds to protein-free junctions, as observed by gel shift and footprinting assays (19,20,22; data not shown). In contrast, peptide WKHYNY is a very weak RecG inhibitor (IC50 >20–100 μM), and binding to protein-free HJ has not been detected by gel shift assays (data not shown). We tested binding interactions by titrating each peptide in reaction buffer with HJ-4AP1 and measuring the fluorescence emission spectra (Figure 5). As expected, (KWWCRW)2 strongly quenches 2-AP fluorescence at concentrations comparable to peptide (WRWYCR)2. Peptide WKHYNY has little if any effect on the fluorescence of 2-AP at this position, even at a 32-fold excess of peptide dimer.
Figure 5.

Peptide (KWWCRW)2 interacts with 4AP1 in the HJ substrate, but WKHYNY does not interact. Peptide (KWWCRW)2 (A) or peptide WKHYNY (B) was titrated in reactions containing 0.2 μM substrate, 20 mM Tris–HCl (pH 7.8), 100 mM NaCl, 1 mM EDTA, and 1.6% DMSO. Peptide concentrations were 0.05 μM (0.25:1 peptide to substrate ratio), 0.2 μM (1:1 peptide to substrate ratio), 0.8 μM (4:1 peptide to substrate ratio), 3.2 μM (16:1 peptide to substrate ratio) and 6.4 μM (32:1 peptide to substrate ratio). The concentration of WKHYNY is also expressed as a dimer for consistency.
Peptide (WRWYCR)2 quenches the central bases of replication fork substrates
We next investigated possible interactions between (WRWYCR)2 and replication fork structures. Three-way DNA junctions can be approximated as a Y-shaped extended structure that does not undergo helix–helix stacking in the presence of metal ions (58). The central region of the Y-junction used in the study by Duckett and Lilley is reactive to osmium tetroxide, indicating solvent accessibility. Thus, three-way structures such as the replication fork could be targets of the peptides. Inhibition of RecG unwinding of replication fork structures suggests that there is at least a transient interaction between (WRWYCR)2 and replication forks (22). To test this, we synthesized oligonucleotides with 2-AP placed at different locations and annealed the strands to form a replication fork. The sequence of the central region of the fork substrate and the positions of the 2-AP are shown in Supplementary Figure 3.
Emission spectra were measured for each substrate under the same conditions as the HJ (summarized in Table 2 and shown in Supplementary Figure 3). Fork-4AP1 shows little if any change in fluorescence at 0.2 μM (equimolar ratio of peptide dimer to substrate). However, 1.5-fold quenching is observed at 0.8 μM peptide (4-fold excess of peptide dimer) and 1.7-fold quenching is observed at 1.6 μM peptide dimer (8-fold excess). Results for Fork-4AP2 are similar and also show a concentration-dependent decrease in fluorescence intensity up to 2.0-fold. The fluorescence of Fork-4AP3 is less intense than that of the two previous positions, and as seen with the HJ substrate, Fork-4AP4 is only quenched a maximum of 1.2-fold at 1.6 μM peptide. There is a 1.5-fold decrease in fluorescence intensity at 370 nm with Fork-1AP1 at the highest concentration of peptide tested, while quenching of Fork-3AP2 is relatively weak (1.2-fold maximum). In summary, relatively strong (1.5- to 2-fold) quenching is observed at bases near the center of the replication fork substrate. As in the HJ substrate, bases away from the center are less sensitive to fluorescence quenching by the peptide.
The results thus far indicate that (WRWYCR)2 binds to DNA substrates that resemble replication forks. Previously, we observed that this peptide inhibits RecG most on a fork substrate with only the lagging strand and least on a fork substrate with only the leading strand (22). This could be explained if (WRWYCR)2 has different affinities for distinct substrates. We again tested peptide binding using fork substrates with individual adenines replaced by 2-AP, but only assembled annealing reactions with the ‘lagging strand’ oligonucleotide (Table 2 and Supplementary Figure 4). Similarly to the replication fork with three double-stranded arms, the fork containing only the lagging strand (Lag-4AP1) and lagging strand fork 4AP2 (Lag-4AP2) are quenched strongly by the peptide (Table 2 and Supplementary Figure 4). In contrast, Lag-4AP3 and Lag-4AP4 are quenched relatively weakly.
The single-stranded Lag-1AP1 is greatly fluorescent (up to >5-fold) in comparison to the other 2-AP positions (Supplementary Figure 4). An increase in base exposure to solvent at this position is expected to favor peptide binding. Indeed, fluorescence is quenched at a 4- and 8-fold molar excess of (WRWYCR)2 over substrate (Table 2). To ensure that peptide binding is the result of local replication fork structure, we titrated (WRWYCR)2 in a binding reaction with the 1AP1 oligonucleotide alone (data not shown). Unlike the lagging strand fork substrate, there is no significant quenching at an 8-fold molar excess of peptide. Quenching begins at a 16-fold peptide excess and increases at 32-fold excess of peptide, indicating that the peptide binds to ssDNA at very high concentrations (nevertheless, the magnitude of quenching on the oligo is not as great as the magnitude of quenching on the lagging strand fork). This result is not surprising since peptide (WRWYCR)2 binds to dsDNA nonspecifically at high concentrations (20). The final 2-AP position tested in this substrate, Lag-3AP2, showed only very weak quenching by peptide.
We also tested, the fork substrate with only the leading strand for fluorescence quenching by (WRWYCR)2 (Table 2). Lead-4AP1, Lead-4AP2 and Lead4AP3 are all quenched by the peptide, but Lead-4AP4 and Lead-1AP1 are less sensitive: the double-stranded Lead-1AP1 shows only a 1.3-fold decrease in fluorescence intensity at 1.6 μM peptide. This is in contrast to the strong quenching observed in the lagging strand fork substrate at this position, and supports the idea that a more exposed base at this position favors peptide binding. The final substrate tested did not contain either the lagging or leading strands, but comprised a ‘flayed’ duplex molecule (Table 2). Flayed-4AP1, Flayed-4AP2 and Flayed-4AP3 are even less sensitive to quenching by (WRWYCR)2 than the leading strand fork substrate. Flayed-4AP4 and Flayed-1AP1 are again only weakly quenched by peptide. Thus, our results indicate that peptide binding largely depends on at least two double-stranded arms (a template arm and in particular a lagging strand arm) in the replication fork for stability.
Peptide (WRWYCR)2 binds to branched DNA substrates with different affinities
In general, (WRWYCR)2 quenches 2-AP fluorescence most strongly in HJ, is weaker in quenching 2-AP fluorescence in the leading strand fork, and weakest on flayed duplex substrates (Table 2). The 2-AP in the complete fork substrate and the lagging strand fork are quenched at intermediate concentrations of peptide. More extensive titrations of peptide were performed with each substrate to verify this observation; the 2-AP was at the 4AP2 position in each substrate. Reactions were assembled in buffer containing 0.1 μM substrate and peptide was subsequently added resulting in 2-fold step increases in concentration. The fraction of peptide/substrate complex formed (Fc, Figure 6 legend) was determined and plotted for comparison (the actual points). As expected, the results indicate that there is indeed a difference in binding affinity between each substrate (Figure 6).
Figure 6.

Peptide (WRWYCR)2 interacts with branched DNA structures with different affinities. The aminopurine was located in strand 4, position 2 (4AP2) in each substrate. Peptide additions were made resulting in 2-fold concentration increases at each interval, starting with 0.003125 μM. After incubation for 3 min, emission spectra were recorded between 330 and 430 nm at 1 nm intervals using an excitation wavelength of 315 nm. Corrected fluorescence intensity (Fcorr) values were calculated by subtracting 2-AP emission spectra by the spectra from equivalent titrations with the 2-AP nucleotide replaced with adenine. The Fcorr values for each peptide concentration were averaged from a window of 365–375 nm and used to calculate Fc, the fraction of peptide/substrate complex formed. Fc is defined as (FP–F0)/(FS–F0), where FP is the average corrected fluorescence intensity in the presence of peptide dimer concentration P, F0 is the average corrected fluorescence intensity without peptide and FS is the average corrected fluorescence intensity at saturation. Fc was plotted as a function of (WRWYCR)2 concentration. The inset graph shows the binding curves over almost the entire range of concentrations tested.
In order to obtain an equilibrium Kd value of peptide for each substrate, the data were fit to the binding equation shown in Materials and methods section using a nonlinear least squares fitting algorithm. The fitting was accomplished by adjusting the dissociation constant Kd to values of the total peptide added, Lt, and spectroscopically measured values of the fraction of substrate complexed with peptide, Fc. The calculated Kd with accompanying R2 values are shown in Table 3. The best fits (Figure 6) indicated that peptide (WRWYCR)2 binds with the highest affinity to HJ (Kd of 14.3 nM). The substrates can be divided into three groups according to strength of binding, with the strongest binding for HJ, medium strength binding for Lead, Lag and Fork, and weak binding for flayed and oligo.
Table 3.
Summary of calculated Kd values for DNA substrates
| Substrate | Kd (nM) | R2 | Fold reduced versus HJa |
|---|---|---|---|
| Holliday junction | 14.3 ± 3.2 | 0.992 | 1 |
| Complete fork | 63.5 ± 12.0 | 0.958 | 4.4 |
| Lagging strand fork | 79.2 ± 17.3 | 0.942 | 5.5 |
| Leading strand fork | 132 ± 32.8 | 0.963 | 9.2 |
| Flayed fork | 628 ± 107 | 0.913 | 43.9 |
| Oligo | 731 ± 134 | 0.923 | 51.1 |
aComparison of Kd values (affinities) of the peptide for the HJ with the Kd values for other substrates.
As described above, binding to all of the substrates is measured by the quenching of a fluorescent base, 2-AP, at one position in each DNA molecule and thus the null hypothesis is that 2-AP reports a single binding site for the peptide dimer. An alternate hypothesis, however, is that binding of additional peptides elsewhere on the substrate can affect the interactions of the peptide bound at the center of the junction, where the 2-AP base is located. This alternative n > 1 hypothesis is explored further in the Supplement; however, the qualitative picture implied by the two hypotheses is the same. We conclude that there is very good correlation between inhibition of RecG activity and substrate binding affinity of (WRWYCR)2 to replication forks and HJ substrates. Therefore, the inhibition of RecG activity on replication forks is most simply explained by competition between RecG and (WRWYCR)2 for these substrates.
(WRWYCR)2 binding to branched DNA is sensitive to DTT
As mentioned above, previous results indicated that the active conformation of peptide (WRWYCR)2 for inhibition of Int-mediated recombination is a dimer linked through a disulfide bridge (20). Gel shift assays showed that peptides bind to protein-free HJ as dimers (22). The crystal structure of peptide WKHYNY bound to the Cre/HJ complex strongly implies that even this relatively weak peptide binds as a dimer (23), although it requires Cre to make the HJ into a target. However, the stoichiometry of WRWYCR with respect to fork structures is less clear. Based on the fact that forks roughly resemble half a HJ the peptide may, in principle, bind to forks as a monomer. However, the molecular modeling studies predict more interactions between a fork and a peptide dimer than a monomer. We tested this question directly by assembling reactions with each substrate in the presence and absence of DTT (Figure 7). A relatively high concentration of peptide dimer (1.6 μM or an 8-fold excess) was used for each experiment to provide sufficient fluorescence quenching. The 2-AP at position 4AP2 was used for each substrate. The presence of 10 mM DTT significantly decreases fluorescence quenching of the HJ substrate by the peptide (Figure 7A). The extent of the reduced quenching for each substrate is summarized in Figure 7B. Depending on the substrate, the peptide quenches fluorescence of 4AP2 by 1.7- to 2.6-fold in the absence of DTT, but only by 1.2- to 1.3-fold in the presence of DTT. Thus, the most active form of peptide (WRWYCR)2 is a dimer even when targeting replication fork DNA substrates.
Figure 7.

Fluorescence quenching of (WRWYCR)2 is sensitive to DTT. Reactions were as described for Figure 4. Spectra were recorded in the presence or absence of 10 mM DTT and 1.6 μM peptide dimer (8-fold excess dimer: substrate). Fcorr values were calculated as above. The 2-AP in strand 4, position 2 (4AP2) was used for each substrate. (A) Spectra obtained for the HJ substrate in the presence and absence of DTT and peptide, plotted on the same graph. (B) Summary of the fold-decrease in fluorescence intensity at 370 nm in presence and absence of DTT for the HJ and each remaining substrate.
DISCUSSION
Peptides (WRWYCR)2 and (KWWCRW)2 block site-specific recombination mediated by tyrosine recombinases by binding to the HJ intermediate of this family of reactions and inhibiting further catalysis. These peptides recognize protein-free HJ and inhibit resolution by several HJ resolvases. The RecG branched-DNA-specific helicase and the RuvABC complex are inhibited about as well as are Cre and XerC/D, with an IC50 of ∼50 nM, 500–1000X more effective inhibition than of RuvC alone, T7 endonuclease I or RusA (22). Based on biochemical data including KMnO4 footprinting experiments, we proposed that the peptides inhibit most efficiently processing of those junctions that are in the most open configuration for the longest time. Thus, inhibition of junction resolution by RuvABC is more effective than inhibition of RuvC alone because the junction substrate is in the square planar conformation longer when the RuvABC complex is bound. In agreement with our hypothesis, the crystal structure of T7 endonuclease I—DNA complex shows that, while the central bases of the junction are unstacked, there is relatively little free space in the junction center when the enzyme is bound (59). To understand the molecular basis of inihibition by these peptide in detail, structural information on peptide-junction interactions would clearly be very useful.
In addition to needing a framework for the mechanism of DNA binding by the peptides, inhibition of RecG by (WRWYCR)2 presented a dilemma: inhibition of RecG activity occurred both on HJ and on replication fork substrates (complete or partial), but we were only able to demonstrate peptide binding to the HJ when we used gel shift assays (22). Inhibition of RecG by (WRWYCR)2 should depend on both the relative affinity of RecG and peptide for the HJ substrate and their relative rates of dissociation. Our latest data indicate that although RecG and (WRWYCR)2 have similar binding affinities for junctions when using our gel shift assay conditions, the RecG/HJ complex dissociates ∼2X faster and the peptide can displace RecG from the HJ substrate. Thus, the peptide forms more stable complexes with junctions than RecG. The 2-AP fluorescence-based solution assay results show that peptides WRWYCR and KWWCRW bind to replication fork-like substrates. In aggregate, these results demonstrate that the peptides inhibit RecG activity on replication fork substrates and HJ by direct competition between RecG and peptide for the branched DNAs.
Competitive inhibition between RecG and peptide supports the idea that stacking interactions between each peptide and DNA may resemble those observed between the wedge domain of RecG and replication fork DNA. The structural model proposed in Figure 3 shows that stacking interactions between the peptide and several of the central bases in a HJ substrate can occur, and the 2-AP fluorescence results confirm such stacking interactions. Bases at the branch point of each substrate were more sensitive to quenching by the peptide than bases located 2–3 bases away from the center, suggesting that for peptide WRWYCR and KWWCRW intercalation between nucleotides further from the center of the junction almost certainly does not occur beyond at most two nucleotide steps. The modeling provides a theoretical explanation for the more stable and higher affinity interactions of the peptide with HJ versus fork substrates and why a peptide dimer shows more stable interactions with the HJ than a monomer. The interactions between substrate and peptide increase as the substrate changes from a fork to a junction, and as the peptide is dimerized (Table 1). In the peptide–HJ model, the peptide makes 4π–π aromatic stacking interactions between amino acids in the peptide and central bases in the HJ. One of the amino acid-base stacking interactions may be further stabilized by a π–π aromatic stacking interactions between two amino acids (45) to form a 3-member stack between the base E: A18 and amino acids W1b and Y4b of one of the peptide monomers. Across the junction center, the stacking interaction between the base D: A18 and W1a may be further stabilized by an aromatic–aromatic T-shaped (orthogonal) interaction between Y4a and W1a (Figure 3D and 3E; 45,46). Finally, the folded peptide structure in the model may also be stabilized by a π-cationic intra-peptide interaction (47,48) between R6a and Y4a.
With respect to matching the 2-AP fluorescence data with the structural models, the fluorescence quenching data presented here is limited to half of the central bases. While the position of each peptide-base stacking interaction does not exactly match the position of the 2-AP fluorescence quenching, the results are quite similar. Four 2-AP bases at the immediate center of the HJ are quenched at least 1.6-fold at a 4-fold excess of peptide dimer over substrate (Table 2). Two of the four peptide–base stacking interactions in the (WRWYCR)2/HJ model (Figure 3E and F) agree with the 2-AP fluorescence quenching results, while the remaining two interactions occur at the complementary bases. A complete but preliminary set of 2-AP quenching assays tested all of the central bases of the HJ by changing the sequence of the relevant oligos and thus the location of the 2-AP residue (Boldt,J. and Segall,A., unpublished data). In these assays, seven of the eight central bases were very strongly quenched by the peptide (>2X), and the eighth base was moderately quenched (1.6X). In contrast, the structural models suggest that the peptide would only quench one of the two bases in a given base pair. Perhaps peptide binding is sufficiently flexible that stacking interactions may occur with different bases depending on the actual sequence at the branch center. This possibility would help account for the poor resolution of the peptide in the Cre-loxPHJ-peptide crystal, and will be tested in the future. Efforts are underway to obtain structures of (WRWYCR)2 bound to a protein-free HJ.
In addition to showing that peptides bind to replication forks and providing substantial validation for the structural models, the 2-AP studies provided an independent, solution-based assay for determining the affinity of the peptides to several different DNA substrates, including replication fork-like substrates. The isolated wedge domain of RecG does not bind replication forks (at least stably enough for gel-based detection), requiring an additional motif consisting of three conserved residues (CVG) that interact with the lagging strand arm (12,27). The extra contacts a peptide dimer is able to make compared to a peptide monomer may substitute for the interactions made by RecG's CVG motif. RecG has a 10- to 100-fold weaker affinity for flayed duplex DNA molecules when compared to HJ (11,17). (WRWYCR)2 binds with the highest affinity to HJ, about 4–5X less to complete and lagging strand replication forks, and about 9X less to leading strand forks. It remains to be seen whether the stoichiometry of the peptide dimer is also one for the replication fork-like substrates. Binding to the flayed DNA substrate, which has the most single-stranded character, is much weaker (∼44X reduced) and is likely to include nonspecifically bound peptides.
Not all small aromatic peptides quench the 2-AP fluorescence in the center of HJ: WKHYNY shows almost no quenching (Figure 6B), despite a concentration-dependent quenching effect on 2-AP when interacting with the Cre/HJ complex (23). The Cre-protein (and the Int protein by analogy; 21) must contribute to stabilizing interactions, most likely by opening the center of the HJ and providing a more conducive environment to peptide binding. The weaker binding of WKHYNY may be due to its being a monomer in solution until complexed with Cre/HJ complexes (23).
KMnO4 footprinting assays showed that central thymine bases (up to two bases from the center) are more sensitive to modification in the presence of peptide or RecG, which increases KMnO4 sensitivity nearly 2-fold when bound to HJ (22). These bases presumably become more exposed to solution when bound either by RecG or by peptide. Hence, it might be reasonable to predict that 2-AP fluorescence should also increase in the presence of peptide, as has been observed with the HJ resolvases CCE1 of S. cerevisiae and T7 endonuclease I (31,32). These proteins function by distorting the global conformation of the junction, triggering a conformational change in the DNA that activates catalysis (60) without concomitantly making direct stacking contacts with the central bases (59). The extensive disruption caused by T7 endonuclease I is due to interactions between the protein and the junction arms (59), leading both to an overall increase in KMnO4 sensitivity and a very large increase in 2-AP fluorescence (31). In contrast, the increase in KMnO4 modification accompanied by quenching of 2-AP fluorescence by (WRWYCR)2 argues in favor of a model in which direct stacking of aromatic amino acids in the peptide promotes a modest rotation or opening of central bases and at the same time provides access for attack by the small permanganate ions during footprinting. The structural model shown in Figure 3 certainly allows for the accessibility of KMnO4. This mechanism of peptide binding would directly interfere with critical interactions between junction-processing enzymes and the central region of the HJ.
In summary, the fluorescent probe 2-AP permits detection of specific interactions between peptide inhibitors and branched DNA substrates, and is a more sensitive assay than gel electrophoresis. Dimerization is essential for all DNA binding, especially to HJ and replication fork substrates. The very good correlation between inhibition of RecG activity (22) and substrate binding affinity of (WRWYCR)2 to replication forks and HJ substrates together with the competition data show that the inhibition of RecG activity is most simply explained by competition between the helicase and the peptides for the same substrates. In addition to the prediction that any junction resolvase or branch migrase which interacts with the open form of a branched DNA is expected to be a good target of peptide inhibition, the converse—that enzymes which are poorly inhibited by the peptides are likely to work on substrates in more stacked conformations—is also likely to be true, and should be a useful simple test in the characterization of these enzyme families.
SUPPLEMENTARY DATA
Supplementary Data are available at NAR Online.
Funding
Funding for Open Access publication charge: NIH R01 AI58253.
Conflict of interest statement. None declared.
Supplementary Material
ACKNOWLEDGEMENTS
We are grateful to Dr Peter McGlynn for providing the RecG protein and Drs Barbara Bailey, Robert Dutnall and Yuk Yin Sham for helpful discussions. We thank Marc Rideout for assistance in synthesizing and purifying oligonucleotides for 2-AP assays, and we thank Jeffrey Boldt for general technical assistance and for the unpublished 2-AP assay results. Marc Rideout and Rudra Saha made useful comments on the manuscript. Finally, Teresa Larsen helped N.P. get started with Insight II. National Institutes of Health grant AI58253 to A.M.S.; Achievement Rewards for College Scientists scholarship to K.V.K.
REFERENCES
- 1.Gray MD, Shen JC, Kamath-Loeb AS, Blank A, Sopher BL, Martin GM, Oshima J, Loeb LA. The Werner syndrome protein is a DNA helicase. Nature Genet. 1997;17:100–103. doi: 10.1038/ng0997-100. [DOI] [PubMed] [Google Scholar]
- 2.Guy CP, Bolt EL. Archaeal Hel308 helicase targets replication forks in vivo and in vitro and unwinds lagging strands. Nucleic Acids Res. 2005;33:3678–3690. doi: 10.1093/nar/gki685. [DOI] [PMC free article] [PubMed] [Google Scholar]
- 3.Karow JK, Constantinou A, Li JL, West SC, Hickson ID. The Bloom's syndrome gene product promotes branch migration of Holliday junction. Proc. Natl Acad. Sci. USA. 2000;97:6507–6508. doi: 10.1073/pnas.100448097. [DOI] [PMC free article] [PubMed] [Google Scholar]
- 4.Tsaneva IR, Muller B, West SC. RuvA and RuvB proteins of Escherichia coli exhibit DNA helicase activity in vitro. Proc. Natl Acad. Sci. USA. 1993;90:1315–1319. doi: 10.1073/pnas.90.4.1315. [DOI] [PMC free article] [PubMed] [Google Scholar]
- 5.Wen Q, Mahdi AA, Briggs GS, Sharples GJ, Lloyd RG. Conservation of RecG activity from pathogens to hyperthermophiles. DNA Repair. 2005;4:23–31. doi: 10.1016/j.dnarep.2004.07.008. [DOI] [PubMed] [Google Scholar]
- 6.Caruthers JM, McKay DB. Helicase structure and mechanism. Curr. Opin. Struct. Biol. 2002;12:123–133. doi: 10.1016/s0959-440x(02)00298-1. [DOI] [PubMed] [Google Scholar]
- 7.West SC. Processing of recombination intermediates by the RuvABC proteins. Annu. Rev. Genet. 1997;31:213–244. doi: 10.1146/annurev.genet.31.1.213. [DOI] [PubMed] [Google Scholar]
- 8.LeBowitz JH, McMacken R. The Escherichia coli dnaB replication protein is a DNA helicase. J. Biol. Chem. 1986;261:4738–4748. [PubMed] [Google Scholar]
- 9.McGlynn P, Mahdi AA, Lloyd RG. Characterization of the catalytically active form of RecG helicase. Nucleic Acids Res. 2000;28:2324–2332. doi: 10.1093/nar/28.12.2324. [DOI] [PMC free article] [PubMed] [Google Scholar]
- 10.Whitby MC, Ryder L, Lloyd RG. Reverse branch migration of Holliday junctions by RecG protein: a new mechanism for resolution of intermediates in recombination and DNA repair. Cell. 1993;75:341–350. doi: 10.1016/0092-8674(93)80075-p. [DOI] [PubMed] [Google Scholar]
- 11.McGlynn P, Lloyd RG. Rescue of stalled replication forks by RecG: simultaneous translocation on the leading and lagging strand templates supports an active DNA unwinding model of fork reversal and Holliday junction formation. Proc. Natl Acad. Sci. USA. 2001;98:8227–8234. doi: 10.1073/pnas.111008698. [DOI] [PMC free article] [PubMed] [Google Scholar]
- 12.Singleton MR, Scaife S, Wigley DB. Structural analysis of DNA replication fork reversal by RecG. Cell. 2001;107:79–89. doi: 10.1016/s0092-8674(01)00501-3. [DOI] [PubMed] [Google Scholar]
- 13.Lloyd RG. Conjugational recombination in resolvase-deficient ruvC mutants of Escherichia coli K-12 depends on recG. J. Bacteriol. 1991;173:5414–5418. doi: 10.1128/jb.173.17.5414-5418.1991. [DOI] [PMC free article] [PubMed] [Google Scholar]
- 14.Lloyd RG, Buckman C. Genetic analysis of the recG locus of Escherichia coli K-12 and of its role in recombination and DNA repair. J. Bacteriol. 1991;173:1004–1011. doi: 10.1128/jb.173.3.1004-1011.1991. [DOI] [PMC free article] [PubMed] [Google Scholar]
- 15.McGlynn P, Lloyd RG. Recombinational repair and restart of damaged replication forks. Nat. Rev. Mol. Cell Biol. 2002;3:859–870. doi: 10.1038/nrm951. [DOI] [PubMed] [Google Scholar]
- 16.Lloyd RG, Sharples GJ. Dissociation of synthetic Holliday junctions by E. coli RecG protein. EMBO J. 1993;12:17–22. doi: 10.1002/j.1460-2075.1993.tb05627.x. [DOI] [PMC free article] [PubMed] [Google Scholar]
- 17.Whitby MC, Lloyd RG. Targeting Holliday junctions by the RecG branch migration protein of Escherichia coli. J. Biol. Chem. 1998;273:19729–19739. doi: 10.1074/jbc.273.31.19729. [DOI] [PubMed] [Google Scholar]
- 18.Cassell G, Klemm M, Pinilla C, Segall A. Dissection of bacteriophage lambda site-specific recombination using synthetic peptide combinatorial libraries. J. Mol. Biol. 2000;299:1193–1202. doi: 10.1006/jmbi.2000.3828. [DOI] [PubMed] [Google Scholar]
- 19.Klemm M, Cheng C, Cassell G, Shuman S, Segall AM. Peptide inhibitors of DNA cleavage by tyrosine recombinases and topoisomerases. J. Mol. Biol. 2000;299:1203–1216. doi: 10.1006/jmbi.2000.3829. [DOI] [PubMed] [Google Scholar]
- 20.Boldt JL, Pinilla C, Segall AM. Reversible inhibitors of lambda Integrase-mediated recombination efficiently trap Holliday junction intermediates and form the basis of a novel assay for junction resolution. J. Biol. Chem. 2004;279:3472–3483. doi: 10.1074/jbc.M309361200. [DOI] [PubMed] [Google Scholar]
- 21.Cassell GD, Segall AM. Mechanism of inhibition of site-specific recombination by the Holliday junction-trapping peptide WKHYNY: insights into phage λ Integrase-mediated strand exchange. J. Mol. Biol. 2003;327:413–429. doi: 10.1016/s0022-2836(03)00058-5. [DOI] [PubMed] [Google Scholar]
- 22.Kepple KV, Boldt JB, Segall AM. Holliday junction-binding peptides inhibit distinct junction-processing enzymes. Proc. Natl Acad. Sci. USA. 2005;102:6867–6872. doi: 10.1073/pnas.0409496102. [DOI] [PMC free article] [PubMed] [Google Scholar]
- 23.Ghosh K, Lau CK, Guo F, Segall AM, Van Duyne GD. Peptide trapping of the Holliday junction intermediate in Cre-loxP site-specific recombination. J. Biol. Chem. 2005;280:8290–8299. doi: 10.1074/jbc.M411668200. [DOI] [PubMed] [Google Scholar]
- 24.Gunderson CG, Segall AM. DNA repair, a novel antibacterial target: Holliday junction-trapping peptides induce DNA damage and chromosome segregation defects. Mol. Microbiol. 2006;59:1129–1148. doi: 10.1111/j.1365-2958.2005.05009.x. [DOI] [PubMed] [Google Scholar]
- 25.Rajeev L, Segall A, Gardner J. The Bacteroides NBU1 Integrase performs a homology independent strand exchange to form a Holliday junction intermediate. J. Biol. Chem. 2007;282:31228–31237. doi: 10.1074/jbc.M705370200. [DOI] [PubMed] [Google Scholar]
- 26.Bugreev DV, Hanaoka F, Mazin AV. Rad54 dissociates homologous recombination intermediates by branch migration. Nat. Struct. Mol. Biol. 2007;14:746–753. doi: 10.1038/nsmb1268. [DOI] [PubMed] [Google Scholar]
- 27.Briggs GS, Mahdi AA, Wen Q, Lloyd RG. DNA binding by the substrate specificity (wedge) domain of RecG helicase suggests a role in processivity. J. Biol. Chem. 2005;280:13921–13927. doi: 10.1074/jbc.M412054200. [DOI] [PubMed] [Google Scholar]
- 28.Duckett DR, Murchie AIH, Diekmann S, von Kitzing E, Kemper B, Lilley DMJ. The structure of the Holliday junction, and its resolution. Cell. 1988;55:79–89. doi: 10.1016/0092-8674(88)90011-6. [DOI] [PubMed] [Google Scholar]
- 29.Duckett DR, Murchie AIH, Lilley DM. The role of metal ions in the conformation of the four-way DNA junction. EMBO J. 1990;9:583–590. doi: 10.1002/j.1460-2075.1990.tb08146.x. [DOI] [PMC free article] [PubMed] [Google Scholar]
- 30.McGlynn P, Lloyd RG. RecG helicase activity at three- and four-strand DNA structures. Nucleic Acids Res. 1999;27:3049–3056. doi: 10.1093/nar/27.15.3049. [DOI] [PMC free article] [PubMed] [Google Scholar]
- 31.Declais A-C, Lilley DMJ. Extensive central disruption of a four-way junction on binding CCE1 resolving enzyme. J. Mol. Biol. 2000;296:421–433. doi: 10.1006/jmbi.1999.3479. [DOI] [PubMed] [Google Scholar]
- 32.Declais A-C, Fogg JM, Freeman ADJ, Coste F, Hadden JM, Phillips SEV, Lilley DMJ. The complex between a four-way junction and T7 endonuclease I. EMBO J. 2003;22:1398–1409. doi: 10.1093/emboj/cdg132. [DOI] [PMC free article] [PubMed] [Google Scholar]
- 33.Gopaul DN, Guo F, Van Duyne GD. Structure of the Holliday junction intermediate in Cre-loxP site-specific recombination. EMBO J. 1998;17:4175–4187. doi: 10.1093/emboj/17.14.4175. [DOI] [PMC free article] [PubMed] [Google Scholar]
- 34.Guex N, Peitsch MC. SWISS-MODEL and the Swiss-Pdb Viewer:an environment for comparative protein modeling. Electrophoresis. 1997;18:2714–2723. doi: 10.1002/elps.1150181505. [DOI] [PubMed] [Google Scholar]
- 35.Dey R, Roychowdhury P, Mukherjee C. Homology modelling of the ligand-binding domain of glucocorticoid receptor: binding site interactions with cortisol and corticosterone. Protein Eng. 2001;14:565–571. doi: 10.1093/protein/14.8.565. [DOI] [PubMed] [Google Scholar]
- 36.Waingeh VF, Gustafson CD, Kozliak EI, Lowe SL, Knull HR, Thomasson KA. Glycolytic enzyme interactions with yeast and skeletal muscle F-actin. Biophys. J. 2006;90:1371–1384. doi: 10.1529/biophysj.105.070052. [DOI] [PMC free article] [PubMed] [Google Scholar]
- 37.Lin TH, Tsai KC, Lo TC. Homology modeling of the central catalytic domain of insertion sequence ISLC3 isolated from Lactobacillus casei ATCC 393. Protein Eng. 2003;16:819–829. doi: 10.1093/protein/gzg107. [DOI] [PubMed] [Google Scholar]
- 38.Bastos IM, Grellier P, Martins NF, Cadavid-Restrepo G, de Souza-Ault MR, Augustyns K, Teixeira AR, Schrevel J, Maigret B, da Silveira JF, Santana JM. Molecular, functional and structural properties of the prolyl oligopeptidase of Trypanosoma cruzi (POP Tc80), which is required for parasite entry into mammalian cells. Biochem. J. 2005;388:29–38. doi: 10.1042/BJ20041049. [DOI] [PMC free article] [PubMed] [Google Scholar]
- 39.Bhattacharya S, Ghosh S, Chakraborty S, Bera AK, Mukhopadhayay BP, Dey I, Banerjee A. Insight to structural subsite recognition in plant thiol protease-inhibitor complexes: Understanding the basis of differential inhibition and the role of water. BMC Struct. Biol. 2001;1:4. doi: 10.1186/1472-6807-1-4. [DOI] [PMC free article] [PubMed] [Google Scholar]
- 40.Hagler AT, Huler E, Lifson S. Energy functions for peptides and proteins. I. Derivation of a consistent force field including the hydrogen bond from amide crystals. J. Am. Chem. Soc. 1974;96:5319–5327. doi: 10.1021/ja00824a004. [DOI] [PubMed] [Google Scholar]
- 41.Dauber-Osguthorpe P, Roberts VA, Osguthorpe DJ, Wolff J, Genest M, Hagler AT. Structure and energetics of ligand binding to proteins: Escherichia coli dihydrofolate reductase-trimethoprim, a drug-receptor system. Proteins. 1988;4:31–47. doi: 10.1002/prot.340040106. [DOI] [PubMed] [Google Scholar]
- 42.Kitson DH, Hagler AT. Theoretical studies of the structure and molecular dynamics of a peptide crystal. Biochemistry. 1988;27:5246–5257. doi: 10.1021/bi00414a045. [DOI] [PubMed] [Google Scholar]
- 43.LaConte LE, Voelz V, Nelson W, Enz M, Thomas DD. Molecular dynamics simulation of site-directed spin labeling: experimental validation in muscle fibers. Biophys. J. 2002;83:1854–1866. doi: 10.1016/S0006-3495(02)73950-7. [DOI] [PMC free article] [PubMed] [Google Scholar]
- 44.Wilkinson KD. Quantitative analysis of protein-protein interactions. Methods Mol. Biol. 2004;261:15–31. doi: 10.1385/1-59259-762-9:015. [DOI] [PubMed] [Google Scholar]
- 45.McGaughey GB, Gagne M, Rappe AK. π-Stacking interactions. Alive and well in proteins. J. Biol. Chem. 1998;273:15458–15463. doi: 10.1074/jbc.273.25.15458. [DOI] [PubMed] [Google Scholar]
- 46.Gervasio FL, Chelli R, Procacci P, Schettino V. The nature of intermolecular interactions between aromatic amino acid residues. Proteins. 2002;48:117–125. doi: 10.1002/prot.10116. [DOI] [PubMed] [Google Scholar]
- 47.Scrutton NS, Raine AR. Cation-π bonding and amino-aromatic interactions in the biomolecular recognition of substituted ammonium ligands. Biochem. J. 1996;319:1–8. doi: 10.1042/bj3190001. [DOI] [PMC free article] [PubMed] [Google Scholar]
- 48.Gallivan JP, Dougherty DA. Cation-π interactions in structural biology. Proc. Natl Acad. Sci. USA. 1999;96:9459–9464. doi: 10.1073/pnas.96.17.9459. [DOI] [PMC free article] [PubMed] [Google Scholar]
- 49.Law SM, Eritja R, Goodman MF, Breslauer KJ. Spectroscopic and calorimetric characterizations of DNA duplexes containing 2-aminopurine. Biochemistry. 1996;35:12329–12337. doi: 10.1021/bi9614545. [DOI] [PubMed] [Google Scholar]
- 50.McLaughlin LW, Leong T, Benseler F, Piel N. A new approach to the synthesis of a protected 2-aminopurine derivative and its incorporation into oligodeoxynucleotides containing the EcoRI and BamHI recognition sites. Nucleic Acids Res. 1988;16:5631–5644. doi: 10.1093/nar/16.12.5631. [DOI] [PMC free article] [PubMed] [Google Scholar]
- 51.Nordlund TM, Andersson S, Nilsson L, Rigler R, Graslund A, McLaughlin LW. Structure and dynamics of a fluorescent DNA oligomer containing the EcoRI recognition sequence: fluorescence, molecular dynamics, and NMR studies. Biochemistry. 1989;28:9095–9103. doi: 10.1021/bi00449a021. [DOI] [PubMed] [Google Scholar]
- 52.Ward DC, Reich E, Stryer L. Fluorescence studies of nucleotides and polynucleotides. J. Biol. Chem. 1969;244:1228–1237. [PubMed] [Google Scholar]
- 53.Xu D, Evans KO, Nordlund TM. Melting and premelting transitions of an oligomer measured by DNA base fluorescence and absorption. Biochemistry. 1994;33:9592–9599. doi: 10.1021/bi00198a027. [DOI] [PubMed] [Google Scholar]
- 54.Connolly BA. Synthetic oligodeoxynucleotides containing modified bases. Methods Enzymol. 1992;211:36–53. doi: 10.1016/0076-6879(92)11005-4. [DOI] [PubMed] [Google Scholar]
- 55.Fujimoto J, Nuesca Z, Mazurek M, Sowers LC. Synthesis and hydrolysis of oligodeoxyribonucleotides containing 2-aminopurine. Nucleic Acids Res. 1996;24:754–759. doi: 10.1093/nar/24.4.754. [DOI] [PMC free article] [PubMed] [Google Scholar]
- 56.Rai P, Cole TD, Thompson E, Millar DP, Linn S. Steady-state and time-resolved fluorescence studies indicate an unusual conformation of 2-aminopurine within ATAT and TATA duplex DNA sequences. Nucleic Acids Res. 2003;31:2323–2332. doi: 10.1093/nar/gkg339. [DOI] [PMC free article] [PubMed] [Google Scholar]
- 57.Xu D, Nordlund TM. Sequence dependence of energy transfer in DNA oligonucleotides. Biophys. J. 2000;78:1042–1058. doi: 10.1016/S0006-3495(00)76663-X. [DOI] [PMC free article] [PubMed] [Google Scholar]
- 58.Duckett DR, Lilley DM. The three-way DNA junction is a Y-shaped molecule in which there is no helix-helix stacking. EMBO J. 1990;9:1659–1664. doi: 10.1002/j.1460-2075.1990.tb08286.x. [DOI] [PMC free article] [PubMed] [Google Scholar]
- 59.Hadden JM, Declais AC, Carr SB, Lilley DM, Phillips SE. The structural basis of Holliday junction resolution by T7 endonuclease I. Nature. 2007;449:621–624. doi: 10.1038/nature06158. [DOI] [PubMed] [Google Scholar]
- 60.Sharples GJ. The X philes: structure-specific endonucleases that resolve Holliday junctions. Mol. Microbiol. 2001;39:823–834. doi: 10.1046/j.1365-2958.2001.02284.x. [DOI] [PubMed] [Google Scholar]
Associated Data
This section collects any data citations, data availability statements, or supplementary materials included in this article.