Abstract
Although stable isotopic labeling has found widespread use in the proteomics field, its application to carbohydrate quantification has been limited. Herein we report the design, synthesis, and application of a novel series of compounds that allow for the incorporation of isotopic variation within glycan structures. The novel feature of the compounds is the ability to incorporate the isotopes in a controlled manner, allowing for the generation of four tags that vary only in their isotopic content. This allows for the direct comparisons of three samples or triplicate measurements with an internal standard within one mass spectral analysis. Quantitation of partially depolymerized glycosaminoglycan mixtures, as well as N-linked glycans released from fetuin, is used to demonstrate the utility of the tetraplex tagging strategy.
Keywords: Carbohydrate Quantification, Stable Isotope Tag, Glycomics
Introduction
Most nuclear, cytosolic, membrane bound and secreted proteins are glycosylated.1 Glycoconjugate glycans serve structural functions,2 play roles in protein folding, turnover, and secretion,3 mediate cell growth4, 5 and adhesion, and serve as elements for bacterial or viral recognition and invasion.6, 7 Despite their prevalence in biological systems, a detailed understanding of their functions remains elusive, due in part to the nature of their non-template-driven biosynthesis. The structures of glycoconjugate glycans depend on the action of glycosyltransferase enzymes and the availability of nucleotide sugar precursors.8 Because some of the individual biosynthetic reactions do not go to completion, expressed glycans consist of a distribution of related glycoforms built on a common core structure that modify a given aglycon (amino acid residue or lipid). Their heterogeneous nature, where glycoform expression patterns vary by tissue localization and temporal factors, such as development or disease states, also pose analytical challenges.
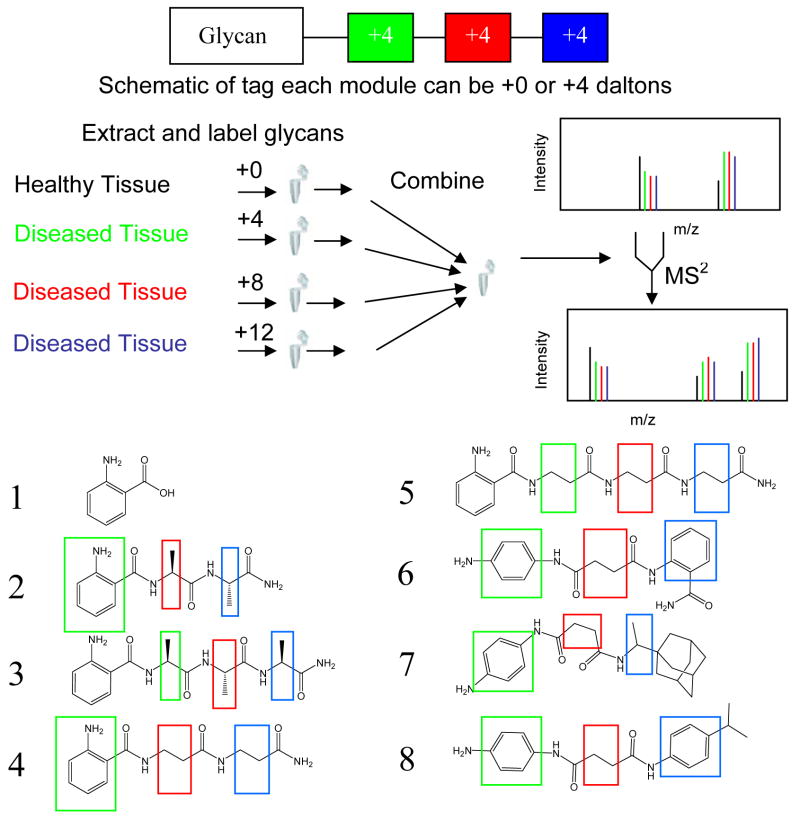
These limitations require the use of methods that allow for the analysis of small quantities of heterogeneous biological samples. Mass spectrometry is widely used to determine the carbohydrate components within a biological system.9–15 Accurate quantification of glycoconjugate glycans among different samples will enable improved understanding of human disease processes. Such quantification remains a difficult task due to instrumental and sample variability. The feasibility of stable isotope glycan tags has been demonstrated by Yuan et al.16 and Hitchcock et al.17 in which one isotopically varied reductive amination tag was used to quantify the relative amount of carbohydrate present in samples using liquid chromatography/mass spectrometry (LC/MS). These duplex tags require multiple LC/MS runs to obtain statistically relevant data. Hsu et al. use a synthesized affinity tag which incorporates a biotin moiety, and allows for the incorporation of a single deuterium atom via reduction with sodium borodeuteride;18 however, the mass shift of 1 Da may not suffice for quantitation due to the overlapping isotopic envelopes. The present work describes newly synthesized tags, capable of being modified with four isotope enriched variants, allowing for the determination of statistically relevant data in a single experiment (Scheme 1). The defining feature of the tags is the ability to incorporate multiple isotopic labels as distinct modules, thereby allowing for the direct comparison of multiple samples using mass spectrometry.
Scheme 1.
Representation of tetraplex tags and experimental flow chart and sythesized compounds indicating potential sites for isotopic modification.
Isotopic labeling has been applied in many forms to samples in the proteomics field;19, 20 however, the use of isotope labels for carbohydrates is only beginning to find use.16–18 Experience with the ICAT reagent21 has shown chromatographic resolution of the isotopically varied analytes22 and fragmentation of the tag.23 These problems have been overcome by the incorporation of 13C in place of deuterium and an acid cleavable linker to the biotin which reduces the size and fragmentation complexity of the tag. 24, 25
This work builds on knowledge obtained from proteomics into the design of tags utilizing chemistry appropriate for released glycans, compatible with tandem MS, and flexible to allow features such as chromophores and/or affinity handles. Deuterated tags were designed for use with widely accepted reductive amination chemistry26, 27 and may later be modified for use with 13C, 15N isotopes or to incorporate affinity handles. The modules are connected with amide bonds that are less labile than glycosidic bonds and are unlikely to fragment under conditions used for glycan tandem MS. They incorporate a fluorophore useful for UV or fluorescence based detection and absolute quantification. Three distinct modules create four different isotopic variations of the tags.
Distinct, equivalent and robust modules preserve the isotopic information throughout the analysis process. The points of isotopic incorporation in each module are illustrated in Scheme 1, where each deuterium is directly bound to the carbon atoms highlighted in green (+4), red (+8), and blue (+12). Incorporation of an aromatic amine allows for the facile detection of carbohydrates that generally lack strong UV absorbance, secondly it provides a reactive group necessary to introduce the tag to the reducing end of glycans using well established reductive amination protocols,28 where each carbohydrate will be labeled under mild conditions that have been shown to produce high reductive amination yields with minimal side reactions.28 An increase in the hydrophobicity was also desirable as this has been shown to increase the ability of carbohydrates to ionize.29 The incorporation of charged moieties to the tag was considered undesirable as it would be expected to alter the glycan product ion patterns and may be more likely to undergo partial or complete loss of the tag. The final considerations were ease of synthesis, expense, and availability of isotopically-enriched starting materials. The design requires that at least two pieces of the tag be bifunctional for the incorporation of additional modules of the tag. The use of bifunctional modules allows for the propagation of the tag to the desired length and isotopic content, as well as the ability to perform the synthesis using a solid support.
The present work describes the application of tetraplex glycomics tags to glycosaminoglycan and N-linked oligosaccharides. A reference glycan mixture is labeled with the light form of the tag and three unknown glycan mixtures are labeled with the heavy forms. The MS dimension of tagged tetraplex glycan mixtures determines the monosaccharide compositions of the ions and their quantities relative to the standard mixture. Each ion in the MS mode reflects a mixture of isobaric glycoforms. The abundances of tandem mass spectrometric product ions reflect the glycoforms that compose each precursor ion. Thus, the tandem mass spectra provide a means of following the expression of glycoform fine structure as a function of biological change. For glycan classes where well-defined standards exist, the product ion abundances determine the glycoform mixture percentages. Fragmentation characteristics of glycoconjugate glycans vary significantly based on compound class. In particular, the presence of acidic functional groups strongly influences product ion pattern.30, 31 The tags were therefore tested on neutral, sialylated, and sulfated glycan classes.
Experimental
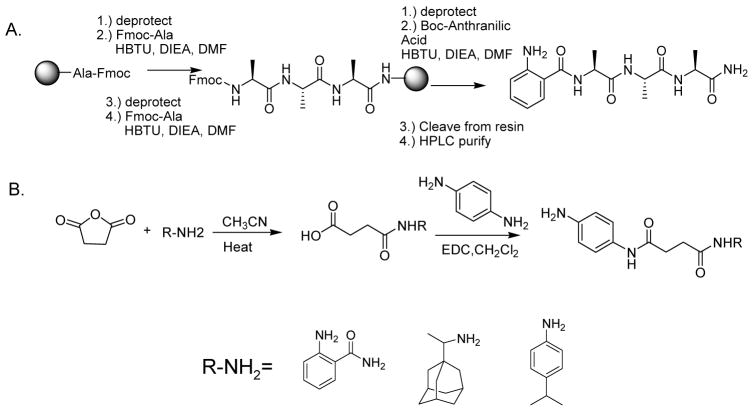
Tags consisting of amino acid modules (2–5) were synthesized using standard solid phase methodologies, in high yield and purity (Scheme 2A and supplemental information). Tags (6–8) lacking a resin attachment point within their structure were synthesized using a solution phase approach (Scheme 2B and supplemental information). Nucleophilic attack of an amine on a succinic anhydride provides a monofunctional intermediate that is then reacted with benzene diamine to yield the desired products. The starting materials were purchased commercially with the desired isotopic content, see supplemental information for details. For testing purposes, tags (2–8) were synthesized in +0 form. After testing, tag 3 was synthesized in four stable deuterated forms (+0, +4, +8, +12).
Scheme 2.
A.) Solid-phase synthetic scheme for compounds 2–5. B.) Solution phase synthetic scheme for compounds 6–8
Chondroitin sulfate (CS) types A, B, and C were partially depolymerized using chondroitinase ABC and the oligomers fractionated using high performance size exclusion chromatography (SEC) as previously described.17 CS oligosaccharides types A, B, and C were reductively aminated with synthesized compounds 2–8, as well as anthranilic acid (1), for detailed procedures see supplemental information. The derivatized CS oligosaccharides were purified using a cellulose micro-spin cartridge as previously described.17
The N-linked glycans of fetuin, in 100, 200, 300, and 400 pmol quantities, were released by enzymatic treatment with N-Glycanase® (PROzyme, San Leandro, CA), in triplicate, according to the protocol provided by the manufacturer. An aliquot was removed and used to confirm glycan release by SDS-PAGE. The detergent, buffer, and protein components of the resultant digests were removed by solid phase extraction using porous graphitized carbon columns (500 mg packing material, Thermo Fisher Scientific, Waltham, MA). The glycan containing fraction was derivatized with stable isotopically labeled tags, excess tag was removed by chloroform extraction, followed by C18 chromatography in a spin column format. The resultant labeled fraction was introduced by nanospray ionization using a QSTAR mass spectrometer, for detailed procedures see supplemental information.
Identical conditions for derivatization were used for all tags and glycans and the resulting data incorporates additional factors, such as labeling efficiency, sample recovery from cleanup and chromatography, and ionization efficiency. No appreciable quantity (<5%) of unlabeled material was observed in the mass spectrum. Detailed procedures can be found in the supplemental information. This is consistent with published results demonstrating high yields using reductive amination chemistry.28
Oligosaccharides were analyzed using a quadrupole orthogonal time-of-flight (Q-oTOF) mass spectrometer (Applied Biosystems/MDS Sciex Qstar/Pulsar i) using nanospray32 ionization. Nanospray tip position was monitored using a pair of cameras and a grid on the video display to maintain the distance, angle, and alignment of the tip. Optimized conditions for the analysis of glycosaminoglycans were used for mass spectral analysis. Fragmentation of the resultant tagged glycans was also determined, using consistent collision energy (CAD=2, CE= −20), to determine the stability and fragmentation patterns of the tag incorporated glycans.
Results and Discussion
A series of glycomics tags were designed that incorporate stable isotope modules into the oligosaccharide structure. The design allows for the construction of four chemically identical tags differing only in the isotopic content within the labeling agent. Additional features incorporated into the design were UV active groups to allow for spectrophotometric detection, cost effectiveness, commercial availability of starting materials, and ease of synthesis. Of the potential candidates, seven compounds (2–8) fitting these criteria were synthesized and tested for viability in a mass spectrometric experiment by labeling glycan preparations.
Glycosaminoglycans are linear biopolymers and the CS class consists of repeating disaccharide units of N-acetyl-galactosamine and hexuronic acids, with some variations in the structural elements. They exist primarily in three forms: CSA, (GlcAβ3GalNAc4Sulfateβ4)n, CSB (IdoAα3GalNAc4Sulfateβ4)n and CSC, (GlcAβ3GalNAc6Sulfate)n. Variations in the quantities of each CS type have been implicated in disease states, such as osteoarthritis.33 Intact glycosaminoglycans are too large and heterogeneous to analyze, therefore they are enzymatically depolymerized into smaller chain lengths for analysis. Chondroitin lyase enzymes cleave CS chain N-acetylgalactosamine bonds using an eliminative mechanism to produce a 4,5-unsaturated (Δ-unsaturated) uronic acid on the non-reducing terminus of the products. The Δ-unsaturation creates a unique chromophore, allowing monitoring of the reaction at a wavelength of 232 nm. This chromophore also allows for the quantitative comparison of native and labeled glycosaminoglycans. A typical reaction is stopped at 30% digestion, as this sufficiently reduces the complexity of the system, while still providing a distribution of larger oligomers containing the structural information necessary for determination of the glycoforms present.
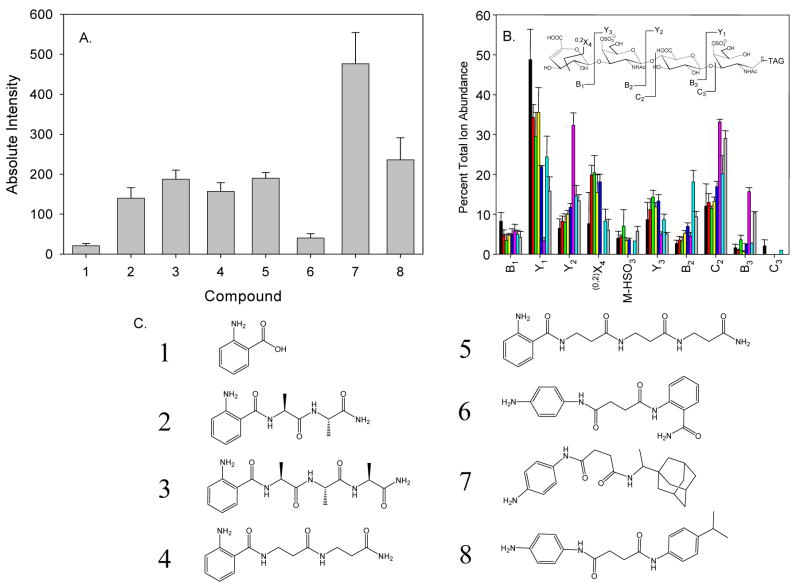
As shown in Fig. 1A, dp4 oligosaccharides derived from CSA labeled with the commonly used glycan label 1 showed a relatively weak signal in comparison to the other tags. There is an increase in ionization as the tags become larger and more hydrophobic from 2-fold (compound 6) to between 10- (compounds 2–5, 8) and 30- (compound 7)- fold. Similar trends for each tag were observed in labeled preparations of CSB and CSC (data not shown). The product ion percent total ion abundances for tagged CSA dp4 oligosaccharides are shown in Fig. 1B. All 8 tags are stable to MS and tandem MS conditions and glycan fragmentation results in the observed product ions. The incorporation of the different tags on the standard glycans showed some differences in the fragmentation patterns observed. The use of uncharged tags (2–8) in place of anthranilic acid (1) show a 2-fold reduction in the presence of the B1 ions (for CSA, CSB, and CSC) as well as the C3 ion (not detected). In addition, 0,2X3 cross-ring cleavage is observed for all tags except 6, where no cross-ring cleavage was observed for all three glycoforms. In the case of compound 6, there was a drastic increase in the abundance of C2, Y2, and B3 ions observed, with concomitant decrease of the Y1 ion. Tags (2–5, 7–8) have suitable fragmentation patterns for use in a tandem MS experiment to gain more structural and quantitative information about the glycan analyte from the fragments that contain the reducing end of the carbohydrate. Compound 3 was chosen for further investigations based on a balance of mass spectrometric performance and relatively low cost of synthetic precursors.
Figure 1.
A. Nanospray ion abundances for 600 pmol (diluted to 5 pmol/μl) CSA dp4 labeled with tags 1–8. B. Comparison of tandem mass spectrometric product ion abundances for CSA dp4 labeled with tags 1–8. (1-Black, 2-Red, 3-Green, 4-Yellow, 5-Blue, 6-Pink, 7-Cyan, 8-Gray) C. Structures of anthranilic acid (1) and compounds 2–8.
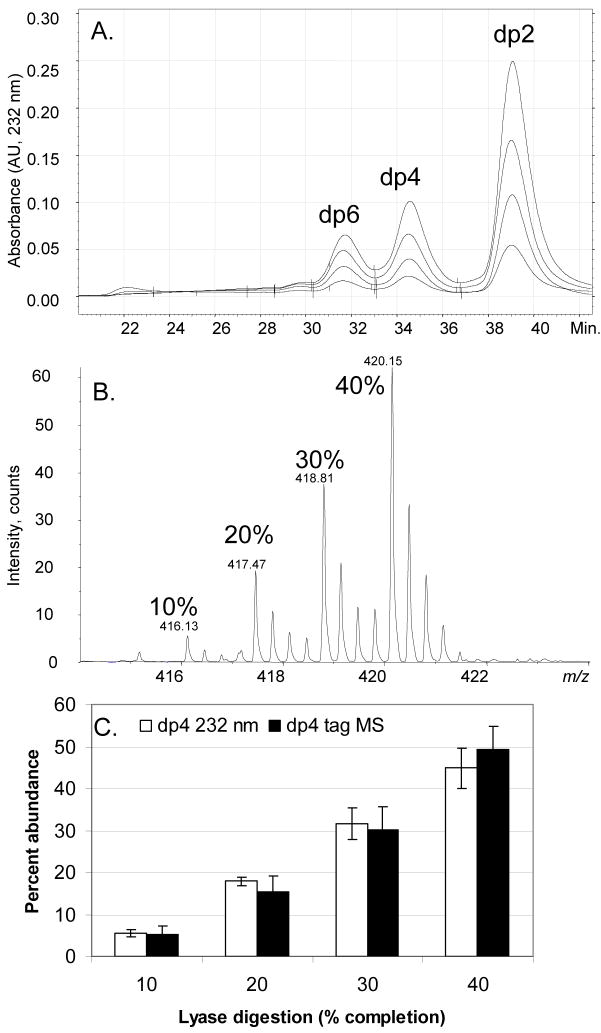
The usefulness of the tetraplex tag was demonstrated first using four different variations in the extent of enzymatic depolymerization of CS mixtures, as determined by 232 nm absorbance. A 10% digestion was labeled with d0, a 20% digestion was labeled with d4, a 30% digestion with d8, and a 40% digestion was labeled with d12. The SEC chromatograms (Fig. 2A) show the relative abundances of the dp2, 4 and 6 oligosaccharide products. Fig. 2B shows the mass spectrometric ion abundances of the d0-, d4-, d8-, and d12-tagged dp4 oligosaccharides. As shown in Fig. 2C, the isotopic tagging procedure produces results comparable with direct measurement of dp4 concentration from absorbance values.
Figure 2.
A. High performance SEC of a CSA:CSB:CSC (1:1:1) mixture enzymatically depolymerized to varied percentages, monitored at 232 nm. B. Mass spectral data of a dp4 fraction of four CSA:CSB:CSC (1:1:1) digestions to various levels of completion labeled with tetraplex tags (10% completion d0, 20% completion d4, 30% completion d8, 40% completion d12). C. Comparison of UV data of the native dp4 digestion product from SEC-HPLC and tetraplex tagged dp4 fractions from digestion replicates by MS.
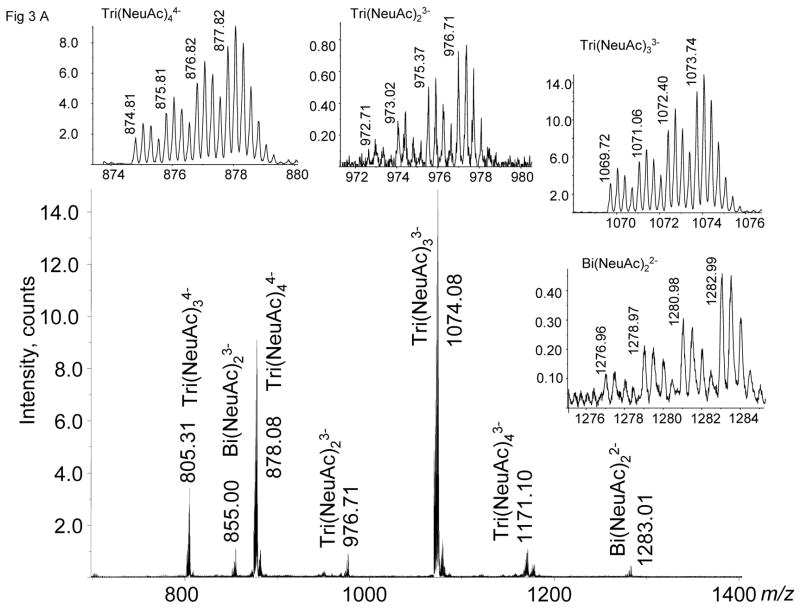
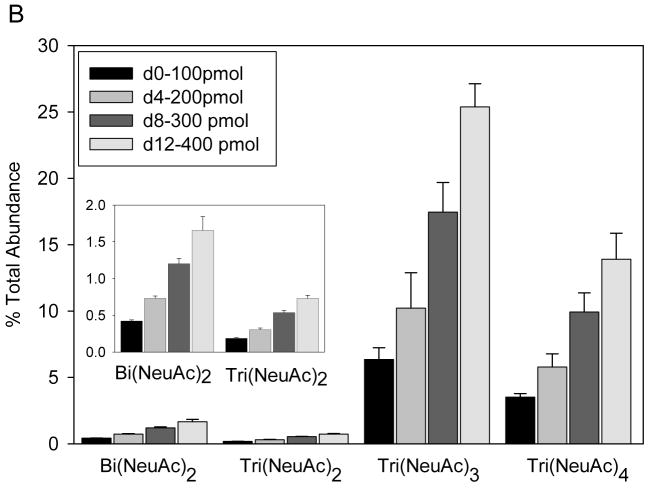
To demonstrate the utility of the tags for quantitation of N-linked glycans, fetuin was treated with N-Glycanase®. The released and isolated glycans were labeled with tag 3 and quantified using mass spectrometry. Quantities of starting glycoprotein 100 pmol, 200 pmol, 300 pmol, and 400 pmol were labeled with d0, d4, d8, and d12, respectively. As shown in Fig. 3A, tagged N-linked glycans are detected in four different isotopic forms, the ion abundances of which determine the quantity of each composition relative to the d0-tagged glycans. The insets show expanded m/z ranges for Bi(NeuAc)22− (1276–84), Tri(NeuAc)23− (972–80), Tri(NeuAc)33− (1070–76), and Tri(NeuAc)44− (874–80). Fig. 3B graphically illustrates the ion abundances for the four glycan compositions determined for the d0, d4, d8 and d12 glycan mixtures. These data demonstrate the reproducible and quantitative nature of the tagging procedure for determining N-linked glycan compositions relative to a d0-tagged internal standard. More complex glycan mixtures from biological samples may have overlapping clusters, thereby complicating data interpretation; the use of an on-line LC/MS system should be employed.
Figure 3.
A. Negative ion nanospray MS of four tetraplex labeled releases of N-linked glycans from bovine fetuin in quantities of 100, 200, 300, and 400 pmol glycoprotein quantities labeled with d0, d4, d8, d12, respectively. B. Comparison of MS ion abundances from N-linked glycans from triplicate releases of labeled fetuin samples.
The previous examples demonstrate the ability to quantitate relative differences between samples based on composition. As many glycan isomers can contribute to each composition, it is beneficial to utilize labeled glycans for tandem mass spectrometric experiments to determine the isomeric contributions for each composition.
Ions observed in the MS mode reflect mixtures of isobaric glycoforms, the compositions of which may be performed using stages of tandem MS. In these experiments, all four isotopic variants were isolated using a 10 u window. The following experiment demonstrates that equal responses result for all four isotopes. Chondroitinase ABC was used to depolymerize separate samples of CSA, CSB, and CSC, to 30% completion. Samples containing equivalent amounts of CSA oligosaccharides were labeled with all four isotopic tags and analyzed using tandem MS; CSB and CSC samples were also prepared and analyzed. A 10 u wide window was used to select all four isotopic forms of the tagged ions, in the 2- charge state, to ensure the complete isolation of each parent ion. The results demonstrate that the product ion abundances are consistent across the four isotopic variants for CSA. Similar results were obtained using the CSB and CSC subclasses. Relative abundances for product ions from three replicates of the entire procedure are as follows: CSA y1: 0.442 ± 0.025; y3: 0.235 ± 0.009; [M-H-SO3]: 0.305 ± 0.019; CSB y1: 0.077 ± 0.013; y3: 0.510 ± 0.025; [M-H-SO3]: 0.412 ± 0.019; CSC y1: 0.206 ± 0.016; y3: 0.048 ± 0.008; [M-H-SO3]: 0.750 ± 0.011.
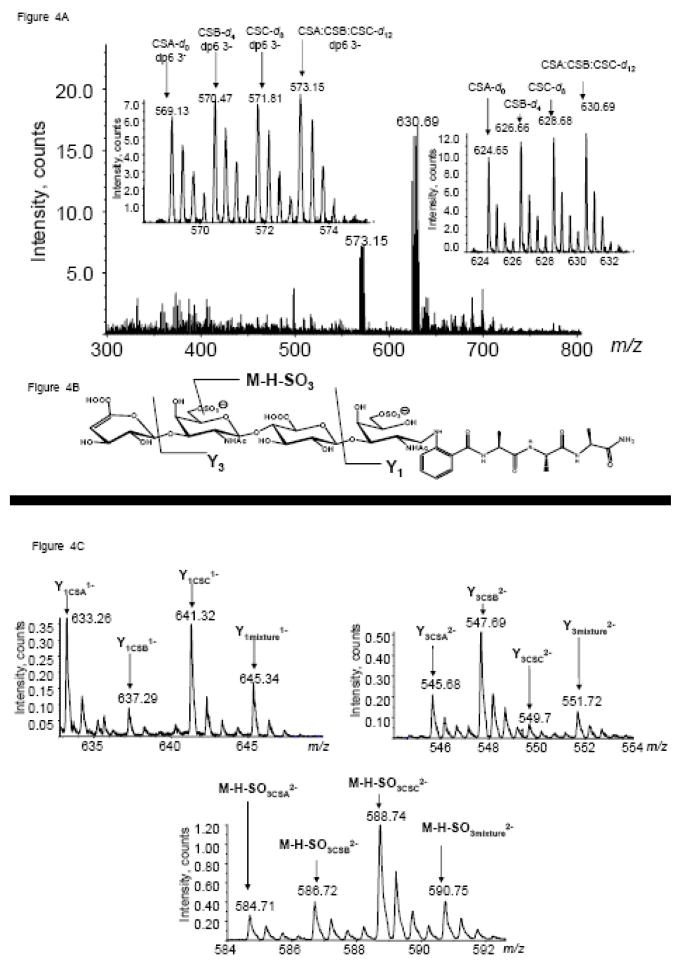
The glycomics tags facilitate analysis of isobaric glycoforms, as shown in Fig. 4. To aid in visualization of the distinct differences in isomeric fragmentation, samples were labeled with +0 (CSA), +4 (CSB), +8 (CSC), and +12 tags (1:1:1 of CSA:CSB:CSC). Tandem mass spectral analysis of each type of chondroitin allows for the assignment of diagnostic ions for each type of chondroitin. In cases where standards exist, the distinctive fragmentation patterns can be determined which allows for the quantitation of isomeric analytes. Using equations based on the patterns of fragmentation for each class of chondroitin one can solve for the amount of each class present in a sample.17, 34–37 Fig. 4A shows a typical mass spectrum of a tagged mixture of CS oligosaccharides. The peak cluster from m/z 624–630 corresponds to the four tagged forms of CS dp4. The MS ion intensities define the quantity of the +4, +8 and +12 relative to the +0 form. All four forms were isolated in a single window and subjected to tandem MS. The Y1 ion is diagnostic for CSA-repeats, the Y3 for CSB and the M-H-SO3 for CSC.17, 37 The intensities of each of the four isotopic forms for these product ions are shown in Fig. 4C. These product ion intensities were used to determine the CSA:CSB:CSC mixture percentages using a system of linear equations. The system has been previously used for the compositional analysis of glycosaminoglycans using electrospray ionization quadrupole ion trap mass spectrometry17, 34–36 and Q-oTof mass spectrometry.37 Using the values from the pure standards and experimentally determined values from various mixtures, performed in triplicate within each analysis, it is possible to determine CS glycoform mixture percentages in unknown samples.
Figure 4.
A. Mass spectrum of d0- CSA, d4- CSB, d8- CSC, d12- (1:1:1 CSA:CSB:CSC) dp4 fraction from SEC-HPLC. B. Structure and diagnostic fragmentation pattern of labeled CSC-dp4. C. Tandem MS of d0- CSA, d4- CSB, d8- CSC, d12- (1:1:1 CSA:CSB:CSC) dp4 fraction.
In the present experiments, unknown samples were run in triplicate using the +4, +8, and +12 tags using +0 CSA standard oligosaccharides as internal standards. The final isomer percentages were determined by averaging the three isotopic variations (d4, d8, d12) of each mixture and the standard deviation is representative of the total experimental error from digestion through mass spectral analysis. By inclusion of a constant CSA internal standard (d0), it is possible to determine the absolute quantity of sample present in the mixtures, as well as verify the operation of the mass spectrometer via any variation of the fragmentation pattern. The results for a series of CS oligosaccharide mixtures made post-enzyme digestion are shown in Table 1A. The results demonstrate the high level of reproducibility from analysis of experimental replicates using the isotopic tags. The coefficients of variation are within 10% of the measured value for all compositions greater than 30%. This low degree of variation enables the determination of biologically-produced change in CS structure while minimizing the number of experimental subjects required for statistical significance.
Table 1.
A. Percentages of CSA, CSB, and CSC present in the dp4 fraction of a 30% depolymerization prepared mixtures after digestion and labeling. B. Percentages of CSA, CSB, and CSC present in the dp4 fraction of 1:1:1 CSA:CSB:CSC mixtures prepared prior to digestion and labeling.
| A. Mixture
CSA:CSB:CSC |
Percentage
CSA |
Percentage
CSB |
Percentage
CSC |
|
|---|---|---|---|---|
| 1:1:0 | 49.9 ± 1.1 | 46.0 ± 3.8 | 4.1 ± 2.8 | |
| 1:0:1 | 54.0 ± 1.5 | 2.6 ± 2.0 | 43.4± 2.5 | |
| 0:1:1 | 3.1 ± 1.7 | 50.0 ± 2.6 | 46.8 ± 2.1 | |
| 1:1:1 | 32.0 ± 2.4 | 30.5 ± 4.4 | 37.3 ± 3.1 | |
| 2:1:1 | 54.7 ± 4.0 | 23.3 ± 4.2 | 21.9 ± 3.2 | |
| 1:2:1 | 24.1 ± 5.1 | 49.4 ± 2.9 | 26.5 ± 3.2 | |
| 1:1:2 | 26.6 ± 5.1 | 24.5 ± 5.4 | 48.9 ± 3.6 | |
| B. Digestion with Chondroitinase
ABC |
Digestion Completion | Percentage
CSA |
Percentage
CSB |
Percentage
CSC |
| 1:1:1 A:B:C | 10% | 62.8 ± 2.2 | 13.3 ± 1.5 | 24.1 ± 0.6 |
| 1:1:1 A:B:C | 20% | 59.0 ± 2.1 | 22.2 ± 1.4 | 18.8 ± 1.2 |
| 1:1:1 A:B:C | 30% | 30.7 ± 3.4 | 29.2 ± 4.7 | 40.1 ± 4.1 |
| 1:1:1 A:B:C | 40% | 34.8 ± 4.5 | 26.3 ± 2.4 | 38.9 ± 3.1 |
Table 1B shows results for analysis of mixtures of CS chains made before the enzymatic digestion. The results show that the chondroitinase ABC enzyme cleaves CSA faster, as evidenced by the high percent of this isoform in the 10% digest. CSB appears to be cleaved slowest among the three glycoforms. As the percent of digestion increases, the distribution of dp4 glycoforms approaches the expected 1:1:1 ratio. In order to digest the CSB and CSC classes more evenly, it will be necessary to add chondroitinase B and ACI to the digestion mixture. These results are useful for deriving a balance of chondroitinase enzymes that digest all types of CS evenly.
In the current study the lowest detection limits of labeling and recovery were not determined, in part due to the multiple steps of purification necessary for nanospray. An expected improvement in the limit of detection will come from the development of a LC/MS system capable of removing excess tag and reductive amination salts, thereby eliminating the need for multiple sample preparation steps necessary for compatability with nanospray analysis. This point is currently under further investigation.
Conclusions
Glycoconjugate glycans released from any animal source consist of mixtures of glycoforms including a large number of structural isomers. It is imperative that analytical methods be available to determine the compositions of such mixtures directly. Accordingly, stable isotope labeled glycomics tags were developed in this work to facilitate reproducible and accurate determination of glycoform mixture compositions. The tags were developed for use with widely accepted reductive amination chemistry to achieve derivatization in high yield. They produce quantitative results for four samples simultaneously, and facilitate the inclusion of internal performance standards. For CS oligosaccharides, standards with known glycoform composition are available and tandem mass spectrometry of tagged mixtures allows determination of mixture percentages of some structural isomers. For N-linked glycans, the tags enable precise comparison of glycoform expression among different samples. For this glycan class, the MS data show changes in composition, reflected by the ion abundances relative to those of the standard mixture. Tandem MS will be useful for comparing the glycoform mixtures that make up a given composition to that for the standard mixture. Preliminary results of neutral glycans, released high mannose glycans of RNaseB and heptamaltose, indicate that glycans labeled with 3 can be ionized by MALDI without fragmentation of the tag; however further studies are necessary to determine the effect of tagging on the ionization.
Supplementary Material
Synthesis of compounds 2–8, preparation of glycosaminoglycan digestions, N-linked glycoprotein release protocols, labeling protocols, and mass spectrometry conditions are available.
Acknowledgments
This work was funded by NIH grants P41RR10888 and R01HL74197.
Abbreviations
- ACN
Acetonitrile
- CID
collision-induced dissociation
- CS
chondroitin sulfate
- CSA
chondroitin sulfate type A
- CSB
chondroitin sulfate type B
- CSC
chondroitin sulfate type C
- ddH2O
MilliQ water (18MΩ)
- DIEA
diisopropylethyl amine
- DMF
Dimethyl formamide
- dp
degree of polymerization
- EDC
N-(3-Dimethylaminopropyl)-N′-ethylcarbodiimide hydrochloride
- ESI
electrospray ionization
- Fmoc
9-Fluorenylmethoxycarbonyl
- HBTU
(O-(Benzotriazol-1-yl)-N,N,N′,N′-tetramethyluronium hexafluorophosphate)
- HOBt
1-Hydroxybenzotriazole LC liquid chromatography
- MC
Methylene Chloride
- MeOH
methanol
- MS
mass spectrometry
- PG
proteoglycan
- SEC
size-exclusion chromatography
- TIPS
Triisopropyl silane
- TFA
Trifluoracetic acid
References
- 1.Apweiler R, Hermjakob H, Sharon N. Biochim Biophys Acta. 1999;1473:4–8. doi: 10.1016/s0304-4165(99)00165-8. [DOI] [PubMed] [Google Scholar]
- 2.Iozzo RV. Annu Rev Biochem. 1998;67:609–652. doi: 10.1146/annurev.biochem.67.1.609. [DOI] [PubMed] [Google Scholar]
- 3.Helenius A, Aebi M. Science. 2001;291:2364–2369. doi: 10.1126/science.291.5512.2364. [DOI] [PubMed] [Google Scholar]
- 4.Varki A, Cummings R, Esko J, Freeze H, Hart G, Marth J. Proteoglycans and Glycosaminoglycans, in Essentials of Glycobiology. Cold Spring Harbor Press; Plainview, NY: 1999. [Google Scholar]
- 5.Conrad H. Heparin Binding Proteins. Academic Press; New York: 1998. [Google Scholar]
- 6.Smith AE, Helenius A. Science. 2004;304:237–242. doi: 10.1126/science.1094823. [DOI] [PubMed] [Google Scholar]
- 7.Marsh M, Helenius A. Cell. 2006;124:729–740. doi: 10.1016/j.cell.2006.02.007. [DOI] [PMC free article] [PubMed] [Google Scholar]
- 8.Caffaro CE, Hirschberg CB. Acc Chem Res. 2006;39:805–812. doi: 10.1021/ar0400239. [DOI] [PubMed] [Google Scholar]
- 9.Haslam SM, North SJ, Dell A. Curr Opin Struct Biol. 2006;16:584–591. doi: 10.1016/j.sbi.2006.08.006. [DOI] [PubMed] [Google Scholar]
- 10.Dwek MV, Brooks SA. Curr Cancer Drug Targets. 2004;4:425–442. doi: 10.2174/1568009043332899. [DOI] [PubMed] [Google Scholar]
- 11.Harvey DJ. Expert Rev Proteomics. 2005;2:87–101. doi: 10.1586/14789450.2.1.87. [DOI] [PubMed] [Google Scholar]
- 12.Yu Y, Sweeney MD, Saad OM, Crown SE, Hsu AR, Handel TM, Leary JA. J Biol Chem. 2005;280:32200–32208. doi: 10.1074/jbc.M505738200. [DOI] [PubMed] [Google Scholar]
- 13.Saad OM, Ebel H, Uchimura K, Rosen SD, Bertozzi CR, Leary JA. Glycobiology. 2005;15:818–826. doi: 10.1093/glycob/cwi064. [DOI] [PubMed] [Google Scholar]
- 14.Zhang J, Xie Y, Hedrick JL, Lebrilla CB. Anal Biochem. 2004;334:20–35. doi: 10.1016/j.ab.2004.07.012. [DOI] [PubMed] [Google Scholar]
- 15.Madera M, Mechref Y, Klouckova I, Novotny MV. J Chromatogr B Analyt Technol Biomed Life Sci. 2007;845:121–137. doi: 10.1016/j.jchromb.2006.07.067. [DOI] [PubMed] [Google Scholar]
- 16.Yuan J, Hashii N, Kawasaki N, Itoh S, Kawanishi T, Hayakawa T. J Chromatogr A. 2005;1067:145–152. doi: 10.1016/j.chroma.2004.11.070. [DOI] [PubMed] [Google Scholar]
- 17.Hitchcock AM, Costello CE, Zaia J. Biochemistry. 2006;45:2350–2361. doi: 10.1021/bi052100t. [DOI] [PMC free article] [PubMed] [Google Scholar]
- 18.Hsu J, Chang SJ, Franz AH. J Am Soc Mass Spectrom. 2006;17:194–204. doi: 10.1016/j.jasms.2005.10.010. [DOI] [PubMed] [Google Scholar]
- 19.Lill J. Mass Spectrom Rev. 2003;22:182–194. doi: 10.1002/mas.10048. [DOI] [PubMed] [Google Scholar]
- 20.Ong SE, Mann M. Nat Chem Biol. 2005;1:252–262. doi: 10.1038/nchembio736. [DOI] [PubMed] [Google Scholar]
- 21.Gygi SP, Rist B, Gerber SA, Turecek F, Gelb MH, Aebersold R. Nat Biotechnol. 1999;17:994–999. doi: 10.1038/13690. [DOI] [PubMed] [Google Scholar]
- 22.Zhang R, Sioma CS, Wang S, Regnier FE. Anal Chem. 2001;73:5142–5149. doi: 10.1021/ac010583a. [DOI] [PubMed] [Google Scholar]
- 23.Borisov OV, Goshe MB, Conrads TP, Rakov VS, Veenstra TD, Smith RD. Anal Chem. 2002;74:2284–2292. doi: 10.1021/ac010974p. [DOI] [PubMed] [Google Scholar]
- 24.Hansen KC, Schmitt-Ulms G, Chalkley RJ, Hirsch J, Baldwin MA, Burlingame AL. Mol Cell Proteomics. 2003;2:299–314. doi: 10.1074/mcp.M300021-MCP200. [DOI] [PubMed] [Google Scholar]
- 25.Li J, Steen H, Gygi SP. Mol Cell Proteomics. 2003;2:1198–1204. doi: 10.1074/mcp.M300070-MCP200. [DOI] [PubMed] [Google Scholar]
- 26.Anumula KR. Anal Biochem. 2000;283:17–26. doi: 10.1006/abio.2000.4645. [DOI] [PubMed] [Google Scholar]
- 27.Anumula KR. Anal Biochem. 2006;350:1–23. doi: 10.1016/j.ab.2005.09.037. [DOI] [PubMed] [Google Scholar]
- 28.Bigge JC, Patel TP, Bruce JA, Goulding PN, Charles SM, Parekh RB. Anal Biochem. 1995;230:229–238. doi: 10.1006/abio.1995.1468. [DOI] [PubMed] [Google Scholar]
- 29.Harvey DJ. J Am Soc Mass Spectrom. 2000;11:900–915. doi: 10.1016/S1044-0305(00)00156-2. [DOI] [PubMed] [Google Scholar]
- 30.Seymour JL, Costello CE, Zaia J. Journal of the American Society for Mass Spectrometry. 2006;17:844–854. doi: 10.1016/j.jasms.2006.02.022. [DOI] [PMC free article] [PubMed] [Google Scholar]
- 31.Zaia J, Miller MJC, Seymour JL, Costello CE. 2006 submitted. [Google Scholar]
- 32.Wilm MS, Mann M. Int J Mass Spectrom Ion Processes. 1994;136:167–180. [Google Scholar]
- 33.Shinmei M, Miyauchi S, Machida A, Miyazaki K. Arthritis Rheum. 1992;35:1304–1308. doi: 10.1002/art.1780351110. [DOI] [PubMed] [Google Scholar]
- 34.Desaire H, Leary JA. J Am Soc Mass Spectrom. 2000;11:916–920. doi: 10.1016/S1044-0305(00)00168-9. [DOI] [PubMed] [Google Scholar]
- 35.Desaire H, Leary JA. J Am Soc Mass Spectrom. 2000;11:1086–1094. doi: 10.1016/S1044-0305(00)00179-3. [DOI] [PubMed] [Google Scholar]
- 36.Saad OM, Leary JA. Anal Chem. 2003;75:2985–2995. doi: 10.1021/ac0340455. [DOI] [PubMed] [Google Scholar]
- 37.Miller MJ, Costello CE, Malmstrom A, Zaia J. Glycobiology. 2006;16:502–513. doi: 10.1093/glycob/cwj093. [DOI] [PMC free article] [PubMed] [Google Scholar]
Associated Data
This section collects any data citations, data availability statements, or supplementary materials included in this article.
Supplementary Materials
Synthesis of compounds 2–8, preparation of glycosaminoglycan digestions, N-linked glycoprotein release protocols, labeling protocols, and mass spectrometry conditions are available.


