

Abstract
Context
Antiretroviral therapy can be associated with visceral adiposity and metabolic complications, increasing cardiovascular risk, and reduced growth hormone (GH) secretion may be a contributing factor.
Objective
To investigate the effects of low-dose physiological GH administration on body composition, glucose, and cardiovascular parameters in patients with human immunodeficiency virus (HIV) having abdominal fat accumulation and relative GH deficiency.
Design, Setting, and Patients
A randomized, double-blind, placebo-controlled trial of 56 patients with HIV, abdominal fat accumulation, and reduced GH secretion (peak GH <7.5 ng/mL) conducted at a US academic medical center between November 2003 and October 2007.
Intervention
Patients were randomly assigned to receive either subcutaneous GH or matching placebo titrated to the upper quartile of normal insulinlike growth factor 1 (IGF-1) range for 18 months. Starting dose was 2 μg/kg/d and increased to maximum dose of 6 μg/kg/d (average dose, 0.33 mg/d).
Main Outcome Measures
Change in body composition assessed by computed tomographic scan and dual-energy x-ray absorptiometry. Secondary outcomes included glucose, IGF-1, blood pressure (BP), and lipids. Treatment effect was the difference in the change between GH and placebo groups, using all available data.
Results
Fifty-five patients (26 with GH and 29 with placebo) were included in the safety analyses and 52 patients (25 with GH and 27 with placebo) were included in the efficacy analyses. Visceral adipose tissue area (treatment effect [last-value-carried-forward analysis {n=56}, -19 cm2; 95% confidence interval {CI}, -37 to -0.3 cm2], -19 cm2; 95% CI, -38 to -0.5 cm2; P=.049); trunk fat (-0.8 kg; 95% CI, -1.5 to -0.04 kg; P=.04); diastolic BP (-7 mm Hg; 95% CI, -11 to -2 mm Hg; P=.006); and triglycerides (-7 mg/dL, P=.002) improved but 2-hour glucose levels on glucose tolerance testing increased in the GH group vs the placebo group (treatment effect, 22 mg/dL; 95% CI, 6-37 mg/dL; P=.009). The IGF-1 levels increased (treatment effect, 129 ng/mL; 95% CI, 95-164 ng/mL; P<.001). Adverse events were not increased for GH vs placebo (23%; 95% CI, 9%-44% vs 28%; 95% CI, 13%-47%; P=.70).
Conclusions
In HIV-associated abdominal fat accumulation and relative GH deficiency, low-dose GH received for 18 months resulted in significantly reduced visceral fat and truncal obesity, triglycerides, and diastolic BP, but 2-hour glucose levels on glucose tolerance testing were increased.
Patients with human immuno-deficiency virus (HIV) infection treated with antiretroviral therapy frequently develop changes in body composition including abdominal obesity and metabolic complications of dyslipidemia and insulin resistance, predisposing this patient population to increased cardiovascular risk.1 Growth hormone (GH) secretion is reduced in patients with HIV and abdominal fat accumulation2,3; and relative GH deficiency (GHD), based on response to GH-releasing hormone (GHRH) plus arginine testing, is observed in approximately one-third of such patients.3 Relative GHD is common among patients with HIV and lipodystrophy and is observed most often in men with HIV and abdominal fat accumulation. The proportion of patients with HIV and relative GHD was shown to range from 37% to 39% among men and to be 16% among women with abdominal fat accumulation, based on responses to GHRH plus arginine testing of 7.5 ng/mL in prior studies.3,4
In patients not infected with HIV but having GHD, fat mass, particularly visceral fat,5,6 lipid levels,7,8 and cardiovascular disease rates9 are increased, and GH administration significantly improves body composition with reduction in visceral fat,6,10 cholesterol level,6,11-13 and inflammatory markers.13 Patients with GHD are often insulin resistant,14,15 and long-term GH therapy can potentially improve glucose homeostasis despite an initial deterioration of insulin sensitivity.16-18
Among patients with HIV and abdominal obesity, treatment with supraphysiological doses of GH (2-4 mg/d) during 12 weeks decreased visceral fat but was associated with significant GH-related adverse events, including peripheral edema, arthralgias, and increased blood glucose.19,20 In a small, open-label pilot study of men with HIV and fat accumulation,21 lower doses of GH (1 mg) over 6 months decreased truncal fat. In our study, we identified patients with HIV, abdominal fat accumulation, and relative reduction in GH secretion, a group that is likely to benefit from GH administration. We determined whether low-dose physiological GH would improve body composition, lipids, and other metabolic parameters and be safely tolerated in this group in an 18-month randomized, double-blind, placebo-controlled trial.
METHODS
Participants
Patients with HIV and evidence of lipodystrophy were recruited to the study, which was conducted at Massachusetts General Hospital via community advertisement, HIV support and advocacy groups, and infectious disease or primary care physician referral, between November 2003 and March 2006. The last patient finished the 18-month visit in October 2007. Inclusion criteria included (1) ages 18 to 60 years; (2) previously diagnosed HIV infection; (3) stable antiretroviral regimen for at least 12 weeks before enrollment; (4) waist-to-hip ratio of more than 0.9 for men and more than 0.85 for women; (5) evidence of either increased abdominal girth, relative loss of fat in the extremities, or relative loss of fat in the face that occurred in the context of antiretroviral therapy; and (6) relative GHD, defined as stimulated peak GH response to GHRH plus arginine testing of less than 7.5 ng/mL (to convert to micrograms per liter, multiply by 1.0).3 Exclusion criteria included (1) use of GH, antidiabetic agents, megesterol acetate, or other anabolic agents within 3 months of enrollment; (2) diabetes mellitus; (3) a hemoglobin level of less than 9.0 g/dL (to convert to grams per liter, multiply by 10.0), a creatinine level of more than 1.4 mg/dL (to convert to micromoles per liter, multiply by 88.4), or a prostate-specific antigen level of more than 4 ng/mL (to convert to micrograms per liter, multiply by 1.0); (4) positive beta-human chorionic gonadotropin (beta-hCG); (6) carpal tunnel syndrome; and (7) active malignancy or history of malignancy. Participants with history of pituitary disease or radiation treatment were excluded. Men with documented hypogonadism on testosterone repletion therapy were permitted to participate and 29% of the participants were men receiving testosterone at baseline. Testosterone levels were not available for this study.
Race and ethnicity were determined by the participants using categories provided by the investigators. These data were collected because racial differences exist in outcome measures assessed, including visceral adipose tissue (VAT).22 A subset of patients represented in the screening data were examined in a prior study characterizing the role of sex and race in GH dynamics in patients with HIV infection.4 The study was approved and annually reviewed by the Massachusetts General Hospital institutional review board. Participants provided written informed consent and gave permission for the results of the study to be published.
Study Procedures
Following a 12-hour overnight fast, GH response to GHRH plus arginine stimulation, glucose and creatinine levels, complete blood cell count, prostate-specific antigen, urine pregnancy test, and anthropometric measurements were assessed at screening. Medical and antiretroviral history were obtained. Eligible participants returned for a baseline visit, followed by safety visits at 2 weeks and months 1, 3, 9, and 15, which consisted of assessment of fasting glucose, insulinlike growth factor 1 (IGF-1), interim history, physical examination, and urine beta-hCG. Interval assessment visits were performed at months 6, 12, and 18.
During the baseline visit and visits at months 6, 12, and 18, the following data were collected after a 12-hour overnight fast: (1) anthropometric measurements; (2) 75-g oral glucose tolerance test results; (3) levels of glucose, insulin, IGF-1, adiponectin, and hemoglobin A1c; lipid profile (total cholesterol, high-density lipoprotein [HDL] cholesterol, and triglyceride level); CD4 cell count; and HIV viral load level; (4) single-slice abdominal computed tomographic scan; (5) whole-body dual-energy x-ray absorptiometry scan; (6) Medical Outcomes Study HIV Health Survey (MOS-HIV) questionnaire data; (7) carotid ultrasound; and (8) urine beta-hCG.
An 18-month extension phase to determine the effects of GH withdrawal and to offer treatment to those patients receiving placebo followed the randomization phase. The primary analysis was performed after the initial 18-month period. Extension phase data will be available in June 2009.
Intervention, Randomization, and Blinding
After baseline testing was completed, participants were randomly assigned to receive either daily subcutaneous injections of recombinant human GH (Serostim; EMD Serono, Rockland, Massachusetts, an affiliate of Merck KGaA, Darmstadt, Germany) or identical placebo. Placebo was manufactured by EMD Serono. Randomization was performed by the Massachusetts General Hospital Research Pharmacy by using a permuted block algorithm with block sizes randomly varying from 4 to 8 and stratified by sex. The participants, study investigators, and study staff were blinded to randomization assignment.
The starting dose of study medication was 2 μg/kg/d and was titrated up to a maximum dose of 6 μg/kg/d. Dose titrations were performed at each visit after baseline, based on an algorithm to achieve IGF-1 in the upper quartile of the age-adjusted normal range, but not beyond the upper limit of normal. This algorithm was chosen to maximize GH dosing but keep it within the physiological range. Study investigators were blinded to IGF-1 results and dose recommendations were made by an independent physician. To maintain the blinded nature of the study, the physician monitoring the IGF-1 levels recommended a parallel change in a randomly selected patient treated with placebo for each change recommended in a patient treated with GH.
Participants received instruction on self-administration of the study medication by study investigators. Study drug administration was witnessed at the baseline visit to ensure proper technique. Adherence history as assessed by patient injection log was performed every 3 months.
Safety
Participants with fasting glucose of more than 200 mg/dL (to convert to millimoles per liter, multiply by 0.0555) during study participation were discontinued and participants with fasting glucose of more than 150 mg/dL underwent a 25% dose reduction. One participant in the placebo group with fasting glucose of more than 200 mg/dL was discontinued at the 2-week visit. In addition, 1 participant in the placebo group and 1 participant in the GH group underwent a 25% dose reduction due to fasting glucose of more than 150 mg/dL. A data and safety monitoring board (DSMB) met every 3 months to monitor adverse events in the study. The DSMB did not review efficacy data. All adverse events were reported to the DSMB and to the institutional review board according to institutional requirements.
GH Assessment
The cutoff of peak GH response to GHRH plus arginine of less than 7.5 ng/mL was used to define relative GHD because it achieved optimal discrimination between patients infected with HIV with lipodystrophy and abdominal fat accumulation and healthy controls of similar body mass index (BMI, calculated as weight in kilograms divided by height in meters squared) in a prior study.3
Outcome Measures
Body Composition Analysis
Abdominal VAT and subcutaneous adipose tissue (SAT) areas were assessed by cross-sectional abdominal computed tomographic scan as previously reported.23 Dual-energy x-ray absorptiometry was performed as previously described.23
Carotid Ultrasound
Carotid intima-media thickness (IMT) was assessed and analyzed every 6 months according to a standard protocol as previously reported.24
Biochemical Assays
Growth hormone concentration was measured by RIA (Corning Nichols, San Juan Capistrano, California). Before November 2005, IGF-1 was measured by chemiluminescence immunoassay (Nichols Institute, San Clemente, California). Due to a hospital-wide assay conversion, IGF-1 was measured by a chemiluminescent immunometric assay (DPC, Los Angeles, California) after November 2005. Internal crossvalidation demonstrated close correlation between assays (R2=0.94). Serum insulin levels were measured by RIA (DPC). Adiponectin was measured by RIA (Linco Research, St Charles, Missouri). The CD4 cell count was performed by using flow cytometry (Becton Dickinson Immunocytochemistry Systems, San Jose, California) and assessment of HIV viral load was conducted by using AMPLICOR HIV-1 Test (Roche Diagnostics, Indianapolis, Indiana), with lower limit of detection of 400 copies/mL. Lipid, hemoglobin A1c, and glucose levels were measured by using standard techniques at Massachusetts General Hospital.
Quality of Life
Quality of life was assessed by the MOS-HIV Health Questionnaire, where the score ranged from 0 to 100, with a higher number indicating better quality of life.25,26
Statistical Analysis
The primary end point of our study was change in body composition, measured as change in visceral fat (VAT) and secondarily as change in fat distribution (trunk to extremity fat). Sample size was calculated based on trunk-to-lower extremity fat ratio due to availability of published data for low-dose GH during 18 months in patients with GHD13 and lack of data on VAT using long-term physiological GH in patients with HIV. To detect a prespecified difference of 0.026 in change during 18 months in trunk-to-lower extremity fat ratio between the GH-treated group vs placebo-treated group with a 2-sided α=.05 and 90% power, a sample size of 45 patients was needed. The change in trunk-to-lower extremity fat ratio of 0.026 represented approximately 50% of the change observed in a prior long-term study of low-dose GH in patients not infected with HIV.13 A dropout rate of 20% to 25% was planned and 56 patients were recruited.
The safety and primary efficacy analyses were performed by using all available data, including partial data available in patients who discontinued the study. The safety population for whom safety, IGF-1, and glucose were evaluated included all participants (n=55) who received at least 1 dose of study drug. For efficacy, including VAT and secondary end points, the population (n=52) included all participants who had at least 1 postbaseline visit at 6 months, the first interim visit to assess efficacy. The per-protocol population consisted of all participants who completed the protocol (n=48). Completers and noncompleters were similar at baseline in demographics, body composition, IGF-1, triglycerides, and 2-hour glucose levels. The rates of any adverse event, serious adverse events, and GH-related adverse events did not differ between the groups (P>.40 for each comparison).
Baseline characteristics for continuous variables were presented by using means and 95% confidence intervals (CIs) unless otherwise specified, and comparison between the 2 groups at baseline was performed by using the t test for continuous variables and the χ2 test for categorical variables. The treatment effect (net difference between the change in GH and placebo, and 95% CI [calculated by using the model-based standard error of the adjusted treatment effect estimate]) was determined by using repeated-measures mixed-effects analysis of covariance, adjusting for age, sex, race, study drug dosage, as well as baseline testosterone, protease inhibitor, and nucleoside reverse transcriptase inhibitor use. Baseline data on use of antihypertensive and lipid-lowering medications as well as smoking were included as additional covariates in the analysis of change in carotid IMT. Use of antihypertensive medication was included as a covariate in the analysis of change in blood pressure (BP), and use of lipid-lowering medications was included as a covariate in the analysis of change in lipid end points. The treatment effect was examined by the statistical significance of the group (GH vs placebo) × time interaction effect. For each participant, available data for months 6, 12, and 18 were pooled and compared with baseline to obtain an aggregate change over the duration of treatment. This approach was chosen over a slope analysis as the data did not typically show a linear time dependency and changes occurring by 6 months were generally maintained over the duration of the study. To fit the random intercept mixed-effects model with exchangeable correlation structure for the repeated measurements, we used the SAS proc mixed procedure (SAS Institute Inc, Cary, North Carolina).
Secondary analyses also using repeated-measures mixed-effects analysis of covariance were performed in the per-protocol population (n=48) and also in a subset limited to men only (n=49). In addition, a repeated-measures model in which missing data were imputed by using a last-value-carried-forward approach was performed for the primary end point, VAT.
No adjustment was made for multiple comparisons in secondary end points in the primary analysis. In secondary analyses, a Bonferroni correction was applied to account for multiple endpoints within each category (eg, body composition, lipids, and biochemical and cardiovascular parameters). Results did not change for the majority of statistically significant secondary end points (trunk-to-lower extremity ratio, triglyceride level, IGF-1, 2-hourglucose, diastolic BP) byusingthis correction.
Extreme values of increased triglycerides were observed in 3 patients and therefore the Wilcoxon rank sum test was used for pooled data from months 6, 12, and 18 following the absence of statistical difference at baseline.
In the screening population and baseline analysis, correlation of peak GH re-sponse to GHRH plus arginine testing with metabolic parameters was assessed by using the Spearman ρ, because peak GH levels were not normally distributed.
All reported P values were 2-sided and P<.05 was considered statistically significant. Statistical analyses were performed by using SAS version 9 and SAS JMP statistics version 5.1 (SAS Institute Inc).
RESULTS
Screening Data
One hundred ninety-two patients with HIV were screened for the study between November 2003 and March 2006 (Figure 1). Data were available for 191 patients from GH stimulation testing. The mean age of the population was 45 years (95% CI, 44-46 years). The population had a mean BMI of 26.6 (95% CI, 25.9-27.2), and participants were 74% white and 84% men.
Figure 1.

Study Participant Enrollment and Discontinuation
The mean peak GH response to GHRH plus arginine testing was 21.2 ng/mL (95% CI, 17.5-24.9 ng/mL). The peak GH response correlated significantly and inversely with triglycerides (ρ=-0.37, P<.001), total cholesterol (ρ=-0.22, P=.004), systolic BP (ρ=-0.23, P=.002), and diastolic BP (ρ=-0.17, P=.02). When controlling for age, sex, BMI, and protease inhibitor and lipid-lowering medication use, peak GH response remained an independent predictor of fasting triglyceride concentration (β=-1.12 mg/dL [to convert to millimoles per liter, multiply by 0.0113] change in triglyceride levels per ng/mL [1 μg/L] change in peak GH, P=.03). A total of 33% of participants screened demonstrated a peak GH response to GHRH plus arginine of less than 7.5 ng/mL.
Results of Interventional Study
Fifty-six patients enrolled in the study. Baseline characteristics of the study population were similar between the groups (Table 1). Twenty-seven participants were allocated to receive GH, of whom 21 (78%) completed the trial; and 29 participants were allocated to receive placebo, of whom 27 (93%) completed the trial (Figure 1). The discontinuation rates were not statistically different between the groups (P=.10). Significant changes in antiretroviral medication class and antihypertensive and lipid-lowering medications were not observed between the groups during the study. Baseline use of antiretroviral drugs in each major class and individual drugs were not substantially different between the groups. Commonly used medications ( >15% study population) overall and in the GH and placebo groups included lamivudine, 71% (59% and 83%, respectively); tenofovir, 52% (56% and 48%, respectively); ritonavir, 38% (37% and 38%, respectively); zidovudine, 34% (30% and 38%, respectively); efavirenz, 29% (26% and 31%, respectively); abacavir, 20% (30% and 10%, respectively); nevirapine, 20% (22% and 17%, respectively); atazanavir, 18% (19% and 17%, respectively); and lopinavir, 18% (15% and 21%, respectively). Specifically, there was no statistically significant difference in stavudine use (15% in the GH group vs 17% in the placebo group, P=.80).
Table 1.
Baseline Characteristics of Study Participants at Randomizationa
| Characteristics | Growth Hormone (n = 27) | Placebo (n = 29) |
|---|---|---|
| Age, y | 46.7 (43.6-49.9) | 47.4 (45.1-49.7) |
| Male sex, No. (%) | 26 (96) | 26 (90) |
| Race/ethnicity, No. (%) | ||
| White | 23 (85) | 22 (76) |
| Black | 2 (7) | 3 (10) |
| Hispanic | 2 (7) | 4 (14) |
| Weight, kg | 89.1 (82.9-95.3) | 87.5 (82.6-92.5) |
| BMI | 29.1 (27.4-30.8) | 28.3 (26.7-29.9) |
| Waist circumference, cm | 102.9 (98.6-107.2) | 101.9 (98.0-105.9) |
| Waist-to-hip ratio | 1.02 (1.00-1.05) | 1.01 (0.99-1.03) |
| Viral load [log10(copies of RNA/mL)] | 2.8 (2.6-3.0) | 2.8 (2.5-3.0) |
| CD4 cells/μLb | 554 (442-666) | 657 (542-773) |
| Protease inhibitor use | ||
| No. (%) | 14 (52) | 15 (52) |
| Duration, y | 2.6 (1.2-3.9) | 2.1 (1.0-3.2) |
| NRTI use | ||
| No. (%) | 25 (93) | 29 (100) |
| Duration, y | 2.8 (1.9-3.6) | 3.2 (2.2-4.2) |
| NNRTI use | ||
| No. (%) | 13 (48) | 14 (48) |
| Duration, y | 2.9 (1.7-4.0) | 3.4 (2.3-4.6) |
| Smoking, No. (%) | ||
| Current smokerc | 6 (23) | 8 (28) |
| History of smoking | 14 (52) | 17 (59) |
| Testosterone use, No. (%) | 10 (37) | 6 (21) |
| Lipid-lowering medication use, No. (%) | 10 (37) | 15 (52) |
| Antihypertensive medication use, No. (%) | 10 (37) | 8 (28) |
Abbreviations: BMI, body mass index, calculated as weight in kilograms divided by height in meters squared; NRTI, nucleoside reverse transcriptase inhibitor; NNRTI, nonnucleoside reverse transcriptase inhibitor.
Data are reported as mean (95% confidence interval) unless otherwise indicated. P > .05 for all baseline comparisons by t test for continuous variables and χ2 test for categorical variables.
For growth hormone group, n = 26.
Patients were self-identified as current smokers but did not provide information on packs per day.
Dosing
During the course of the 18-month study, the mean dose of GH was 3.7 μg/kg/d (95% CI, 3.3-4.1 μg/kg/d; average dose, 0.33 mg/d; 95% CI, 0.29-0.38 mg/d) and the mean dose of placebo was 3.8 μg/kg/d (95% CI, 3.5-4.1 μg/kg/d; average dose, 0.33 mg/d; 95% CI, 0.30-0.36 mg/d) (Figure 2). Parallel-dose adjustments for placebo were made and dosing was similar between the groups. Similar dosing was also observed in the per-protocol population. Adherence logs were returned in 79% of patients in the placebo group compared with 74% of patients in the GH group (P=.64). Adherence, assessed via self-completed patient log, was 94% in the GH group compared with 95% in the placebo group, per returned logs.
Figure 2.
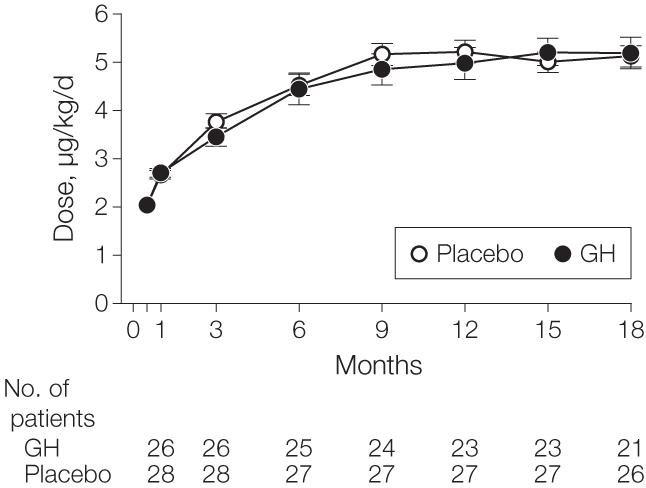
Dosage of Growth Hormone (GH) vs Placebo Titrated Over 18 Months
No statistical significance for each time point was found. Error bars indicate standard error of mean. Numbers of patients assessed at 2 weeks were 26 for GH and 29 for placebo.
Body Composition and IGF-1
Visceral adipose tissue area decreased significantly in the GH group compared with the placebo group (treatment effect, -19 cm2; 95% CI, -38 to -0.5 cm2; P=.049) (Figure 3), which corresponds with a percentage change in VAT of -8.5% in the GH group and -1.6% in the placebo group. The effect size for VAT was similar in secondary analyses (per-protocol analysis [n=48], -17 cm2; 95% CI, -37 to 3 cm2; last-value-carried-forward analysis [n=56], -19 cm2; 95% CI, -37 to -0.3 cm2; and analysis excluding women [n=49], -21 cm2; 95% CI, -41 to -2 cm2). The mean percentage reduction in VAT among the patients treated with GH was -8.5% (standard error of mean, 2.7%), whereas the median reduction was -13.4%. Variability in response was indicated by the interquartile range of responses of -22.3% to 4.6%.
Figure 3.

Effects of Growth Hormone (GH) vs Placebo Treatment on Visceral Adipose Tissue Area and Insulinlike Growth Factor 1 Levels Over 18 Months
For visceral adipose tissue area, P<.05 for effect over 18 months; and for insulinlike growth factor 1 levels, P<.001 for effect over 18 months. Error bars indicate standard error of mean. Insulinlike growth factor 1 data presented for safety population, for all visits, including safety visits. Numbers of patients assessed at 2 weeks were identical to those assessed at 1 month.
Trunk-to-lower extremity fat ratio (treatment effect, -0.4; 95% CI, -0.6 to -0.2; P<.001) and trunk fat (treatment effect, -0.8 kg; 95% CI, -1.5 to -0.04 kg; P=.04) decreased in the GH group compared with the placebo group (Table 2). Abdominal SAT area and extremity fat did not change. Lean mass increased significantly in the GH group compared with the placebo group (treatment effect, 1.3 kg; 95% CI, 0.2-2.3 kg; P=.02).
Table 2.
Effects of Growth Hormone vs Placebo on Body Composition, Lipid Profiles, Biochemical Parameters, and Cardiovascular and Immune Functiona
| Growth Hormone |
Placebo |
|||||||||||
|---|---|---|---|---|---|---|---|---|---|---|---|---|
| Mean (95% CI) |
Aggregate Change, Mean (SEM) | Mean (95% CI) |
Aggregate Change, Mean (SEM) | Treatment Effect (95% CI) | ||||||||
| Baseline (n = 25) | Month 6 (n = 25) | Month 12 (n = 23) | Month 18 (n = 21) | Baseline (n = 27) | Month 6 (n = 27) | Month 12 (n = 27) | Month 18 (n = 27) | P Valueb | ||||
| Body Composition | ||||||||||||
| VAT, cm2 | 241 (201-281) |
217 (180-254) |
220 (173-266) |
223 (182-263)c |
-22 (6) | 204 (172-236) |
200 (167-233) |
195 (165-226) |
203 (169-238) |
-4 (4) | -19 (-38 to -0.5) |
.049 |
| SAT, cm2 | 183 (140-225)c |
190 (144-236)c |
190 (142-238) |
177 (120-233)c |
4 (4) | 196 (144-248) |
200 (141-259) |
197 (137-257) |
203 (138-267) |
4(4) | 1 (-14 to 16) |
.89 |
| Trunk fat, kg | 14.5 (12.3-16.6) |
13.9 (11.5-16.3) |
13.4 (11.1-15.6) |
13.1 (10.7-15.6) |
-0.5 (0.2) | 12.9 (10.8-14.9) |
13.2 (11.0-15.4) |
12.9 (10.6-15.2)c |
13.1 (10.8-15.4) |
0.2 (0.2) | -0.8 (-1.5 to -0.04) |
.04 |
| Extremity fat, kg | 7.4 (5.9-8.9) |
7.6 (6.0-9.2) |
7.5 (6.2-8.8) |
7.2 (5.7-8.7) |
0.3 (0.1) |
6.7 (4.9-8.5) |
6.9 (5.0-8.9) |
7.0 (4.9-9.2)c |
7.2 (5.1-9.3) |
0.3 (0.1) | 0 (-0.4 to 0.4) |
.94 |
| Trunk-to-lower extremity fat ratio | 3.8 (3.2-4.4) |
3.5 (3.0-4.0) |
3.3 (2.8-3.7) |
3.5 (2.9-4.0) |
-0.4 (0.1) | 3.7 (3.3-4.1) |
3.7 (3.3-4.2) |
3.7 (3.3-4.2)c |
3.7 (3.3-4.2) |
0 (0) | -0.4 (-0.6 to -0.2) |
<.001 |
| Lean mass, kg | 66.4 (62.4-70.5) |
67.7 (63.3-72.0) |
66.5 (61.9-71.1) |
65.8 (60.7-70.9) |
0.8 (0.3) | 66.8 (64.0-69.6) |
66.4 (63.5-69.3) |
66.6 (63.6-69.6)c |
66.2 (63.2-69.3) |
-0.5 (0.3) | 1.3 (0.2 to 2.3) |
.02 |
| BMI | 29.2 (27.5-31.0) |
29.5 (27.6-31.5) |
29.1 (27.4-30.7) |
28.5 (26.7-30.4) |
0.2 (0.2) | 28.1 (26.5-29.8) |
28.3 (26.4-30.2)c |
28.3 (26.3-30.2) |
28.3 (26.4-30.3) |
0.1 (0.1) | 0.1 (-0.4 to 0.6) |
.67 |
| Lipid Levels | ||||||||||||
| Triglycerides, mg/dL | 183 (142-244) |
169 (137-238) |
169 (131-234)c |
186 (121-219) |
-7 (-43 to 41) | 204 (156-317) |
215 (168-362) |
197 (154-333)c |
243 (164-308)c |
0 (-56 to 51) |
-7a | .002 |
| HDL cholesterol, mg/dL | 40 (36-44) |
43 (38-47) |
44 (39-49)c |
43 (40-47) |
4 (1) | 39 (35-43) |
41 (37-44) |
43 (38-47)c |
43 (39-48)c |
3(1) | 1 (-2 to 5) | .46 |
| Total cholesterol, mg/dL | 189 (172-207) |
191 (173-209) |
184 (169-199)c |
183 (165-201) |
-1 (3) | 194 (178-209) |
189 (171-207) |
184 (167-201)c |
189 (172-206)c |
-6 (4) | 3 (-11 to 17) | .64 |
| Biochemical Parameters | ||||||||||||
| IGF-1, ng/mL | 146 (122-170) |
260 (227-292) |
267 (220-314) |
236 (195-278)c |
109 (11) | 159 (136-182) |
145 (128-161)c |
133 (118-149)c |
125 (110-139) |
-25 (8) | 129 (95 to 164) |
<.001 |
| Fasting blood glucose, mg/dL | 94 (89-100)c |
99 (92-106) |
101 (93-109) |
102 (93-110) |
6 (1) | 89 (85-93) |
92 (89-95) |
94 (90-99) |
96 (92-99) |
5 (1) | 2 (-3 to 7) | .39 |
| 2-h glucose, mg/dL | 138 (121-156)c |
156 (130-181)c |
155 (129-181) |
158 (132-184) |
16 (5) | 137 (121-153) |
132 (120-144) |
130 (112-148) |
136 (117-155)c |
-4 (4) | 22 (6 to 37) | .009 |
| Fasting insulin, μIU/mL | 14 (10-18) |
14 (9-19)c |
15 (11-18) |
14 (8-19) |
0 (1) | 10 (6-14) |
13 (8-18) |
23 (-1 to 47) |
11 (8-14)c |
6 (4) | -5 (-19 to 10) |
.51 |
| Hemoglobin A1c,% | 5.5 (5.3-5.6)c |
5.6 (5.4-5.9) |
5.7 (5.4-6.0) |
5.7 (5.4-5.9) |
0.2 (0.1) | 5.3 (5.1-5.5) |
5.4 (5.2-5.6) |
5.5 (5.3-5.7) |
5.6 (5.3-6.0) |
0.2 (0.1) | 0.1 (-0.1 to 0.2) | .47 |
| Adiponectin, μg/mL | 4.4 (3.3-5.5) |
5.6 (4.1-7.1)c |
5.2 (4.3-6.0) |
5.1 (4.3-5.8) |
1.0 (0.3) | 4.0 (3.0-5.0) |
4.4 (3.2-5.6) |
4.6 (3.3-5.8) |
4.7 (3.5-5.8)c |
0.5 (0.1) | 0.5 (-0.4 to 1.4) | .27 |
| Cardiovascular Parameters | ||||||||||||
| Carotid IMT, mm | 0.763 (0.719-0.806) |
0.777 (0.717-0.838) |
0.751 (0.689-0.813)c |
0.754 (0.683-0.824)c |
0.003 (0.008) | 0.725 (0.683-0.766) |
0.739 (0.695-0.783)c |
0.715 (0.672-0.759) |
0.717 (0.672-0.762)c |
-0.003 (0.009) | -0.004 (-0.035 to 0.026) | .78 |
| Systolic BP, mm Hg | 129 (121-138) |
126 (119-132) |
125 (118-131) |
121 (114-128) |
-5 (2) | 121 (116-127) |
122 (116-127) |
122 (118-126) |
124 (118-130) |
1 (2) | -6 (-13 to 1) | .09 |
| Diastolic BP, mm Hg | 80 (77-84) |
79 (75-82) |
79 (75-82) |
76 (72-80) |
-3 (1) | 72 (68-76) |
75 (72-78) |
77 (74-80) |
76 (73-80) |
4 (1) | -7 (-11 to -2) | .006 |
| Immune Function | ||||||||||||
| CD4 cells/μL | 579 (459-699)d |
552 (454-651)c |
579 (470-687) |
532 (440-625) |
-19 (13) | 661 (539-784) |
690 (519-861) |
647 (525-769)c |
675 (511-840)c |
15 (21) | -30 (-97 to 37) | .38 |
| Viral load [log10 (copies of RNA/mL)] | 2.8 (2.6-3.0) | NA | NA | 2.8 (2.6-3.0) | 0 (0.1) | 2.8 (2.5-3.0) | NA | NA | 2.8 (2.5-3.1) | 0 (0.2) | 0 (-0.4 to 0.3) | .91 |
| Quality of life score (MOS-HIV)e | 66 (58-75) | 68 (59-78) | 62 (51-73) | 59 (46-72) | -4 (3) | 64 (56-72) | 61 (54-68) | 57 (49-66) | 63 (56-69) | -4 (3) | 1 (-9 to 12) | .78 |
Abbreviations: BMI, body mass index, calculated as weight in kilograms divided by height in meters squared; BP, blood pressure; CI, confidence interval; HDL, high-density lipoprotein; HIV, human immunodeficiency virus; IGF-1, insulinlike growth factor 1; IMT, intima-media thickness; MOS-HIV, Medical Outcomes Study HIV Health Survey; NA, not applicable; SAT, subcutaneous adipose tissue; VAT, visceral adipose tissue.
SI conversions: To convert triglycerides to mmol/L, multiply by 0.0113; to convert total and HDL cholesterol to mmol/L, multiply by 0.0259; to convert IGF-1 to nmol/L, multiply by 0.131; to convert glucose to mmol/L, multiply by 0.0555; to convert insulin to pmol/L, multiply by 6.945.
Baseline results are reported for all participants for whom at least 1 follow-up result was obtained. Treatment effects are reported as net difference between the change in growth hormone and placebo. For triglycerides, results are reported as median (interquartile range) using the Wilcoxon rank sum test. The 95% CI could not be calculated for triglycerides given the use of a nonparametric analysis. All baseline comparisons are P > .05 by t test (analysis of variance), except for diastolic BP.
Aggregate change over 18 months for growth hormone vs placebo. See the “Statistical Analysis” section for description of statistical methods used.
Number of patients analyzed was 1 less than the total number (ie, n = 20 for VAT with growth hormone at month 18).
n = 23.
Scale of 0 to 100, with higher number indicating better quality of life. For growth hormone group, n = 23 at baseline and month 6; n = 19 at month 12; n = 17 at month 18; and for placebo group, n = 25 at baseline and month 6; and n = 24 at months 12 and 18.
IGF-1 increased with GH treatment compared with placebo treatment (treatment effect, 129 ng/mL; 95% CI, 95-164 ng/mL; P<.001) (Figure 3 and Table 2). Similar changes for IGF-1 were observed in the per-protocol analysis. Change in VAT correlated with baseline VAT (r=-0.30, P=.03) and change in IGF-1 (r=-0.31, P=.03).
Lipids
Triglycerides decreased (treatment effect, -7 mg/dL; P=.002), whereas total cholesterol and HDL cholesterol were unchanged in the GH group compared with the placebo group (Table 2).
Glucose, Insulin, and Adiponectin
The 2-hour oral glucose tolerance test glucose level increased in the GH group. Similar changes were observed in the per-protocol analysis. Fasting blood glucose, fasting insulin, hemoglobin A1c, and adiponectin did not change in the GH group compared with the placebo group (Table 2). In participants in the GH group, fasting blood glucose levels (10 mg/dL; 95% CI, 2-18 mg/dL vs 5 mg/dL; 95% CI, 2-8 mg/dL) and 2-hour glucose levels (32 mg/dL; 95% CI, 2-62 mg/dL vs 10 mg/dL; 95% CI, -9 to 30 mg/dL) tended to increase more in participants with baseline impaired fasting glucose (n=7) vs without impaired fasting glucose (n=17), respectively. Similar results were observed in the per-protocol population. In contrast, change in IGF-1 was not related to change in 2-hour glucose level (r=-0.19, P=.37). Similar results were observed in the per-protocol analysis (r=-0.18, P=.44).
Cardiovascular Parameters
Diastolic BP (treatment effect, -7 mm Hg; 95% CI, -11 to -2 mm Hg; P=.006) decreased with GH, while the change in systolic BP was not statistically different compared with placebo (treatment effect, -6 mmHg;95%CI,-13 to 1 mmHg;P=.09). Carotid IMT did not change in the GH group compared with the placebo group (treatment effect, -0.004 mm; 95% CI, -0.035 to 0.026mm; P=.78). The 2-hour glucose level was significantly related to carotid IMT at 18 months (r=0.38, P=.009), but not at baseline (r=0.07, P=.58).
Safety Parameters and Quality of Life
At baseline, there was no significant relationship between CD4 cell count and IGF-1 (ρ=-0.05, P=.71), although there was a trend in the relationship between CD4 cell count and peak GH response to GHRH plus arginine (ρ=0.25, P=.06). No effects of GH treatment were observed on HIV viral load or CD4 cell count (Table 2). Change in quality of life, measured by the quality of life domain of the MOS-HIV survey, did not differ between the GH and placebo groups (Table 2).
Adverse Events
Adverse events were not significantly increased in the GH group compared with the placebo group (Table 3). A total of 23% of participants in the GH group experienced potentially GH-related adverse events compared with 28% of participants in the placebo group. Four serious adverse events occurred in the GH group, which included rectal cancer, hospitalization for confusion and transaminitis (thought to be related to progression of HIV), hip fracture requiring surgery, and appendicitis requiring surgery. None of these events was considered related to GH treatment. One serious adverse event was noted in the placebo group (anal cancer).
Table 3.
Summary of Adverse Events
| Growth Hormone (n = 26) |
Placebo (n = 29) |
||||
|---|---|---|---|---|---|
| Adverse Events | No. of Patients (95% CI) | % of Patients (95% CI) | No. of Patients (95% CI) | % of Patients (95% CI) | P Valuea |
| No. with any adverse event | 11 (6-16) | 42 (23-63) | 19 (13-24) | 66 (46-82) | .08 |
| No. with discontinuation-related adverse event | 1 (0-5) | 4 (0-20) | 1 (0-5) | 3 (0-18) | .94 |
| No. with serious adverse event | 4 (1-9) | 15 (4-35) | 1 (0-5) | 3 (0-18) | .11 |
| Adverse events potentially attributable to growth hormone | 6 (2-11) | 23 (9-44) | 8 (3-14) | 28 (13-47) | .70 |
| Tingling/paresthesia | 3 (0-8) | 12 (2-30) | 1 (0-5) | 3 (0-18) | .24 |
| Carpal tunnel syndrome | 1 (0-5) | 4 (0-20) | 1 (0-5) | 3 (0-18) | .94 |
| Arthralgia | 1 (0-5) | 4 (0-20) | 2 (0-7) | 7 (1-23) | .62 |
| Swelling | 1 (0-5) | 4 (0-20) | 0 (0-3) | 0 (0-12) | .22 |
| Hyperglycemia | 1 (0-5) | 4 (0-20) | 2 (0-7) | 7 (1-23) | .62 |
| Malignancy | 1 (0-5) | 4 (0-20) | 1 (0-5) | 3 (0-18) | .94 |
| Hypertension | 0 (0-3) | 0 (0-13) | 1 (0-5) | 3 (0-18) | .25 |
Abbreviation: CI, confidence interval.
By χ2 test.
COMMENT
In our study, physiological GH administration significantly reduced visceral fat and truncal obesity, triglycerides, and diastolic BP and was well-tolerated. However, GH increased the 2-hour postchallenge glucose level in patients with HIV-associated abdominal fat accumulation and relative GHD during a long treatment period of 18 months.
The screening data demonstrate significant inverse correlations between peak GH response to GHRH plus arginine stimulation testing and important metabolic parameters. Taken together, these data suggest that reduced GH secretion is associated with metabolic abnormalities in patients with HIV and abdominal fat accumulation.
Growth hormone is an anabolic hormone and has lipolytic effects, increasing the mobilization of triacylglycerols from adipose tissue.27 Growth hormone inhibits lipoprotein lipase in adipose tissue,28,29 reduces de novo lipogenesis in the liver,30 and increases overall fat oxidation rates,31 which may contribute to its positive effects on lipids. Consistent with these known physiological effects of GH, we found that GH administration in patients with HIV and relative GHD (1) decreased abdominal visceral fat and trunk fat, (2) increased lean body mass, and (3) reduced triglycerides. Furthermore, the change in VAT correlated significantly with the change in IGF-1. In contrast, we found a sparing of abdominal SAT and extremity fat at the low doses used, which is important in patients infected with HIV who frequently experience lipoatrophy of subcutaneous fat. Indeed, our patients had relatively low extremity fat at baseline despite marked central fat accumulation. In contrast, higher doses of GH in patients with HIV decreased both SAT and VAT.19 The relative decrease in VAT achieved in our study is less than with high-dose GH, but more than observed in most studies of exercise and dietary modification32 and insulin sensitization strategies in patients with HIV.33,34 It is unknown if improved GH secretion with reduction in visceral fat contributes to the metabolic benefits of lifestyle intervention and other strategies to reduce VAT in the HIV population.
Previous studies of GH in patients with HIV did not select for patients with reduced GH response to standardized stimulation testing, were significantly shorter in duration, and used supraphysiological doses of GH, resulting in IGF-1 levels several-fold above the normal range.19,20,35 In contrast with prior studies using 2 to 4 mg/d, we used a physiological dose of 0.33 mg/d. Although prior trials demonstrated a more marked improvement in VAT than observed in our study, patients experienced considerable GH-related adverse events. A small pilot study of intermediate-dose (1 mg/d) GH decreased truncal obesity and was associated with transient glucose intolerance.21 In our study, we selected patients who demonstrated decreased GH secretory capacity at baseline and found low-dose GH to be well-tolerated. Growth hormone-related adverse events were not increased in the GH treatment group compared with the placebo group.
Growth hormone has been shown to improve insulin sensitivity assessed by hyperinsulinemic euglycemic clamp in HIV-negative men with abdominal obesity after 9 months of treatment.16 We found a worsening of 2-hour postchallenge glucose in our study. This finding may underscore the heightened risk of GH administration for altered glucose homeostasis in patients with HIV-associated visceral fat accumulation and insulin resistance. Although GH acutely exerts insulin-antagonistic effects in the liver and peripherally, prolonged treatment with GH in HIV-negative individuals with abdominal obesity has been postulated to improve insulin sensitivity due to a reduction in VAT and subsequent reduction in free fatty acids in the portal circulation.16,17 In a study using GH with a dose of 3 mg/d in patients with HIV,35 the effect of GH on insulin-mediated glucose disposal worsened in the first month, then subsequently improved to baseline values by 6 months. Our study showed a consistent difference over time and no pattern of initial worsening and subsequent improvement (data not shown). Glucose levels tended to deteriorate more with GH treatment in participants with impaired fasting glucose at baseline. No relationship was observed between change in IGF-1 and glucose, suggesting that baseline glucose status, potentially more than IGF-1 level achieved, determines abnormal response to GH.
Another strategy to influence the GH axis in patients with HIV is the use of GHRH.23,36,37 In a recent study,37 GHRH (1-44) (tesamorelin), decreased VAT and improved total cholesterol, HDL cholesterol, triglycerides, and adiponectin without worsening of glucose levels. However, tesamorelin is not yet available for clinical use. In that study, VAT decreased by 15% during 6 months in response to tesamorelin, while VAT decreased by approximately 9% during 18 months in our study. Mean IGF-1 increased to a similar degree in both studies (109 ng/mL with tesamorelin37 and 109 ng/mL with low-dose GH). The potential mechanisms to explain the relative potency of GHRH compared with GH to reduce VAT despite a similar increase in IGF-1 remain unknown but may relate to physiological effects of GHRH to increase endogenous GH pulsatility, not achieved with GH. At the same time, glucose homeostasis was not altered by the GHRH analogue but was worsened by low-dose GH for the same increase in IGF-1. Further research is needed to investigate these important differences in these 2 strategies to increase GH in the HIV population.
In our study, we found an improvement in diastolic BP in the GH group, which is consistent with results from Johannsson et al16 who had previously demonstrated that GH improved diastolic BP in abdominally obese men without HIV. However, diastolic BP was higher in the GH group than placebo group at baseline, and the significant decrease in the GH group may in part represent regression to the mean.
Previous studies in patients not infected with HIV and having severe GHD have shown increased carotid IMT at baseline and improvement in carotid IMT38-40 with GH administration. Baseline carotid IMT was not increased in our participants compared with age-matched healthy controls, and thus significant reductions in response to GH would be less likely. Our data also suggest that increased glucose levels resulting from GH may limit the salutary effects of GH on carotid IMT in the HIV population.
In contrast with the recent findings of Napolitano et al41 using a much higher dose of GH (3.0 mg/d for first 6 months and then 1.5 mg/d for second 6 months), we did not find an increase in CD4 cell count with GH administration. Furthermore, we did not assess thymic output or volume. The CD4 cell count was higher at baseline in our study than that found in Napolitano et al.41 We did not observe a relationship between baseline IGF-1 and CD4 cell count, but there was a near significant association between peak GH response to GHRH plus arginine testing and CD4 cell count at baseline. Further studies on the effects of low-dose physiological GH on T cell dynamics are needed.
Our study has some limitations, including a modest effect size for the primary end point, VAT. However, the change in VAT we observed (-22 cm2 within the GH group, -19 cm2 treatment effect relative to placebo) with GH was comparable in magnitude to that achieved with other strategies, including lifestyle modification, to reduce abdominal adiposity in patients without HIV.42-44 Furthermore, the treatment effect observed in our study represented the novel effects of truly physiological dosing in the HIV population. In considering strategies to reduce visceral fat in patients with HIV infection, the US Food and Drug Administration (FDA) considers a reduction of 8% in visceral fat to be clinically significant for the use of GH.45 In our study, the mean and median reductions in visceral fat in patients treated with GH were -8.5% and -13.4%, respectively, and thus likely to be considered clinically relevant. The study cannot be generalized to patients with HIV and normal GH secretion, but a third of patients with HIV and abdominal fat accumulation will have reduced GH secretion as measured by response to standardized stimulation testing.3 Furthermore, FDA approval of GH dosing in patients without HIV and having GHD is based on response to standardized GH stimulatory testing, and thus our paradigm is appropriate to select patients for study of long-term, low-dose physiological GH. Approximately 30% of the men were using testosterone at baseline, but the percentage using testosterone was not different between the groups. We controlled for sex and testosterone use in all analyses and the results were recapitulated in secondary analyses limited to men.
In conclusion, low-dose physiological GH in patients with HIV, abdominal fat accumulation, and reduced GH secretion improved body composition, triglycerides, and diastolic BP without significant adverse events but worsened 2-hour postchallenge glucose. Data from our randomized, placebo-controlled trial involving a long duration of observation inject a note of caution into the debate regarding the use of GH therapy in the HIV population. Large doses are highly effective to reduce VAT, but result in supraphysiological IGF-1 and many GH-related adverse events. Low-dose physiological GH is well-tolerated and results in significant but more modest reduction in VAT, but is nonetheless associated with increased glucose levels. Therefore, the therapeutic window to achieve an optimal risk-benefit ratio of GH in individuals with HIV, abdominal fat accumulation, and insulin resistance may be very narrow and difficult to achieve. Growth hormone is not yet FDA-approved for the treatment of abdominal fat accumulation in patients with HIV. Other more potent strategies to safely increase GH and reduce VAT, including the use of GHRH, may be more beneficial. In addition, strategies using diet, exercise, and lifestyle change may be more cost-effective in the long run than GH, particularly in patients with HIV, visceral adiposity, and insulin resistance, in whom changes in glucose may be counterproductive.
Acknowledgments
Funding/Support: This study was funded by grants R01 DK63639 (Dr Grinspoon), F32 HL088991 (Dr Lo), and M01 RR01066-25S1 from the National Institutes of Health. EMD Serono provided the growth hormone (Serostim) and placebo but did not provide funding for the study.
Role of the Sponsors: The National Institutes of Health reviewed the design of the study and annual progress reports, but did not participate in the conduct of the study, in the collection, management, analysis, or interpretation of the data, or in the preparation, review, or approval of the manuscript. EMD Serono played no part in the study design, conduct, analysis, or decisions about manuscript submission.
Footnotes
Financial Disclosures: Dr Grinspoon reports receiving research support on an unrelated project from EMD Serono and also serving as a consultant for EMD Serono. In addition, Dr Grinspoon reports serving as a consultant and has received research support from Theratechnologies. No other authors reported any financial disclosures.
Previous Presentations: Presented in part at the Conference of Retroviruses and Opportunistic Infections; February 6, 2008; Boston, Massachusetts; and at the Endocrine Society; June 17, 2008; San Francisco, California.
REFERENCES
- 1.Friis-Møller N, Sabin CA, Weber R, et al. Combination antiretroviral therapy and the risk of myocardial infarction. N Engl J Med. 2003;349(21):1993–2003. doi: 10.1056/NEJMoa030218. [DOI] [PubMed] [Google Scholar]
- 2.Rietschel P, Hadigan C, Corcoran C, et al. Assessment of growth hormone dynamics in human immunodeficiency virus-related lipodystrophy. J Clin Endocrinol Metab. 2001;86(2):504–510. doi: 10.1210/jcem.86.2.7175. [DOI] [PubMed] [Google Scholar]
- 3.Koutkia P, Canavan B, Breu J, Grinspoon S. Growth hormone (GH) responses to GH-releasing hormone-arginine testing in human immunodeficiency virus lipodystrophy. J Clin Endocrinol Metab. 2005;90(1):32–38. doi: 10.1210/jc.2004-1342. [DOI] [PubMed] [Google Scholar]
- 4.Koutkia P, Eaton K, You SM, Breu J, Grinspoon S. Growth hormone secretion among HIV infected patients: effects of gender, race and fat distribution. AIDS. 2006;20(6):855–862. doi: 10.1097/01.aids.0000218549.85081.8f. [DOI] [PubMed] [Google Scholar]
- 5.Rosén T, Bosaeus I, Tölli J, Lindstedt G, Bengtsson BA. Increased body fat mass and decreased extracellular fluid volume in adults with growth hormone deficiency. Clin Endocrinol (Oxf) 1993;38(1):63–71. doi: 10.1111/j.1365-2265.1993.tb00974.x. [DOI] [PubMed] [Google Scholar]
- 6.Salomon F, Cuneo RC, Hesp R, Sonksen PH. The effects of treatment with recombinant human growth hormone on body composition and metabolism in adults with growth hormone deficiency. N Engl J Med. 1989;321(26):1797–1803. doi: 10.1056/NEJM198912283212605. [DOI] [PubMed] [Google Scholar]
- 7.Merimee TJ, Hollander W, Fineberg SE. Studies of hyperlipidemia in the HGH-deficient state. Metabolism. 1972;21(11):1053–1061. doi: 10.1016/0026-0495(72)90036-4. [DOI] [PubMed] [Google Scholar]
- 8.De Boer H, Blok GJ, Voerman HJ, De Vries PM, van der Veen EA. Body composition in adult growth hormone-deficient men, assessed by anthropometry and bioimpedance analysis. J Clin Endocrinol Metab. 1992;75(3):833–837. doi: 10.1210/jcem.75.3.1517374. [DOI] [PubMed] [Google Scholar]
- 9.Rosén T, Bengtsson BA. Premature mortality due to cardiovascular disease in hypopituitarism. Lancet. 1990;336(8710):285–288. doi: 10.1016/0140-6736(90)91812-o. [DOI] [PubMed] [Google Scholar]
- 10.Bengtsson BA, Eden S, Lonn L, et al. Treatment of adults with growth hormone (GH) deficiency with recombinant human GH. J Clin Endocrinol Metab. 1993;76(2):309–317. doi: 10.1210/jcem.76.2.8432773. [DOI] [PubMed] [Google Scholar]
- 11.Friedman M, Byers SO, Rosenman RH, Li CH, Neuman R. Effect of subacute administration of human growth hormone on various serum lipid and hormone levels of hypercholesterolemic and normocholesterolemic subjects. Metabolism. 1974;23(10):905–912. doi: 10.1016/0026-0495(74)90039-0. [DOI] [PubMed] [Google Scholar]
- 12.Blackett PR, Weech PK, McConathy WJ, Fesmire JD. Growth hormone in the regulation of hyperlipidemia. Metabolism. 1982;31(2):117–120. doi: 10.1016/0026-0495(82)90121-4. [DOI] [PubMed] [Google Scholar]
- 13.Sesmilo G, Biller BM, Llevadot J, et al. Effects of growth hormone administration on inflammatory and other cardiovascular risk markers in men with growth hormone deficiency: a randomized, controlled clinical trial. Ann Intern Med. 2000;133(2):111–122. doi: 10.7326/0003-4819-133-2-200007180-00010. [DOI] [PubMed] [Google Scholar]
- 14.Johansson JO, Fowelin J, Landin K, Lager I, Bengtsson BA. Growth hormone-deficient adults are insulin-resistant. Metabolism. 1995;44(9):1126–1129. doi: 10.1016/0026-0495(95)90004-7. [DOI] [PubMed] [Google Scholar]
- 15.Hew FL, Koschmann M, Christopher M, et al. Insulin resistance in growth hormone-deficient adults: defects in glucose utilization and glycogen synthase activity. J Clin Endocrinol Metab. 1996;81(2):555–564. doi: 10.1210/jcem.81.2.8636267. [DOI] [PubMed] [Google Scholar]
- 16.Johannsson G, Marin P, Lonn L, et al. Growth hormone treatment of abdominally obese men reduces abdominal fat mass, improves glucose and lipoprotein metabolism, and reduces diastolic blood pressure. J Clin Endocrinol Metab. 1997;82(3):727–734. doi: 10.1210/jcem.82.3.3809. [DOI] [PubMed] [Google Scholar]
- 17.Svensson J, Fowelin J, Landin K, Bengtsson BA, Johansson JO. Effects of seven years of GH-replacement therapy on insulin sensitivity in GH-deficient adults. J Clin Endocrinol Metab. 2002;87(5):2121–2127. doi: 10.1210/jcem.87.5.8482. [DOI] [PubMed] [Google Scholar]
- 18.Hwu CM, Kwok CF, Lai TY, et al. Growth hormone (GH) replacement reduces total body fat and normalizes insulin sensitivity in GH-deficient adults: a report of one-year clinical experience. J Clin Endocrinol Metab. 1997;82(10):3285–3292. doi: 10.1210/jcem.82.10.4311. [DOI] [PubMed] [Google Scholar]
- 19.Kotler DP, Muurahainen N, Grunfeld C, et al. Effects of growth hormone on abnormal visceral adipose tissue accumulation and dyslipidemia in HIV-infected patients. J Acquir Immune Defic Syndr. 2004;35(3):239–252. doi: 10.1097/00126334-200403010-00004. [DOI] [PubMed] [Google Scholar]
- 20.Grunfeld C, Thompson M, Brown SJ, et al. Recombinant human growth hormone to treat HIV-associated adipose redistribution syndrome: 12 week induction and 24-week maintenance therapy. J Acquir Immune Defic Syndr. 2007;45(3):286–297. doi: 10.1097/QAI.0b013e3180691145. [DOI] [PubMed] [Google Scholar]
- 21.Lo JC, Mulligan K, Noor MA, et al. The effects of low-dose growth hormone in HIV-infected men with fat accumulation: a pilot study. Clin Infect Dis. 2004;39(5):732–735. doi: 10.1086/422725. [DOI] [PMC free article] [PubMed] [Google Scholar]
- 22.Hoffman DJ, Wang Z, Gallagher D, Heymsfield SB. Comparison of visceral adipose tissue mass in adult African Americans and whites. Obes Res. 2005;13(1):66–74. doi: 10.1038/oby.2005.9. [DOI] [PubMed] [Google Scholar]
- 23.Koutkia P, Canavan B, Breu J, Toriani M, Kissko J, Grinspoon S. Growth hormone-releasing hormone in HIV-infected men with lipodystrophy: a randomized, controlled trial. JAMA. 2004;292(2):210–218. doi: 10.1001/jama.292.2.210. [DOI] [PubMed] [Google Scholar]
- 24.Lo J, Dolan SE, Kanter JR, et al. Effects of obesity, body composition, and adiponectin on carotid intima-media thickness in healthy women. J Clin Endocrinol Metab. 2006;91(5):1677–1682. doi: 10.1210/jc.2005-2775. [DOI] [PMC free article] [PubMed] [Google Scholar]
- 25.Wu AW, Revicki DA, Jacobson D, Malitz FE. Evidence for reliability, validity and usefulness of the Medical Outcomes Study HIV Health Survey (MOS-HIV) Qual Life Res. 1997;6(6):481–493. doi: 10.1023/a:1018451930750. [DOI] [PubMed] [Google Scholar]
- 26.Delate T, Coons SJ. The use of 2 health-related quality-of-life measures in a sample of persons infected with human immunodeficiency virus. Clin Infect Dis. 2001;32(3):E47–E52. doi: 10.1086/318492. [DOI] [PubMed] [Google Scholar]
- 27.Djurhuus CB, Gravholt CH, Nielsen S, Pedersen SB, Moller N, Schmitz O. Additive effects of cortisol and growth hormone on regional and systemic lipolysis in humans. Am J Physiol Endocrinol Metab. 2004;286(3):E488–E494. doi: 10.1152/ajpendo.00199.2003. [DOI] [PubMed] [Google Scholar]
- 28.Ottosson M, Vikman-Adolfsson K, Enerback S, Elander A, Bjorntorp P, Eden S. Growth hormone inhibits lipoprotein lipase activity in human adipose tissue. J Clin Endocrinol Metab. 1995;80(3):936–941. doi: 10.1210/jcem.80.3.7883853. [DOI] [PubMed] [Google Scholar]
- 29.Richelsen B, Pedersen SB, Borglum JD, Moller-Pedersen T, Jorgensen J, Jorgensen JO. Growth hormone treatment of obese women for 5 wk: effect on body composition and adipose tissue LPL activity. Am J Physiol. 1994;266(2 pt 1):E211–E216. doi: 10.1152/ajpendo.1994.266.2.E211. [DOI] [PubMed] [Google Scholar]
- 30.Schwarz JM, Mulligan K, Lee J, et al. Effects of recombinant human growth hormone on hepatic lipid and carbohydrate metabolism in HIV-infected patients with fat accumulation. J Clin Endocrinol Metab. 2002;87(2):942. doi: 10.1210/jcem.87.2.8391. [DOI] [PubMed] [Google Scholar]
- 31.Brandou F, Aloulou I, Razimbaud A, Fedou C, Mercier J, Brun JF. Lower ability to oxidize lipids in adult patients with growth hormone (GH) deficiency: reversal under GH treatment. Clin Endocrinol (Oxf) 2006;65(4):423–428. doi: 10.1111/j.1365-2265.2006.02578.x. [DOI] [PubMed] [Google Scholar]
- 32.Dolan SE, Frontera W, Librizzi J, et al. The effects of a supervised home-based aerobic and progressive resistance training regimen in HIV-infected women: a randomized trial. Arch Intern Med. 2006;166(11):1225–1231. doi: 10.1001/archinte.166.11.1225. [DOI] [PMC free article] [PubMed] [Google Scholar]
- 33.Hadigan C, Corcoran C, Basgoz N, Davis B, Sax P, Grinspoon S. Metformin in the treatment of HIV lipodystrophy syndrome: a randomized controlled trial. JAMA. 2000;284(4):472–477. doi: 10.1001/jama.284.4.472. [DOI] [PubMed] [Google Scholar]
- 34.Hadigan C, Yawetz S, Thomas A, Havers F, Sax PE, Grinspoon S. Metabolic effects of rosiglitazone in HIV lipodystrophy: a randomized controlled trial. Ann Intern Med. 2004;140(10):786–794. doi: 10.7326/0003-4819-140-10-200405180-00008. [DOI] [PubMed] [Google Scholar]
- 35.Lo JC, Mulligan K, Noor MA, et al. The effects of recombinant human growth hormone on body composition and glucose metabolism in HIV-infected patients with fat accumulation. J Clin Endocrinol Metab. 2001;86(8):3480–3487. doi: 10.1210/jcem.86.8.7785. [DOI] [PubMed] [Google Scholar]
- 36.Falutz J, Allas S, Kotler D, et al. A placebo-controlled, dose-ranging study of a growth hormone releasing factor in HIV-infected patients with abdominal fat accumulation. AIDS. 2005;19(12):1279–1287. doi: 10.1097/01.aids.0000180099.35146.30. [DOI] [PubMed] [Google Scholar]
- 37.Falutz J, Allas S, Blot K, et al. Metabolic effects of a growth hormone releasing factor in patients with HIV. N Engl J Med. 2007;357(23):2359–2370. doi: 10.1056/NEJMoa072375. [DOI] [PubMed] [Google Scholar]
- 38.Soares DV, Spina LD, de Lima Oliveira Brasil RR, et al. Carotid artery intima-media thickness and lipid profile in adults with growth hormone deficiency after long-term growth hormone replacement. Metabolism. 2005;54(3):321–329. doi: 10.1016/j.metabol.2004.09.011. [DOI] [PubMed] [Google Scholar]
- 39.Colao A, Di Somma C, Rota F, et al. Short-term effects of growth hormone (GH) treatment or deprivation on cardiovascular risk parameters and intima-media thickness at carotid arteries in patients with severe GH deficiency. J Clin Endocrinol Metab. 2005;90(4):2056–2062. doi: 10.1210/jc.2004-2247. [DOI] [PubMed] [Google Scholar]
- 40.Colao A, Di Somma C, Cuocolo A, et al. Does a gender-related effect of growth hormone (GH) replacement exist on cardiovascular risk factors, cardiac morphology, and performance and atherosclerosis? results of a two-year open, prospective study in young adult men and women with severe GH deficiency. J Clin Endocrinol Metab. 2005;90(9):5146–5155. doi: 10.1210/jc.2005-0597. [DOI] [PubMed] [Google Scholar]
- 41.Napolitano LA, Schmidt D, Gotway MB, et al. Growth hormone enhances thymic function in HIV-1-infected adults. J Clin Invest. 2008;118(3):1085–1098. doi: 10.1172/JCI32830. [DOI] [PMC free article] [PubMed] [Google Scholar]
- 42.Carr DB, Utzschneider KM, Boyko EJ, et al. A reduced-fat diet and aerobic exercise in Japanese Americans with impaired glucose tolerance decreases intra-abdominal fat and improves insulin sensitivity but not beta-cell function. Diabetes. 2005;54(2):340–347. doi: 10.2337/diabetes.54.2.340. [DOI] [PubMed] [Google Scholar]
- 43.Fujimoto WY, Jablonski KA, Bray GA, et al. Body size and shape changes and the risk of diabetes in the diabetes prevention program. Diabetes. 2007;56(6):1680–1685. doi: 10.2337/db07-0009. [DOI] [PMC free article] [PubMed] [Google Scholar]
- 44.Park HS, Lee K. Greater beneficial effects of visceral fat reduction compared with subcutaneous fat reduction on parameters of the metabolic syndrome: a study of weight reduction programmes in subjects with visceral and subcutaneous obesity. Diabet Med. 2005;22(3):266–272. doi: 10.1111/j.1464-5491.2004.01395.x. [DOI] [PubMed] [Google Scholar]
- 45.Snyder S. Regulatory considerations for the treatment of lipodystrophy. In: Cheng B, Miller V, editors. Forum for Collaborative HIV Research Roundtable Discussion. George Washington University School of Public Health and Health Services; Washington, DC: 2004. [Google Scholar]