

Abstract
Differential Mobility Spectrometry (DMS), also commonly referred to as High Field Asymmetric Waveform Ion Mobility Spectrometry (FAIMS) is a rapidly advancing technology for gas phase ion separation. The interfacing of DMS with Mass Spectrometry (MS) offers potential advantages over the use of mass spectrometry alone. Such advantages include improvements to mass spectral signal/noise, orthogonal/complementary ion separation to mass spectrometry, enhanced ion and complexation structural analysis, and the potential for rapid analyte quantitation. In this report, we demonstrate the successful use of our nanoESI-DMS-MS system, with a methanol drift gas modifier, for the separation of oligosaccharides. The tendency for ESI to form oligosaccharide aggregate ions and the negative impact this has on nanoESI-DMS-MS oligosaccharide analysis is described. In addition, we demonstrate the importance of sample solvent selection for controlling nanoESI oligosaccharide aggregate ion formation and its effect on glycan ionization and DMS separation. The successful use of a tetrachloroethane/methanol solvent solution to reduce ESI oligosaccharide aggregate ion formation while efficiently forming a dominant MH+ molecular ion is presented. By reducing aggregate ion formation in favor of a dominant MH+ ion, DMS selectivity and specificity is improved. In addition to DMS, we would expect the reduction in aggregate ion complexity to be beneficial to the analysis of oligosaccharides for other post ESI separation techniques such as mass spectrometry and ion-mobility. The solvent selected control over MH+ molecular ion formation, offered by the use of the tetrachloroethane/methanol solvent, also holds promise for enhancing MS/MS structural characterization analysis of glycans.
Keywords: nanoelectrospray, oligosaccharides, ion mobility, differential mobility, FAIMS, aggregate, cluster
Introduction
Differential Mobility Spectrometry[1], also referred to as High Field Asymmetric Waveform Ion Mobility Spectrometry (FAIMS)[2], and Field Ion Spectrometry (FIS)[3] is a rapidly advancing technology for gas phase ion separation. DMS has the potential to emerge as a major stand alone separation science technique such as LC or GC. Many researchers have focused on interfacing DMS to mass spectrometry due to its atmospheric pressure, gas phase, continuous, ion separation capabilities and the detection specificity offered by mass spectrometry. In this study, we investigate the use of a specially designed nanoESI-DMS-MS system for the analysis of oligosaccharides. Glycosylation of proteins has been demonstrated to play a significant role in their biological function[4-7]. Characterization of glycoprotein glycan groups is essential to understanding how they influence protein function[8-10]. ESI-MS has become a popular analysis platform for characterizing oligosaccharides due to it’s compatibility with up stream separation techniques such as liquid chromatography and capillary electrophoresis, as well as the structure rich information provided by MSn techniques[8-10]. In this study we demonstrate the successful use of nanoESI-DMS-MS, with a methanol drift gas modifier, for the separation of oligosaccharides. In addition, we demonstrate the importance of sample solvent selection in glycan cluster ion formation and its effects on glycan ionization and DMS separation.
DMS is related to, but is fundamentally different, from conventional time-of-flight ion mobility spectrometry. In conventional ion mobility spectrometry, ion identification is related to effective ion cross section, resulting in differences in flight times. In DMS, ion identification is related to changes in effective cross section based on the propensity of the ion to cluster/decluster, resulting in differences in applied compensation voltage values. In DMS an asymmetric electric field waveform is applied to two parallel electrode plates enabling the ions to pass through in a continuous, non pulsed, manner. The electrical waveform consists of a high field duration of one polarity and then a low field duration of opposite polarity, such that the integrated voltage-time being applied to the electrode is zero[11]. Figure 1 demonstrates the high and low voltages of opposite polarity applied to generate the asymmetric electrical waveform (identified as an Rf voltage, correlating to the high voltage value). As can be seen, after one cycle of the waveform the average voltage applied to the electrode is zero, however the ion’s mobility in this asymmetric electric field displays a net movement towards the bottom (grounded) electrode plate. Since an ion may experience a net mobility towards one of the electrode plates during its travel between the plates, a compensation voltage (Vc) is applied to maintain a safe trajectory through the plates without striking them. In this manner the DMS sensor acts as a tunable ion filter, where varying the applied waveform (Rf) and compensation voltages (Vc), allows for selective ion transmission through the sensor. In DMS ions are separated at pressures sufficient for the occurrence of collisions between ions and the neutral gas molecules. The smaller the ion the fewer collisions it will experience as it is pulled through the drift gas. Because of this, ion cross sectional area plays a significant role in its mobility through the drift gas[11,12].
Figure 1.
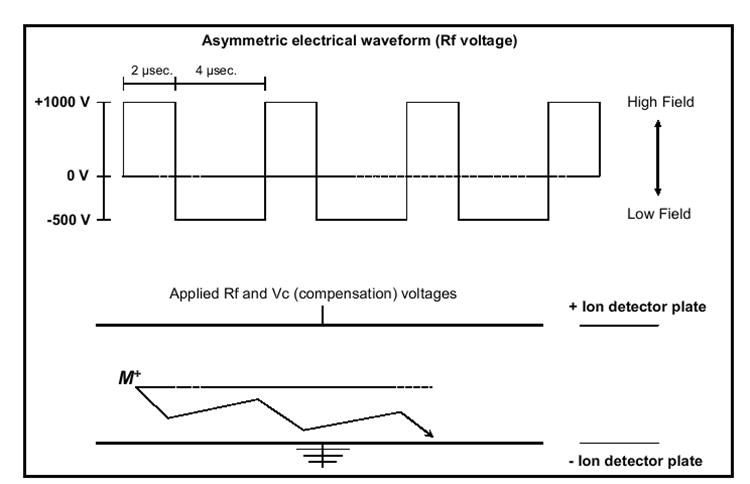
An ion trajectory between two parallel electrode plates as it experiences the asymmetric electrical waveform of +1000 V for 2 μsec then -500 V for 4μsec.
ESI-MS analysis of oligosaccharides and glycans has become a powerful tool for both structural characterization and quantitation. Although ESI-MS is a popular choice for glycan analysis, poor ionization efficiency of many native glycan molecules in positive mode ESI has led researchers to investigate ways to improve glycan ionization[13-16]. Due to the poor basicity of glycans, formation of sufficient MH+ ion abundance in positive mode ESI is difficult to achieve[13-16]. Negative mode ESI offers ionization advantages for the analysis of glycans, however positive mode ESI is also desirable due to its capability to generate different MS/MS glycan ion fragmentation than typically observed in negative mode ESI-MS/MS[17,18]. In order to improve positive mode ESI ionization of glycans, derivatization of glycans with molecules containing basic sites has been employed[19]. While this approach has been successful, it increases the complexity of sample preparation, such that many researchers have explored other means by which analysis of underivatized glycans can be performed in positive mode ESI[13,17,18, 21]. It has been found that the formation of metal and ammonium ion complexes, such as MNa+ and MNH4+, form readily with contaminant/residual cations in the ESI solution[14,20]. As a result, many of these glycan-cation complexes have been utilized as the molecular ions for analysis via the introduction of salts at low mM concentrations into the ESI solution to maintain consistent ionization efficiency and generate structurally informative MS/MS fragmentation patterns[13,15,16,17,18,21-25]. Harvey et. al. reported that MH+ glycan ions fragment differently than their MNa+ and MLi+ ion counterparts[15,18]. The MS/MS spectrum of the MH+ ion was less complex and primarily made up of glycosidic cleavages, whereas the sodium and lithium adduct ions resulted in more complex MS/MS spectra with cross ring cleavages in addition to the glycosidic cleavages.[15,18].
Gabryelski et al. investigated the use of ESI-FAIMS-MS for oligosaccharide separation, and explored the addition of various salts to the sample solvent solutions for their effects on ionization and FAIMS selectivity[22]. They observed with an individual oligosaccharide sample (MW 512), the ESI formation of numerous oligosaccharide aggregate ions up to the limit of their m/z scan range (m/z 2000). While the most abundant ions formed for this sample were [MNH4]+, [MNa]+, [MK]+, in that order, examples of some aggregate ions of high abundance were [M2Na]+, [M2NH4]+, [M 5(NH4)2]2+, [M5(NH4)Na]2+, [M3Na]+, [M3NH4]+, and [M10(NH4)3]3+. The formation of aggregate ions was problematic for them, as fragmentation would occur at the FAIMS-MS interface, resulting in poor FAIMS specificity. They state, “As a result, the [MNH4]+ would be detected not only at its original transmission CV of (2.9 V) but also at CVs where ions associated with their fragmentation product [MNH4]+ are transmitted through FAIMS. Low energy conditions at the mass spectrometer interface help to differentiate ions formed in ESI from their dissociation products.”[22] In our study, we also observed oligosaccharide aggregate ion formation and dissociation at the MS interface. However, instead of relying on low energy cone voltage settings of the mass spectrometer to reduce aggregate ion dissociation at the DMS-MS interface, we explored the use of various sample solvent systems to reduce aggregate ion formation in the ESI process. In this study we demonstrate the successful use of a tetrachloroethane/methanol solvent solution to reduce ESI oligosaccharide aggregate ion formation while efficiently forming a dominant MH+ protonated molecule. By reducing aggregate ion formation, optimized MS cone voltage settings for maximum analyte ion abundance can be used without any negative effects on DMS selectivity and specificity. In addition to DMS and FAIMS, we would expect that our approach of reducing aggregate ion complexity would be beneficial to the analysis of oligosaccharides for other post ESI separation techniques such as ion-mobility[23]. Based on the findings of Harvey et al., differences in MH+ and MNa+ fragmentation patterns of glycans, solvent selected control over MH+ molecular ion formation may provide benefits for performing structural characterization analysis of glycans[18].
EXPERIMENTAL
Instrumentation
The nanoESI-DMS-MS system encompasses a modified Sionex Corporation microDMx™ differential mobility sensor (Sionex SDP-1), a Micromass ZQ detector, and a custom made nanospray source. The ESI source consists of a Valco microconnector union attached to a Newport micro movement plate with XYZ directional control. The ESI voltage is applied to the union where a liquid-liquid junction is created between peek tubing and a Proxeon nanobore steel emitter (part # ES301). The small size of the DMS sensor, approximately 3” in length, 1” in height, and ¼” in width, simplified interfacing to the mass spectrometer inlet. Samples were directly infused into the nanospray source via a Harvard syringe pump at a flow of 350 nL/min. Sample analysis was performed in positive mode nanospray at a capillary voltage of 2 kV. A cone voltage of 40 V was applied to the inlet cone, and the inlet source temperature in the mass spectrometer was set to 50 °C. Design details and a schematic of our nanoESI-DMS-MS system have been presented previously[26]. The vacuum generated by the mass spectrometer provided the gas flow (measured at approx. 1 L/min) through the sensor and into the mass spectrometer. A drift gas line opposite the sensor inlet had a constant flow of ultra high purity nitrogen at approximately 0.52 L/min (with or without the addition of modifier). A methanol drift gas modifier was introduced for selected tests at an approximate concentration of 8000 ppm of the total gas flow through the sensor. The design and operational details of the Sionex Corporation differential mobility sensors have been described previously[11,21,22]. For this study, the sensor was operated at ambient laboratory temperature.
Materials and Reagents
Oligosaccharide analytes maltopentaose and maltoheptaose were purchased from Sigma-Aldrich Corp., St. Louis, MO. Lacto-N-fucopentaose I (LNFP I) and lacto-N-fucopentaose II (LNFP II) oligosaccharides were purchased from GLYKO Inc., Novato, CA. HPLC grade water (Sigma), HPLC grade methanol (Sigma), and tetrachloroethane (Sigma) were used for sample preparation. NaCl used for sample solutions was purchased from J.T. Baker. 0.25 mg/ml oligosaccharide samples were prepared in solutions of either 50/50 water/methanol, 50/50 water/methanol with 2mM NaCl, methanol, methanol with 2mM NaCl, or 60/40 methanol/tetrachloroethane.
Procedures
For each sample tested, a selected ion DMS spectrum was generated as follows. For a selected Rf voltage of either 1250 or 1500 V, the compensation voltage was scanned from -25 to +5 V, in 0.12 V increments, over 4.2 minutes. The MS signal was collected for the m/z range of 200 – 2000 during the Vc scan. For any ion of interest (within m/z 200 – 2000), a DMS spectrum was generated from the selected ion MS signal. After the generation of selected ion DMS spectra, mass spectra were collected with the compensation voltage set to selected values. The Vc selected mass spectra are a 30 second average of the 0.36 second mass scans. Mass spectra were also collected for each sample condition with the DMS turned off, allowing all the ions to enter the mass spectrometer.
RESULTS/DISCUSSION
Oligosaccharide ionization and DMS separation
Maltopentaose was selected as a test compound to evaluate the effects of various solvent compositions on the ESI formation of MH+ and MNa+ molecular ions, as well as aggregate ion formation and their effects on DMS separation. We have previously explored the use of polar drift gas modifiers to aid in the DMS separation of various compounds, and have found them particularly beneficial in the DMS analysis of large polar molecules such as peptides/proteins[26, 27]. In this study we explore the use of 8000 ppm methanol as our drift gas modifier to improve the DMS separation capabilities of our oligosaccharide analytes. Figures 2a & c demonstrate the ions generated with use of a 50/50 methanol/water solvent composition, with and without 2 mM NaCl, on the nanospray ionization of 0.25 mg/ml maltopentaose (DMS turned off, no ion selection). In both solvent systems the m/z 852 MNa+ ion is the most dominant peak in the mass spectrum. To minimize Na+ ion contamination in our system, all non NaCl containing solvent systems were analyzed prior to the NaCl containing solvents. As demonstrated in Figure 2a, with the use of just 50/50 methanol/water, residual Na+ ion contamination dominates the formation of the m/z 852 MNa+ ion (2.4e6 ion count) over the m/z 830 MH+ ion (1.8e5 ion count). Figure 2c demonstrates that the addition of 2 mM NaCl to the solvent did not result in a significant increase to the MNa+ ion (2.98e6 ion count), but did demonstrate a decrease of the m/z 830 ion signal to that of the spectral noise. The mass spectra in Figures 2b & d are for the same samples as Figures 2a & c, but with the use of the 8000 ppm methanol drift gas modifier, which resulted in a near 2-fold increase to the ion abundance of the MNa+ ion. For all spectra in Figure 2 it is evident that numerous ions, in high abundance, are present in addition to the m/z 852 MNa+ ion. Many of these ions correspond to maltopentaose-sodium aggregate ion m/z values, Table 1 lists the aggregate ion species and their m/z value. The m/z 852 ion signal may not represent solely the MNa+ ion, but actually be the result of various (nM +nNa)n+ ion formations.
Figure 2.
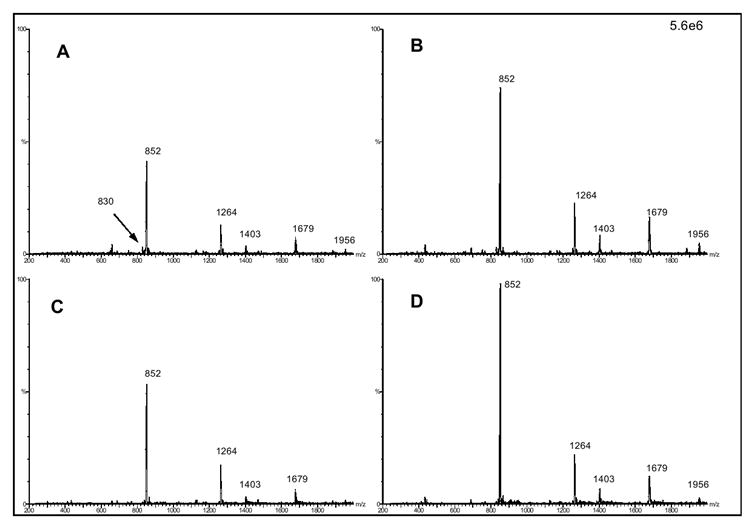
(a) Mass spectra (DMS turned off) of 0.25 mg/ml maltopentaose in 50/50 wat/meth, (b) same but with 8000 ppm methanol drift gas modifier, (c) 0.25 mg/ml maltopentaose in 50/50 wat/meth 2 mM NaCl, (d) same but with 8000 ppm methanol drift gas modifier. All spectra normalized to same ion signal scale.
Table 1.
Maltopentaose-sodium aggregate ion species and corresponding m/z value
| m/z | Likely aggregate ion species |
|---|---|
| 1264 | (3M + 2Na)2+ or (6M + 4Na)4+ , etc. |
| 1403 | (5M + 3Na)3+ |
| 1679 | (2M + Na)+ |
| 1956 | (7M + 3Na)3+ |
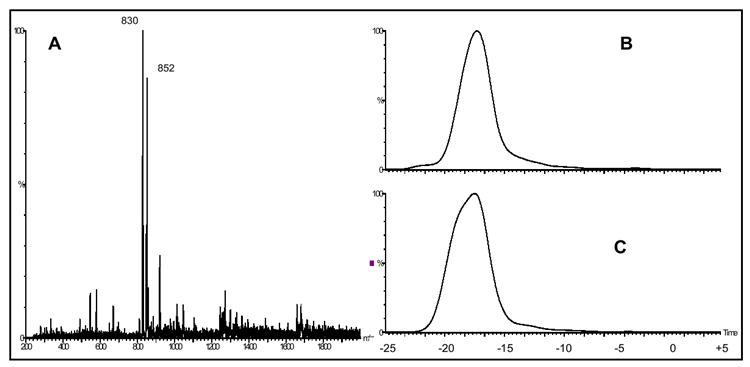
Due to the nature of differential mobility spectrometry, in that separation takes place post ionization, the formation of numerous aggregate/cluster ions by ESI creates an unnecessarily complex ion population. We demonstrate an approach to overcome aggregate/cluster ion formation via ESI, reducing sample complexity and improving specificity in the DMS analysis of oligosaccharides. First, we investigated the DMS separation of the maltopentaose m/z 852 MNa+ ion, as well as many of the observed maltopentaose-sodium aggregate ions. Figures 3(a-e) demonstrate the selected ion DMS spectra for the m/z 1956 ion (a), m/z 1679 ion (b), m/z 1403 ion (c), m/z 1264 ion (d), and m/z 852 ion (e), all generated from the 0.25 mg/ml maltopentaose sample in 50/50 methanol/water, with and without the use of the 8000 ppm methanol drift gas modifier. The selected ion DMS spectra in Figure 3 were collected by scanning the compensation voltage (Vc) from -25 to +5 V at an Rf of 1500 V. All of the DMS spectra on the left side of Figure 3 are generated without the use of the methanol drift gas modifier, whereas all of the spectra on the right are with the use of the methanol drift gas modifier. As can be seen, the use of the drift gas modifier provided a shift in signal to larger negative Vc values for all selected ions of interest and, in addition, resulted in the generation of multiple DMS spectral peaks for each ion over a large Vc range. We have previously demonstrated the use of polar drift gas modifiers to reduce the clustering of peptides and improve DMS separation analysis[26]. We hypothesize, that the methanol drift gas modifier interacts with the maltopentaose-sodium aggregate ions in the gas phase, and competes with the H-bonding and Van der Waals forces driving the clustering, and in turn facilitates cluster dissociation and reduced ion cross sections, increasing the DMS separation capabilities. As discussed previously, and observed by Gabryelski et. al.[22], the multiple DMS spectra peaks observed for each ion are generated by either the Vc position of the selectedion itself or the ion signal of a fragment ion dissociated from a larger cluster ion transmitted at a lower Vc position. Figures 4(a & b) demonstrate mass spectra at selected compensation voltages for the DMS spectra shown in figure 3. Figure 4a shows the mass spectra collected with the Vc set to -21.8 V, corresponding to the apex of the left most DMS spectrum peak in Figure 3e (with methanol). Figure 4b shows the mass spectra collected at a Vc setting of -16 in each of Figures 3b-e (with methanol). The comparison between the mass spectra in Figure 4 reflects what is assumed to be the DMS separation of the m/z 852 MNa+ ion (Vc = -21.8 V) from larger aggregate ions (Vc = -16). Of significance, is the comparison between the m/z 852 ion abundance in Figures 4a and 4b, which imply, along with the separate peaks observed in Figure 3e (methanol), that a significant portion of the total m/z 852 ion abundance observed in Figure 2b is the result of (nM +nNa)n+ aggregate ions with a m/z of 852, and/or non (nM +nNa)n+ aggregate ion dissociation at the MS inlet resulting in the formation of a m/z 852 ion.
Figures 3.
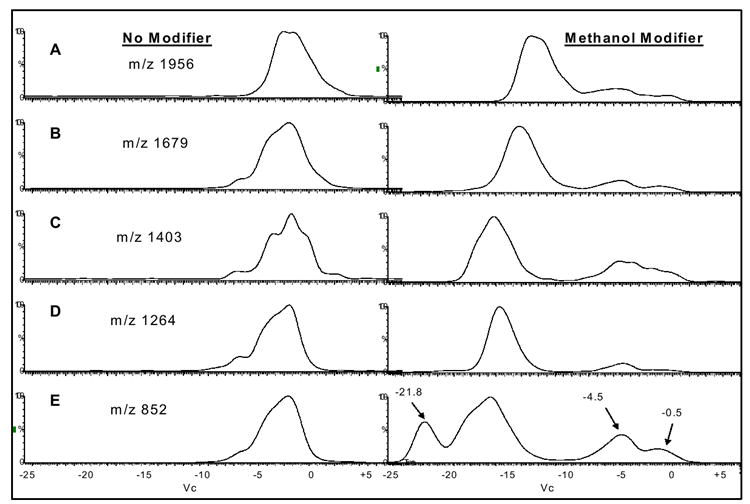
0.25 mg/ml maltopentaose in 50/50 methanol/water, selected ion DMS spectra for the m/z 1956 ion (a), m/z 1679 ion (b), m/z 1403 ion (c), m/z 1264 ion (d), and m/z 852 ion (e). Rf set to 1500 V and Vc scanned from -25 to +5 V. (left side without drift gas modifier, right side with 8000 ppm methanol)
Figure 4.
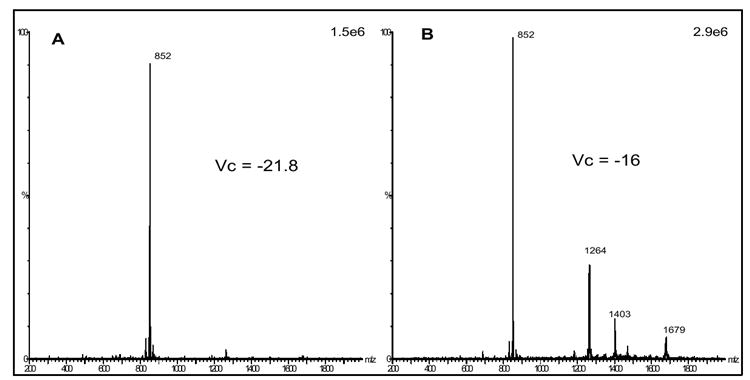
mass spectra for 0.25 mg/ml maltopentaose in 50/50 methanol/water at selected compensation voltages from analysis in Figure 3 (with methanol drift gas modifier), -21.8 V (a), and -16 V (b) with Rf set to 1500 V.
Two DMS spectral peaks are observed for all of the selected m/z values in Figures 3a-e (with methanol drift gas modifier) at approximate Vc values of -4.5 and -0.5. These two spectral peaks are likely the result of maltopentaose-sodium aggregate ions with larger cross sections than the m/z 1956 (7M + 3Na)3+ ion. It is also possible that multiple spectral peaks for a selected ion signal could be the result of the DMS separation of different maltopentaose-sodium aggregate ions with identical m/z values but different cross sections, such as (2M + Na)+ and (4M + 2Na)2+, both with m/z 1679. The presence of multiple DMS spectral peaks for a selected ion signal increases the complexity for accurate oligosaccharide analysis by ESI-DMS-MS. Gabryelski et. al., overcame this problem by decreasing the MS inlet voltage settings, in turn reducing dissociation of aggregate ions as they pass through the MS inlet, and eliminating the generation of multiple compensation voltage spectral peaks for a selected ion. Our concern with using this approach is that the appropriate MS inlet voltage settings are likely to be ion specific, requiring a screening approach to determine when aggregate ion dissociation is eliminated. This becomes problematic when analyzing unknown oligosaccharides, where specificity of the ion in question (monomer or aggregate) becomes blurred. In addition, the reduction of the MS inlet voltages typically results in decreased analyte ion signal, which is significant for compounds such as oligosaccharides that often exhibit poor ionization efficiency in positive ESI. To circumvent this problem, we explored the use of various sample solvent systems to reduce the formation of oligosaccharide aggregate ions and improve the ion concentration of a single molecular ion.
Oligosaccharide aggregate ion reduction
We hypothesized that the water present in our 50/50 methanol/water sample solvent may be a driving force for the formation of aggregate ions. Thus, as a first step, we prepared 0.25 mg/ml maltopentaose samples in 100% methanol with and without 2 mM NaCl. However, simple removal of water from the sample solution did not result in the reduction of aggregate ion formation. All of the data for the 100% methanol conditions, both ion formation and DMS separation of the various ions, appeared consistent with what was observed for the 50/50 methanol/water sample solvent conditions (data not shown).
A second approach for reducing the formation of aggregate ions by modifying the sample solvent was investigated. Of significance is that all of the abundant aggregate ions observed in Figure 2 are the result of maltopentaose-Na+ complexation and not maltopentaose-H+ aggregates (dimer, trimer, etc.). The use of the solvent tetrachloroethane as part of our sample solution was investigated with the hypothesis that it would act as a chelating agent for residual Na+ and other interfering cations, reducing aggregate ion formation and enhancing the ESI formation of the molecular MH+ ion. However, the use of 100% tetrachloroethane as the sample solvent was not successful because the solvent is not hydrophilic enough to solubilize maltopentaose. On the other hand, since methanol and tetrachloroethane are miscible with one another a solution of 60/40 methanol/tetrachloroethane was explored next and proved to provided sufficient hydrophilicity for this purpose. Figures 5(a-c) demonstrate the mass spectra (DMS turned off) for the 0.25 mg/ml maltopentaose sample in 60/40 methanol/tetrachloroethane with the 8000 ppm methanol drift gas modifier (a), the m/z 852 selected ion DMS spectra at Rf= 1500 (b), and the m/z 830 selected ion DMS spectra at Rf = 1500 (c). The use of the methanol/tetrachloroethane sample solvent resulted in the ESI formation of a dominant m/z 830 MH+ molecular ion. Compared to Figure 2c the m/z 830 ion abundance in Figure 5a is approximately 6.5 fold greater, whereas the m/z 852 MNa+ ion abundance decreased around 4.8 fold. In addition, only a single m/z 852 peak is present in Figure 5b compared to the multiple peaks in Figure 3e, demonstrating a reduction in the ESI formation of numerous maltopentaose-sodium aggregate ions. With the successful reduction of aggregate ion formation through the use of the 60/40 methanol/tetrachloroethane solution, the use of this sample solvent to aid in the DMS separation of two different oligosaccharides was investigated.
Figure 5.
(a) mass spectra of 0.25 mg/ml maltopentaose in 60/40 meth/tetrachloroethane, with 8000 ppm methanol dopant (DMS turned off), (b) m/z 852 selected ion DMS spectra at Rf = 1500, and (c) m/z 830 selected ion DMS spectra at Rf = 1500.
The use of the 60/40 methanol/tetrachloroethane sample solvent provided the desired results with regards to molecular MH+ ion formation and reduction in aggregate ion formation. It appears that the formation of salt bridges is a major component to the formation of oligosaccharide aggregate ions. While the use of tetrachloroethane resulted in lower ion abundance for analyte detection, these improvements enabled the generation of a single DMS spectrum peak, as presented in Figure 5, compared to the multiple peaks related to aggregate ion dissociation, as presented in Figure 3. The generation of a single DMS spectral peak, for a given analyte, improves the capability to distinguish the optimum DMS conditions for the separation of two or more oligosaccharides. An oligosaccharide mixture of 0.25 mg/ml each of maltopentaose and maltoheptaose (MW 1153) was prepared in the 60/40 methanol/tetrachloroethane solvent and was used to investigate DMS separation of two oligosaccharides. Figures 6(a-e) shows (a) the mass spectra (DMS turned off) for the maltopentaose/ maltoheptaose sample with the 8000 ppm methanol drift gas modifier, (b) the m/z 1154 selected ion DMS spectra at Rf = 1250, (c) the m/z 830 selected ion DMS spectra at Rf = 1250, (d) the mass spectra collected with the Vc set to -12.5 (Rf = 1250), and (e) the mass spectra collected with the Vc set to -8.7 V (Rf = 1250). As demonstrated in Figure 6a, the two most abundant ions present are the m/z 1154 maltoheptaose MH+ ion and the m/z 830 maltopentaose MH+ ion. The use of the tetrachloroethane/methanol solution resulted in a single DMS spectral peak for each oligosaccharide MH+ ion signal. Unlike the DMS spectra shown in Figure 3e, unambiguous identification for each analyte’s spectral peak position can be made in Figures 6b & c. A clear separation of peak apex Vc’s exists between maltopentaose (-12.5 V) and maltoheptaose (-8.7 V). The mass spectra collected with the Vc set to the respective peak apex’s, shown in Figures 6d & e, demonstrate the DMS separation of the maltopentaose and maltoheptaose MH+ ions.
Figure 6.
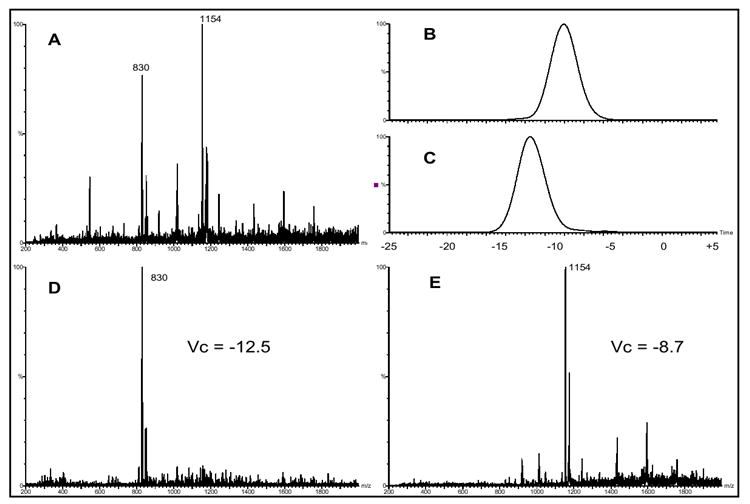
(a) mass spectra (DMS turned off) of 0.25 mg/ml each maltopentaose and maltoheptaose in 60/40 methanol/tetrachlorethane with the 8000 ppm methanol drift gas modifier, (b) the m/z 1154 selected ion DMS spectra at Rf = 1250, (c) the m/z 830 selected ion DMS spectra at Rf = 1250, (d) the mass spectra collected with the Vc set to -12.5 (Rf = 1250), and (e) the mass spectra collected with the Vc set to -8.7 V (Rf = 1250)
Oligosaccharide isomer separation
To further investigate the potential for DMS separation of oligosaccharides, the isomers LNFP I and LNFP II (MW 854) were prepared separately in 60/40 methanol/tetrachlorethane and analyzed with 8000 ppm methanol drift gas modifier. No difference in DMS spectral peak position was observed for the two LNFP MH+ ions. Their selected ion DMS spectral peak apex Vc’s at Rf = 1250 and Rf = 1500 were the same (data not shown). Figure 7a-c demonstrate the mass spectra (DMS turned off) for the 0.25 mg/ml LNFP I sample with the 8000 ppm methanol drift gas modifier (a), the LNFP I sample m/z 855 selected ion DMS spectra at Rf = 1250 (b), and the collected mass spectra for Vc = -8.7 V (c). Consistent with the data obtained with maltopentaose and maltoheptaose, the use of the 60/40 methanol/tetrachloroethane solution for LNFP I & II provided the dominant ESI formation of the oligosaccharide MH+ ion and a single DMS spectral peak. The selected ion DMS spectrum in Figure 7b has a signal to noise ratio of approximately 688 for the observed peak. In contrast, the mass spectral signal to noise ratio for the m/z 855 ion in Figure 7a is approximately 28. This improvement in signal/noise demonstrates the power of DMS to separate background ion noise and improve sensitivity for the ion of interest. Previously we have demonstrated the use of a rapid Vc scanning platform (10 s or less) for quantitative analysis of peptides [26]. The improvements to signal/noise and the rapid separation capabilities provided by this approach demonstrate promise for utilizing this rapid Vc scanning analysis platform for ultra-high throughput quantitative analysis.
Figure 7.
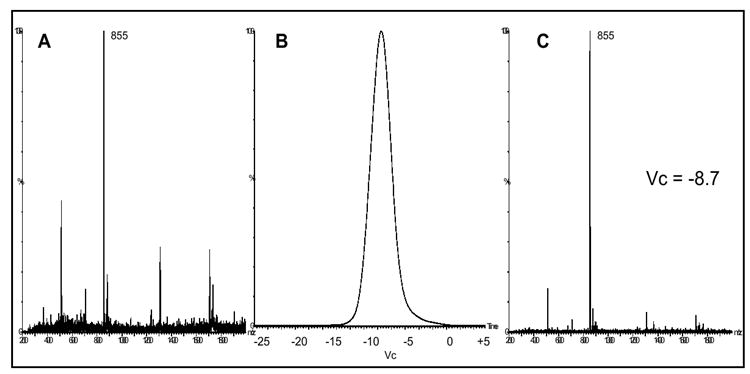
the mass spectra (DMS turned off) for the 0.25 mg/ml LNFP I sample in 60/40 methanol/tetrachloroethane with the 8000 ppm methanol drift gas modifier (a), the LNFP I sample m/z 855 selected ion DMS spectra at Rf = 1250 (b), and the collected mass spectra for Vc = -8.7 V (c).
Conclusion
In this study, we demonstrate the use of a novel nanoESI-DMS-MS system for the analysis of oligosaccharides. Of significant interest, is the demonstration of the importance of sample solvent selection in glycan cluster ion formation and its effects on glycan ionization and DMS separation. A tetrachloroethane/methanol solvent solution is introduced to reduce ESI oligosaccharide aggregate ion formation while efficiently forming a dominant MH+ molecular ion. By reducing aggregate ion formation, optimized MS cone voltage settings for maximum analyte ion abundance can be used without any negative affects on DMS separation analysis. In addition to DMS and FAIMS, we would expect this approach in reducing aggregate ion complexity to be beneficial to the analysis of oligosaccharides for other post ESI separation techniques such as ion-mobility[23]. In addition to the capability for stand alone nanoESI-DMS-MS oligosaccharide analysis, the results presented in this study reflect the potential for DMS based improvements to the specificity and signal-to-noise ratio for various types of MS based analyses, such as LC-MS and CE-MS. Based on Harvey et al.’s findings on differences in MH+ and MNa+ fragmentation patterns of glycans, solvent selected control over MH+ molecular ion formation may provide benefits for performing structural characterization analysis of glycans[18].
Acknowledgments
This work was supported in part by a grant (PV) from the National Institutes of Health (1RO1CA69390)
Footnotes
Publisher's Disclaimer: This is a PDF file of an unedited manuscript that has been accepted for publication. As a service to our customers we are providing this early version of the manuscript. The manuscript will undergo copyediting, typesetting, and review of the resulting proof before it is published in its final citable form. Please note that during the production process errors may be discovered which could affect the content, and all legal disclaimers that apply to the journal pertain.
References
- 1.Buryakov IA, Krylov EV, Nazarov EG, Rasulev UKh. International Journal of Mass Spectrometry and Ion Processes. 1993;128:143–148. [Google Scholar]
- 2.Purves RW, Guevremont R, Day S, Pipich CW, Matyjaszcyk MS. Rev of Sci Instrum. 1998;69:4094–4105. [Google Scholar]
- 3.Carnahan B, Day S, Kouznetsov V, Tarassov A. Proceedings of the fourth international workshop on Ion Mobility; Cambridge, MA. August 1995. [Google Scholar]
- 4.Elbein AD. Trends in Biotechnology. 1991;9:346–352. doi: 10.1016/0167-7799(91)90117-z. [DOI] [PubMed] [Google Scholar]
- 5.Broxterman HJ, Schurhuis GJ, Lankelma J. British Journal of Cancer. 1997;76:1029–1034. doi: 10.1038/bjc.1997.503. [DOI] [PMC free article] [PubMed] [Google Scholar]
- 6.Bossart KN, Wang LF, Eaton BT. Virology. 2001;290:121–135. doi: 10.1006/viro.2001.1158. [DOI] [PubMed] [Google Scholar]
- 7.Helenius A, Aebi M. Science. 2001;291:2364–2369. doi: 10.1126/science.291.5512.2364. [DOI] [PubMed] [Google Scholar]
- 8.Sheeley DM, Reinhold VN. Analytical Chemistry. 1998;70:3053–3059. doi: 10.1021/ac9713058. [DOI] [PubMed] [Google Scholar]
- 9.Charlwood J, Birrell H, Tolson D, Camilleri P. Analytical Chemistry. 1998;70:2530–2535. doi: 10.1021/ac9801059. [DOI] [PubMed] [Google Scholar]
- 10.Huang Y, Mechref Y, Novotny MV. Analytical Chemistry. 2001;73:6063–6069. doi: 10.1021/ac015534c. [DOI] [PubMed] [Google Scholar]
- 11.Miller RA, Eiceman GA, Nazarov EG, King AT. Sensors and Actuators B. 2000;67:300–306. [Google Scholar]
- 12.Miller RA, Nazarov EG, Eiceman GA, King AT. Sensors and Actuators A. 2001;91:307–318. [Google Scholar]
- 13.Harvey DJ. J Amer Soc Mass Spec. 2001;12:926–937. doi: 10.1016/S1044-0305(01)00268-9. [DOI] [PubMed] [Google Scholar]
- 14.Manfred Wuhrer M, Koeleman CAM, Deelder AM, Hokke CH. Anal Chem. 2004;76:833–838. doi: 10.1021/ac034936c. [DOI] [PubMed] [Google Scholar]
- 15.Harvey DJ. J Mass Spec. 2000;35:1178–1190. doi: 10.1002/1096-9888(200010)35:10<1178::AID-JMS46>3.0.CO;2-F. [DOI] [PubMed] [Google Scholar]
- 16.Li J, Purves RW, Richards JC. Anal Chem. 2004;76:4676–4683. doi: 10.1021/ac049850d. [DOI] [PubMed] [Google Scholar]
- 17.Weiskopf AS, Paul Vouros P, Harvey DJ. Anal Chem. 1998;70:4441–4447. doi: 10.1021/ac980289r. [DOI] [PubMed] [Google Scholar]
- 18.Harvey DJ. Rapid Comm Mass Spec. 2005;19(4):484–492. doi: 10.1002/rcm.1815. [DOI] [PubMed] [Google Scholar]
- 19.Lattová E, Snovida S, Perreault H, Krokhin O. J Amer Soc Mass Spectrom. 2005;16(5):683–696. doi: 10.1016/j.jasms.2005.01.021. [DOI] [PubMed] [Google Scholar]
- 20.Robbe C, Capon C, Coddeville B, Michalski JC. Rapid Comm Mass Spectrom. 2004;18:412–420. doi: 10.1002/rcm.1352. [DOI] [PubMed] [Google Scholar]
- 21.Bahr U, Pfenninger A, Karas M, Stahl B. Anal Chem. 1997;69(22):4530–4535. doi: 10.1021/ac970624w. [DOI] [PubMed] [Google Scholar]
- 22.Gabryelski W, Froese KL. J Amer Soc Mass Spectrom. 2003;14:265–277. doi: 10.1016/S1044-0305(03)00002-3. [DOI] [PubMed] [Google Scholar]
- 23.Clowers BH, Dwivedi P, Steiner WE, Hill HH, Bendiak B. J Amer Soc Mass Spectrom. 2005;16:660–669. doi: 10.1016/j.jasms.2005.01.010. [DOI] [PubMed] [Google Scholar]
- 24.Weiskopf AS, Vouros P, Harvey D. J Rapid Comm Mass Spectrom. 1997;11:1493–1504. doi: 10.1002/(SICI)1097-0231(199709)11:14<1493::AID-RCM40>3.0.CO;2-1. [DOI] [PubMed] [Google Scholar]
- 25.Sheeley DM, Reinhold VN. Anal Chem. 1998;70(14):3053–3059. doi: 10.1021/ac9713058. [DOI] [PubMed] [Google Scholar]
- 26.Levin DS, Miller RA, Nazarov EG, Vouros P. Anal Chem. 2006;78(15):5443–5452. doi: 10.1021/ac060003f. [DOI] [PubMed] [Google Scholar]
- 27.Levin DS, Vouros P, Miller RA, Nazarov EG, Morris JC. Anal Chem. 2006;78(1):96–106. doi: 10.1021/ac051217k. [DOI] [PubMed] [Google Scholar]