

Abstract
The DNA of all organisms is constantly damaged by oxidation. Among the array of damage products is 5-hydroxymethyluracil, derived from oxidation of the thymine methyl group. Previous studies have established that HmU can be a sensitive and valuable marker of DNA damage. More recently, the corresponding deoxynucleoside, 5-hydroxymethyl-2′-deoxyuridine (HmdU) has proven to be valuable for the introduction of controlled amounts of a single type of damage lesion into the DNA of replicating cells, which is subsequently repaired by the base excision repair pathway. Complicating the study of HmU formation and repair, however, is the known chemical reactivity of the hydroxymethyl group of HmU under conditions used to hydrolyze DNA. In the work reported here, this chemical property has been exploited by creating conditions that convert HmU to the corresponding methoxymethyluracil (MmU) derivative that can be further derivatized to the 3,5-bis-(trifluoromethyl)benzyl analog. This derivatized compound can be detected by gas chromatography-negative chemical ionization-mass spectrometry (GC-NCI-MS) with good sensitivity. Using isotopically enriched exogenous HmdU and human osteosarcoma cells (U2OS) in culture, we demonstrate that this method allows for the measurement of HmU in DNA formed from incorporation of exogenous HmdU. We further demonstrate that addition of isotopically enriched uridine to the culture medium allows for the simultaneous measurement of DNA replication and repair kinetics. This sensitive and facile method should prove valuable for studies on DNA oxidation damage and repair in living cells.
Introduction
The DNA of all organisms is under a constant barrage of chemically reactive molecules that can cause damage. It has been estimated that approximately 104 to 105 DNA damage events happen per cell per day (1, 2). Oxidative damage to DNA accounts for a large proportion of this multitude of events, with some of the more common damaged bases being 5-hydroxymethyluracil, thymine glycol and 8-oxoguanine (2).
5-Hydroxymethyluracil (HmU)1 forms from hydroxyl radical attack on the 5-methyl position of thymine in DNA, having been found in DNA after exposure to ionizing radiation and from tritium transmutation (3), as well as exposure to H2O2/Fe2+/EDTA (4, 5). It has been estimated to form in humans approximately 620 times per cell per day, largely resulting from the reactivity of by-products from normal cellular metabolism (2, 6). HmU neither miscodes (7) nor is a polymerase blocking lesion (8), does not perturb normal B-form DNA structure (9), and even completely replaces thymine in the DNA of some bacteriophages (10).
Despite these characteristics, the cells of many organisms have repair activities that remove HmU from DNA (11), indicating that its presence in DNA is detrimental to the cell. In fact, in humans there are several distinct base-excision repair glycosylases that remove HmU from DNA (12–14). We recently have shown that replacement of the hydrophobic 5-methyl group of thymine with the bulkier, hydrophilic 5-hydroxymethyl group, results in a significant decrease in binding of the ubiquitous transcription factor, AP-1 (15). Indeed, there are many sequence-specific DNA binding proteins that recognize the 5-methyl group of thymine in the major groove of DNA as a docking site (16), suggesting that HmU accumulation in DNA has great potential to disrupt gene regulation, and thus could be a main reason that multiple overlapping glycosylases exist to repair this lesion out of the DNA of human cells.
When the deoxynucleoside, 5-hydroxymethyl-2′-deoxyuridine (HmdU), is delivered to cells in culture, it is phosphorylated, incorporated into DNA, and ultimately excised by cellular DNA repair systems so vigourously that cells commit suicide by apoptosis if the incorporation exceeds a threshold (17–19). The ability to experimentally introduce a single type of oxidative DNA damage and titrate its levels into cells has led to considerable interest in this compound as a model for studying uncharacterized DNA repair proteins and pathways (20–22). The toxicity of HmdU to cultured cells has also led to interest in the compound as a potential chemotherapy agent (23–26). In the past, research groups studying HmdU metabolism and toxicity in cell-culture have measured HmdU incorporation rates and metabolites using compounds labeled with radioactive isotopes such as 3H, and 14C. Stable isotopes of these compounds, however, are less cumbersome to use, and can be measured using GC-MS, whose analysis affords more structural information about the compounds measured.
Among the most sensitive methods for trace-level quantification of DNA adducts is electron capture mass spectrometry, which includes negative chemical ionization-mass spectrometry (27). Methods for detection of HmU and HmdU by gas chromatography-negative chemical ionization-mass spectrometry (GC-NCI-MS) have been previously reported (28–33). Some of these studies report only on detection of standards synthesized on the milligram scale and do not address detection of HmU derivatized at trace levels or from DNA (28, 30, 31). A more recent study developed a sensitive method for analysis of trace HmU levels in urine (33). However, their method is specifically for the HmU free base found in biological fluids, and it does not address the difficulties associated with acid hydrolysis of HmU residues from DNA. Therefore it cannot be used to measure the HmU content of DNA samples. Previous work from our lab resolved a controversy regarding the levels of HmU in damaged DNA, noting that during formic acid hydrolysis, there is conversion of HmU into an unstable formate ester at appreciable levels (34).
In our work here, we exploit the reactivity of the 5-hydroxymethyl group of HmU to convert both HmU and the formate ester of HmU into the more stable methyl ester, 5-methoxymethyluracil. Using these conditions, we have developed a specific and sensitive method for detection and quantification of HmU in DNA using stable-isotope dilution and GC-NCI-MS. The hydrolysis, derivatization, and cleanup methods are relatively quick, and can be performed on trace amounts of DNA or deoxynucleoside or base standards. Using our method in the osteosarcoma cell line U2OS, a correlation is demonstrated between toxicity of exogenous HmdU and its incorporation into the DNA. We also demonstrate repair of the incorporated HmU out of the DNA and investigate the kinetics of DNA replication and HmU repair with the use of stable-isotope labeled uridine as a metabolic tracer.
Experimental Procedures
Materials
Formic acid (88%), 2,2,4-trimethylpentane (isooctane), 3,5-bis(trifluoromethyl)benzyl bromide, H2O2 (stabilized), and thymine were purchased from Sigma-Aldrich (St. Louis, MO). McCoy’s 5a media, DPBS (Dulbecco’s phosphate buffered saline), trypsin-EDTA, and penicillin-streptomycin solution were purchased from Cellgro (Herndon, VA). FBS (fetal bovine serum) and dialyzed FBS were purchased from Gibco (Carlsbad, CA).
Synthesis of compounds
Synthesis of 1,3-15N2-uridine (15N2-Urd), [5-2H2]hydroxymethyl-2′-deoxyuridine (d2-HmdU), [1,3-15N2, 5-2H2]hydroxymethyl-2′-deoxyuridine (15N2,d2-HmdU) and [1,3-15N2, 5-2H2]hydroxymethyluracil (15N2,d2-HmU) were done according to methods established in our laboratory (35). Synthesis of 5-methoxymethyluracil (MmU) on a milligram scale was performed according to Cline et al. (36). Compounds were purified by HPLC when necessary. Identity of compounds were confirmed by TLC, UV, HPLC, and GC-MS. The isotopic purity of the isotope-labeled standards were all >99% as determined by GC-MS. Stock solutions were made by dissolving compounds in DPBS or deionized purified water for use in cell culture or in GC-MS assays, and were stored at −20°C or 4°C.
Cell culture conditions
U2OS cells were kindly provided by Dr. Penelope Duerksen-Hughes (Loma Linda University), originally obtained from the American Type Culture Collection (Manassas, VA). Cells were maintained in McCoy’s 5a media with 10% FBS and 1% penicillin/streptomycin. For all experiments, dialyzed FBS was used in order to have a minimum level of thymidine in the serum, which competes with HmdU for incorporation into the DNA of cells (17).
Assays for cell growth and viability
For monitoring cell growth and viability using trypan blue exclusion, cells were seeded in 10-cm culture plates (total area 55 cm2) at a density of 5×10⁵ cells per plate (~9.1×10³ cells per cm2) and allowed to attach overnight, after which media was replaced with fresh media containing d2-HmdU (or simply with fresh media for untreated controls) and allowed to incubate for 48 h. Cells were harvested as follows. Media was removed and put in 50 mL tubes (1 tube per plate), plates were washed with DPBS, which was added to the tubes, then 1 mL trypsin solution was added and incubated at 37°C for 3–5 min. Plates were washed 3× with 10 mL DPBS and added to 50 mL tubes. Cells were kept on ice until ready to spin, and tubes were centrifuged at 1500 rpm (470 × g) at 4°C for 5–10 min, after which supernatant was aspirated out of tubes. Untreated cells at 0, 12, 24, 36, and 48 h time-points (one plate per time-point) were resuspended in 1 mL of a 1:4 (vol/vol) solution of trypan blue:DPBS and 4 aliquots of 10 μL each were counted on a hemacytometer. For d2-HmdU-treated cells (triplicate plates for each concentration of d2-HmdU), spun-down cell pellets were resuspended in 1 mL DPBS, one 10 μL aliquot was mixed with 10 μL of trypan blue, and 10 μL was counted on a hemacytometer. Both live and dead cells were counted to obtain % viable cells. The remainder of the cells were centrifuged again at 1500 rpm at 4°C for 10 min and DPBS was aspirated away from the cell pellet. Cell pellets were frozen at −20°C until DNA extraction.
Double-labeling experiment for measurement of replication and repair
For monitoring replication and repair of HmdU from the DNA simultaneously, cells were seeded in 10-cm culture plates at a density of 2×10⁵ cells per plate (~3.6×10³ cells per cm2) and allowed to attach overnight, after which media was replaced by media containing 100 μM 15N2-Urd. After incubation for 24 hours, d2-HmdU was added to the media at a sublethal concentration of 10 μM. After an additional 24 hours, cells were washed with DPBS, trypsinized, and re-plated in fresh media with no supplemental Urd or HmdU, and were grown for an additional 48 h. At 12-hour time points from 0 to 96 hours (one plate per time-point), cells were harvested as mentioned above for d2-HmdU-treated cells, except that three aliquots from each plate were taken for trypan blue exclusion and cell counting to monitor cell growth, counting only live cells.
Preparation of U2OS cell nuclear extract
Nuclear extracts of U2OS cells were prepared from confluent cells according to a modified version of Schreiber, et al. (37). Pelleted cells were resuspended in ~ 5 volumes of cold buffer containing 10 mM HEPES (pH 7.9), 10 mM KCl, 0.1 mM EDTA, 0.1 mM EGTA, 1 mM DTT, 0.5 mM PMSF, resuspended by pipetting, and incubated on ice for 15 min. 10% Nonidet NP-40 (0.1 volume) was added, vortexed 10 sec., and centrifuged at 19,500×g for 5 min at 4°C, after which supernatant (containing cytoplasm) was removed. Pellet (containing nuclei) was resuspended in cold buffer containing 20 mM HEPES (pH 7.9), 0.4 M NaCl, 1 mM EDTA, 1 mM EGTA, 1 mM DTT, 1 mM PMSF and incubated on shaking platform for 5 min at 4°C. Sample was centrifuged at 19,500×g for 5 min at 4°C and supernatant (containing nuclei) was aliquoted and stored at −80°C until use in base excision assays. Protein concentration of nuclear extract was determined using the Bradford Assay.
Base excision assays with nuclear extract
Oligonucleotides were prepared by solid-phase synthesis methods, characterized, end-labeled, and annealed as described previously (13). The sequence of the end-labeled oligonucleotide (24mer) used in this study is 5′-GGCTATCGTGGCXGGCCACGACGG-3′, where X is either uracil or HmU. The 24mer complementary strand contains all normal bases. Base excision assays were performed by incubating oligonucleotide duplex substrates (2 pmol/reaction) with 1μL U2OS nuclear extract (10 μg protein) for 60 min at 37°C in the reaction buffer containing 25 mM HEPES-NaOH (pH 7.8), 1 mM EDTA, 1 mM DTT, 10 μM ZnCl2, 10% glycerol in a total volume of 10 μL. Reactions were stopped by adding 5 μL of 0.1 M NaOH and an equal volume of Maxam-Gilbert loading buffer (98% formamide, 0.01 M EDTA, 1 mg/mL xylene cyanol, and 1 mg/mL bromophenol blue). The apyrimidinic sites were cleaved with NaOH by heating at 95°C for 30 min. Reaction samples were electrophoresed on 18% denaturing polyacrylamide gels (8 M urea), and the gels visualized using a Molecular Dynamics PhosphorImager (Molecular Dynamics, Sunnyvale, CA, now part of GE Healthcare).
DNA extraction from cells
DNA was isolated from U2OS cells using DNA isolation kit for cells and tissues from Roche (Basel, Switzerland) or DNeasy Tissue Kit from Qiagen (Valencia, CA). Concentration of DNA was measured in deionized purified water in a UV spectrophotometer and conversion from absorbance units into mg/mL was estimated by using 50 μg/mL per O.D. of double-stranded DNA at 260 nm.
Hydrogen Peroxide Treatment of Cellular DNA
Some DNA samples extracted from untreated U2OS cells were subjected to treatment with hydrogen peroxide in the presence of iron and EDTA. DNA (0.25 mg/mL) was incubated in 100 mM potassium phosphate (pH 7.4), 2 mM EDTA, 900 μM FeSO4, and 500 μM H2O2 in a 100 μL volume for 60 min at room temp. DNA precipitation was performed as follows: 50 μL of 7.5 M ammonium acetate was added, followed by 300 μL ice-cold 100% ethanol, and sample tube was gently mixed by inverting several times until precipitate appeared. Sample was incubated at −80°C for 45 min., followed by centrifugation at ~13,000×g for 15 min. at 4°C. Supernatant was removed and pellet washed with 1 mL ice-cold 70% ethanol and centrifuged at ~13,000×g for 5 min. at 4°C. Supernatant was removed and pellet allowed to air-dry in a culture hood for 60 min, after which DNA was resuspended in deionized, purified water and stored at 4°C until ready for hydrolysis and derivatization for GC-MS analysis.
Hydrolysis and Derivatization procedures
DNA (2 – 5 μg) was transferred to 1.5 mL glass vials (National Scientific – Rockwood, TN), and either 15N2,d2-HmU or 15N2,d2-HmdU was added as an internal standard and dried using vacuum centrifugation. Formic acid (88%) was added to vials (200 μL per vial), vials were sealed with 11 mm aluminum crimp seals (National Scientific), heated at 140°C for 60 min, allowed to cool, uncapped, and dried using vacuum centrifugation. For conversion of HmU to the methoxymethyl derivative, a small scale version of the method found in Cline et al. (36) was used. To the dry vials was added 200 μL of a mix of 100% MeOH and concentrated HCl (mixed at a v/v ratio of 500:1), vials were sealed, then heated at 100°C for 30 min. Samples were allowed to cool, uncapped, transferred to microcentrifuge tubes, and dried using vacuum centrifugation. Derivatization using 3,5-bis(trifluoromethyl)benzyl bromide (BTFMBzBr) and extraction with isooctane was performed according to Jiang et al. (38). In brief, 50 μL of dry acetonitrile, 5 μL of triethylamine, and 1 μL of BTFMBzBr were added to samples, and heated at 37°C for 25 min while shaking at 1400 rpm. Following derivatization, analytes were extracted into isooctane in order to remove triethylamine salts and for facilitation of analyte injection into the GC-MS. Extraction was performed by adding 110 μL of isooctane (2,2,4-trimethylpentane) and 50 μL of water to each sample, then vortexed for 30 sec and briefly centrifuged. The top, isooctane-containing layer was removed (approximately 100 μL) and transferred to 1.5 mL glass vials containing a conical insert (National Scientific), vials were sealed, then samples were injected into the GC-MS for analysis.
Gas chromatography-mass spectrometry
A 6890 GC coupled to a 5973 inert MSD from Agilent (Santa Clara, CA) was used for EI (electron ionization) and 6890 GC coupled to a 5973 network MSD from Agilent for NCI-MS detection. The columns used were either HP-5ms or DB-5ms with dimensions 30 m × 0.25 mm × 0.25 μm. The DB-5ms column also contained an additional 10 meters of unreactive guard column (duraguard) on the inlet side. Inlet temperature was 250°C and GC-MS interface temperature 300°C. Oven conditions were slightly modified from Jiang et al. (38) as follows: 80°C hold 2 min, 20°C/min ramp to 220°C with 3 min hold, 30°C/min ramp to 250°C with 2 min hold, and 40°C/min ramp to 300°C with 3 min hold. EI source temp was 230°C and quad temp 150°C, with electron energy at 70 eV. NCI source and quad temp were 150°C, with a max electron energy at 240 eV. Helium and methane gas, obtained from Gilmore (El Monte, CA) were both research grade (99.9999% pure for helium, 99.999% for methane). Between 1 and 5 μL of sample was injected for analysis in splitless mode, with purge flow at 50 mL/min 1–2 min after injection. For NCI-MS detection, selected ion monitoring (SIM) was performed for derivatized thymine and 15N2-Thy at m/z 351 and 353, respectively, and derivatized HmU, d2-HmU and 15N2,d2-HmU at m/z 381, 383, and 385, respectively, all of which correspond to the [M-227]− ion for each compound. For assay calibration, varying concentrations of either thymine and HmU or thymidine and d2-HmdU were added to vials with constant amounts of 15N2,d2-HmU or 15N2,d2-HmdU, respectively, as internal standard and put through the derivatization procedures mentioned above. Quantification was performed by the determining the peak area ratio of each analyte to the internal standard and comparing this to calibration curves.
Determination of inhibition of growth of cells
For cells treated with HmdU, the IC50 (concentration of HmdU at which cell growth is inhibited by 50%) was determined by the equation:
| (eqn 1) |
where y represents % viability of cells (normalized to 100% for untreated controls), C is the concentration of HmdU used, and n is the sigmoidicity factor (39).
Determination of replication and repair kinetics from isotope enrichment studies
Data from experiments measuring incorporation and washout of isotopically labeled thymidine and HmdU from DNA were fit to equations for exponential growth and decay. For thymidine, the equations used for growth and decay are
| (eqn 2) |
and
| (eqn 3) |
respectively. Since the HmdU in our experiments was added at the 24-h time point, the equations for HmdU growth and decay are
| (eqn 4) |
and
| (eqn 5) |
respectively, where y is the amount of 15N2-Thd or d2-HmdU compared to total thymidine in the sample, t is time, a represents the enrichment at t = 0 (or t = 24 for HmdU equations), and k is the rate constant of the process. Data obtained was fit to the above equations using SigmaPlot. The half-life of the processes described by these equations was calculated using the relation
| (eqn 6) |
where T1/2 is the half-life and k is the apparent rate constant of the process.
Determination of the isotope composition of HmU derived from DNA
The lines in the mass spectra of unenriched HmU result from the monoisotopic peak at m/z 381 as well as from the natural abundance of stable isotopes at m/z 382, 383, 384, etc. The lines in the mass spectra of the isotopically enriched analogs are shifted to higher masses, based upon the degree of stable isotope enrichment. In each case, the predicted mass spectrum compared well to the calculated spectrum based upon their natural abundance or the enriched abundance of a specific atom, as described previously (40).
Experimental mass spectra for the HmU peaks obtained in this study are derived from the overlap of spectra corresponding to derivatized unenriched HmdU, the exogenously delivered d2-HmdU (+2 mass units), and the 15N2,d2-HmdU internal standard (+4 mass units). The magnitudes of the experimental mass spectral lines represent a linear combination of the lines observed for the individual species. The relative contribution of each isotope species is then obtained by subtracting overlapping contributions.
Results
Our focus in this paper is on measuring the incorporation and repair of exogenously delivered isotope-labeled HmdU from DNA of cells grown in culture. However, a number of experiments were also necessary to perform in order to characterize and verify our method, including those concerned with hydrolysis and derivatization of both HmdU and thymidine (or thymine).
HmdU can be converted into a stable derivative suitable for sensitive analysis by GC-NCI-MS
Both HmdU free deoxynucleoside and HmdU in DNA can be converted to the free base by hydrolysis in 88% formic acid at 140°C for 60 min. A previous study from our lab has established that an unstable formate ester is formed under similar conditions (34). Addition of methanol in the presence of catalytic amounts of HCl (see Experimental Procedures) and heating at 100°C for 30 min converts HmU (36) and the HmU-formate ester to the corresponding methoxy derivative (Scheme 1).
Scheme 1.

Formic acid hydrolysis of HmU-containing DNA and conversion of both HmU and HmU-formate ester into 5-methoxymethyluracil (MmU).
The methoxy derivative can then be converted to a derivative containing BTFMBz groups attached to the two ring nitrogens by heating with 3,5-bis(trifluoromethyl)benzyl bromide at 37°C for 25 min. This derivative is separable from the corresponding thymine derivative by gas chromatography (Figure 1A), using conditions described in the Experimental Procedures. The mass spectrum of the derivative obtained in electron ionization mode is shown in Figure 1B in which the parent ion and several significant fragments are observed. In negative chemical ionization mode, the predominant ion is observed at m/z 381, resulting from loss of one BTFMBz derivative as shown in Figure 1C.
Figure 1.
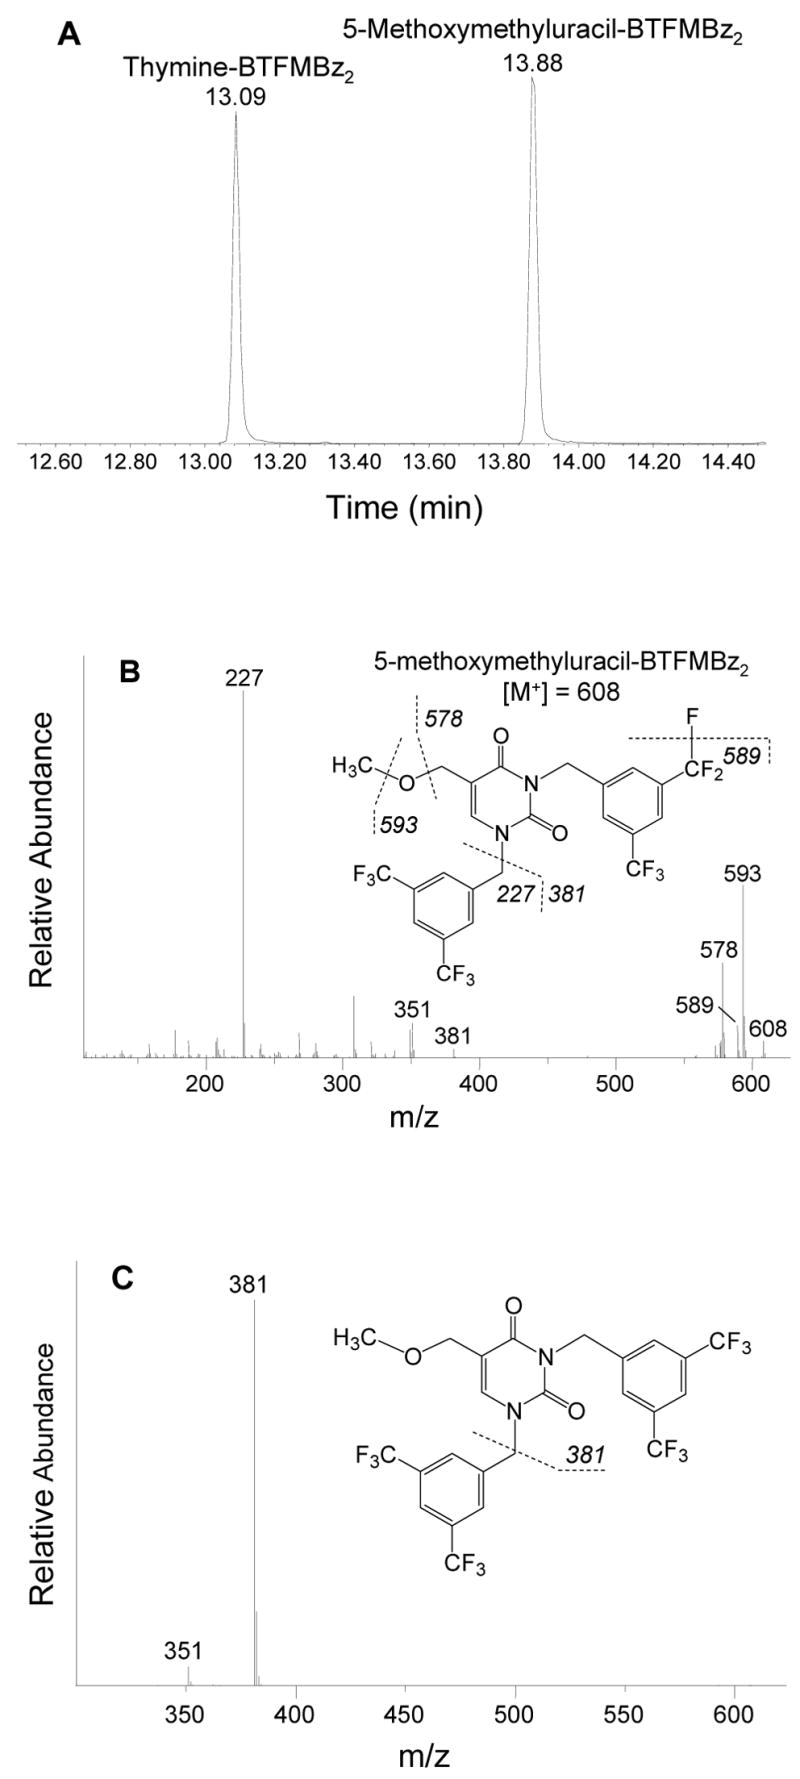
GC-MS of derivatized thymine and HmU and identification of major fragments of derivatized HmU, 5-methoxymethyluracil-BTFMBz2. (A) GC separation of derivatized thymine from HmU. 10 nmol (10−8 mol) each of thymidine and HmdU were hydrolyzed and derivatized and 2 uL injected into the GC-MS as detailed in Experimental Procedures. (B) Electron ionization mass spectrum of derivatized HmU. (C) Negative chemical ionization of the same compound as in (B). It is unknown which BTFMBz group falls off to produce the two fragments m/z 227 and 381.
In order to determine the limit of detection with this method, deuterium-enriched HmdU (d2-HmdU, +2 mass units heavier than HmdU) was serially diluted into a solution containing a constant amount of 15N-deuterium-enriched HmdU internal standard (15N2,d2-HmdU, +4 mass units), and triplicate experiments were performed. A linear response is observed from 50 pmol (5×10⁻¹¹ mol) down to 50 fmol (5×10⁻¹⁴ mol) of starting material, using 1.0 pmol of internal standard, and the equation of the line passing through the points is y = 0.8783x + 0.0307, with R2 = 0.9999. The peak corresponding to 50 fmol had a signal to noise ratio of approximately 6:1, and although lower amounts of d2-HmdU were tested, they did not yield quantifiable or detectable peaks. Our limit of detection is 50 fmol (5×10⁻¹⁴ mol) of starting material, corresponding to 500 amol (5×10⁻¹⁶ mol) on the column (data not shown). This compares favorably with the limits of detection observed for other nucleobases analyzed by GC-NCI-MS (27, 38), which range from the high zeptomole (zepto = 10−21) to low femtomole (femto = 10−15) levels.
The overall yield at the trace level for the steps shown in Scheme 1 under our conditions is approximately 66%. This was tested by subjecting 5 nmol (5×10⁻⁹ mol) of 15N2,d2-HmdU to formic acid hydrolysis and methoxylation, after which 5 nmol of unenriched MmU was added as an internal standard and the mixture was derivatized with BTFMBzBr, extracted into isooctane, and 2 μL injected into the GC-NCI-MS. The peak areas of derivatized MmU and isotope-labeled MmU (derived from the labeled HmdU) were compared and the labeled MmU was 65.7 ± 1.2% that of the unlabeled MmU standard.
Formic acid hydrolysis of thymine can cause abberant formation of HmU
Previously, it has been shown that thymine can be oxidized to HmU under acid hydrolysis conditions (5, 29). Because this phenomenon impacts the usefulness of our method for detecting endogenously formed HmU in DNA, we wanted to determine if our methods of hydrolysis or derivatization cause HmU to form abberantly. Thymine free base obtained from Sigma was purified by HPLC using an isocratic mobile phase of 1% methanol in water in order to remove any trace amounts of HmU found endogenously in the mixture. After this, 5 nmol (5×10⁻⁹ mol) of HPLC-purified thymine (to which was added 1.0 pmol of 15N2,d2-HmU as an internal standard) was subjected multiple times on separate days to our derivatization procedures, both with and without prior formic acid hydrolysis. The amount of HmU was determined by comparison of the chromatogram peak at m/z 381 relative to the stable-isotope enriched internal standard at m/z 385 and with the use of calibration curves. Our results are found in Table 1, overall measuring 29 ± 16 HmU formed per 105 thymine residues after formic acid hydrolysis and derivatization, and approximately an order of magnitude lower levels of HmU measured (2.5 ± 1.1 HmU per 105 thymine) with no formic acid hydrolysis prior to derivatization (Table 1).
Table 1.
Measurement of HmU in Treated Thymine Samples and in DNA.
| Sample | HmU / 105 Thymine | |
|---|---|---|
| No acida | Acid-treatedb | |
| Thymine, Day 1 | 2.7 ± 1.2 | 22.8 ± 9.7 |
| Thymine, Day 2 | 1.6 ± 0.2 | 17.1 ± 7.6 |
| Thymine, Day 3 | 3.2 ± 1.1 | 47.4 ± 9.4 |
| Thymine, Average | 2.5 ± 1.1 | 29.1 ± 15.9 |
| DNAc | - | 20.7 ± 3.3 |
| Oxidized DNAd | - | 623 ± 126 |
Thymine was subjected to derivatization as detailed in Experimental Procedures, with no prior formic acid hydrolysis, and thymine and HmU measured on GC-MS.
Thymine was formic acid hydrolyzed and derivatized prior to GC-MS analysis.
DNA extracted from U2OS cells was hydrolyzed and derivatized prior to analysis.
DNA from U2OS cells was treated with hydrogen peroxide, ethanol-precipitated, hydrolyzed, and derivatized prior to analysis. All numbers represent the average of 4 samples ± standard deviation except for thymine average, which is an average of all 12 samples from the 3 days, and oxidized DNA, which is an average of 3 samples ± standard deviation.
An increase in HmU levels over background can be detected in cellular DNA treated with hydrogen peroxide
U2OS cells were grown, harvested, lysed and DNA was extracted. Previously, our group reported levels of HmU found in untreated calf-thymus DNA to be 70 ± 11 HmU per 105 thymine residues (34), in close agreement with Djuric et al. who reported an amount of 39 ± 4 HmU per 105 thymines (5). Under the conditions reported here, 5 μg of U2OS DNA was hydrolyzed and analyzed and found to have approximately 21 ± 3 HmU per 105 thymines (Table 1), the levels of which are not distinguishable from the 29 ± 16 HmU formed during our formic acid hydrolysis and derivatization of thymine free base. This result indicates that the measurement of HmU in U2OS DNA under our conditions likely represents background levels of HmU formed during formic acid hydrolysis of thymine in the DNA as opposed to HmU present in the DNA samples prior to hydrolysis.
We also treated approximately 25 μg of DNA extracted from U2OS cells with hydrogen peroxide in the presence of iron and EDTA (see Experimental Procedures). DNA samples (3.4 μg) were hydrolyzed in formic acid and the liberated free bases derivatized. Levels of HmU were increased more than an order of magnitude over U2OS DNA not treated with hydrogen peroxide, to 623 ± 126 HmU per 105 thymines (Table 1), indicating a significant increase in HmU over background levels formed during acid hydrolysis.
Incorporation of exogenously delivered d2-HmdU into the DNA of U2OS cells can be quantitated and correlated to toxicity
U2OS cells were grown in media supplemented with deuterium-enriched HmdU (d2-HmdU). After approximately 48 h (corresponding to almost 2 cell doublings), cells were harvested and the DNA was isolated, hydrolyzed and derivatized for GC-NCI-MS as described above. Enriched d2-HmdU incorporation is indicated by the presence of an HmU chromatogram peak observed at m/z 383. Using d2-HmdU for exogenous delivery into cells and 15N2,d2-HmdU as an internal standard, these species can be distinguished from unenriched HmdU and quantified in one mass spectrum. Figure 2 shows a chromatogram of standards of each derivatized HmdU species. Overlapping contributions from the 3 derivatized HmdU species due to natural abundance ion profiles were taken into account and subtracted in order to accurately quantify the HmdU levels, as described in Experimental Procedures. With increasing concentration of d2-HmdU in the media, increasing amounts can be incorporated into the cellular DNA. At a concentration of 120 μM d2-HmdU in the medium, approximately 1 in 110 thymidine residues are replaced with d2-HmdU (Figure 3A and Table 2).
Figure 2.
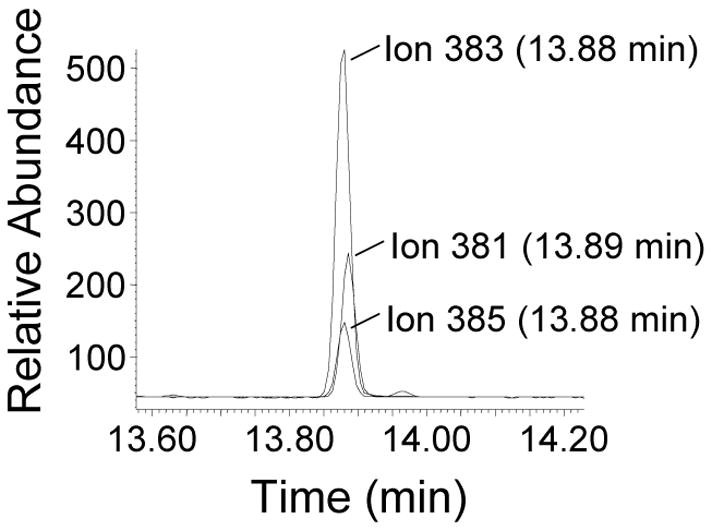
GC-MS of a mix of HmdU standards unenriched and enriched with stable-isotopes. HmdU (2.0 pmol), d2-HmdU (5.0 pmol), and 15N2,d2-HmdU (1.0 pmol) were hydrolyzed and derivatized and 1 uL injected onto GC-MS in NCI mode as detailed in Experimental Procedures. Chromatogram is shown of derivatized unenriched HmU (m/z 381), d2-HmU (m/z 383), and 15N2,d2-HmU (m/z 385). The retention times of the latter two compounds are slightly earlier than the unenriched compound due to isotope effects from the presence of deuterium atoms.
Figure 3.
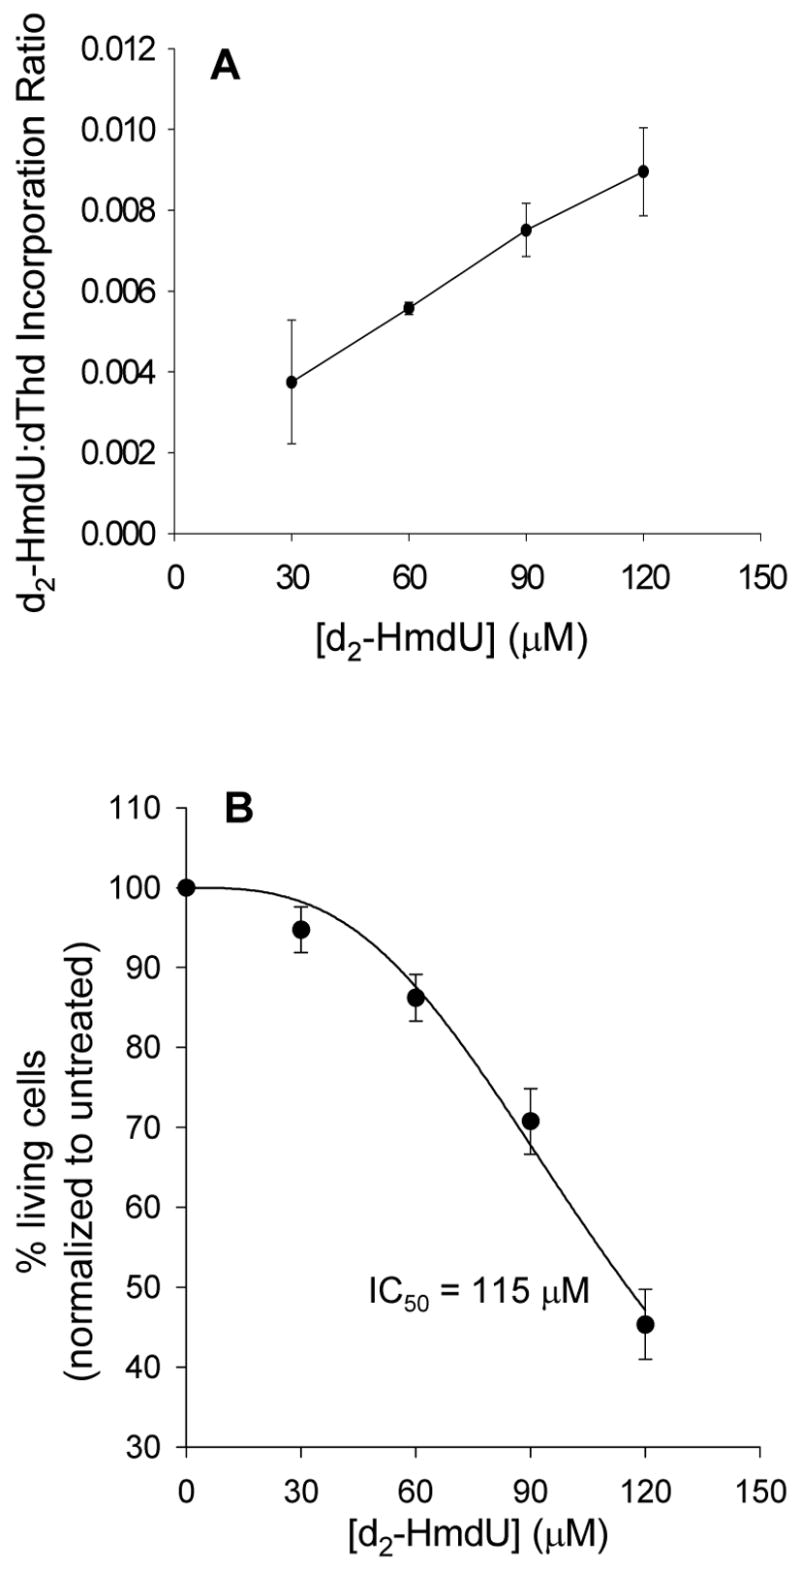
Toxicity and incorporation of d2-HmdU in U2OS cells. U2OS cells were treated for 48 h with stable isotope-labeled HmdU (d2-HmdU). (A) Incorporation of d2-HmdU into the DNA as compared to thymidine (dThd). DNA was isolated from cells, internal standard was added to DNA (2 μg DNA per sample), and samples were hydrolyzed, derivatized, and analyzed by GC-NCI-MS. Each data point represents three independent plates of cells treated with d2-HmdU. (B) Toxicity of d2-HmdU to U2OS cells, given as % viability compared to the untreated control. Toxicity was measured on aliquots of the cells by trypan blue exclusion and counting cells on a hemacytometer. Each data point is an average of one aliquot taken from 3 separate plates of cells treated with d2-HmdU. Data was fit to a curve using eqn 1 (see Experimental Procedures) for determination of the inhibitory concentration at which 50% of the cells were viable (IC50).
Table 2.
Toxicity and Incorporation of d2-HmdU in U2OS cells.
| d2-HmdU (μM) | % living cells | d2-HmdU / 105 dThd |
|---|---|---|
| 0 | 100.0 ± 0.2 | - |
| 30 | 94.7 ± 2.9 | 374 ± 153 |
| 60 | 86.2 ± 2.9 | 557 ± 16 |
| 90 | 70.8 ± 4.1 | 751 ± 66 |
| 120 | 45.4 ± 4.4 | 896 ± 109 |
Exogenous HmdU is known to be toxic to human cells, presumably by incorporation into cellular DNA and subsequent repair (17, 18). Consistent with previous studies, we observe a decrease in the percentage of viable cells with increasing amounts of d2-HmdU incorporated into the DNA as shown in Figure 3 and Table 2.
Cell replication rate and HmdU repair rate can be simultaneously monitored by incorporation of exogenous 15N2-Urd and d2-HmdU into cellular DNA
Isotopically enriched uridine added to the growth medium is taken up by cells, converted to pyrimidine triphosphates and incorporated into the DNA of living cells. Examination of the chromatogram peak for thymine can then be used to determine the extent of label incorporation. In the study reported here, cells were grown for 24 h in 100 μM 15N-enriched uridine, and then grown for an additional 24 h in both 100 μM 15N2-Urd and 10 μM d2-HmdU. DNA from treated cells was isolated, hydrolyzed, derivatized and analyzed on GC-NCI-MS. Cell growth in the presence of 100 μM 15N2-Urd resulted in the replacement of approximately 17% of the thymidine residues with enriched thymidine as shown in Figure 4A. Coincubation with 10 μM d2-HmdU resulted in replacement of approximately 0.16% of the thymidine residues with enriched HmdU as shown in Figure 4B. When cells containing enriched thymidine and HmdU were replated into fresh media containing no supplemental uridine or HmdU, both enriched species in the isolated DNA declined. This “washout” of enriched thymidine can be attributed to DNA replication, in which unlabeled endogenous thymidine is incorporated in the newly replicated strands. Using eqn 3 in the Experimental Procedures, our data for the decline of enriched thymidine were fit to a theoretical exponential decay curve, and an apparent rate constant of 0.0161 sec−1 was obtained from the fit. With eqn 6, the rate constant was used to calculate a half-life of washout, measured as 43.1 h (Figure 4A).
Figure 4.
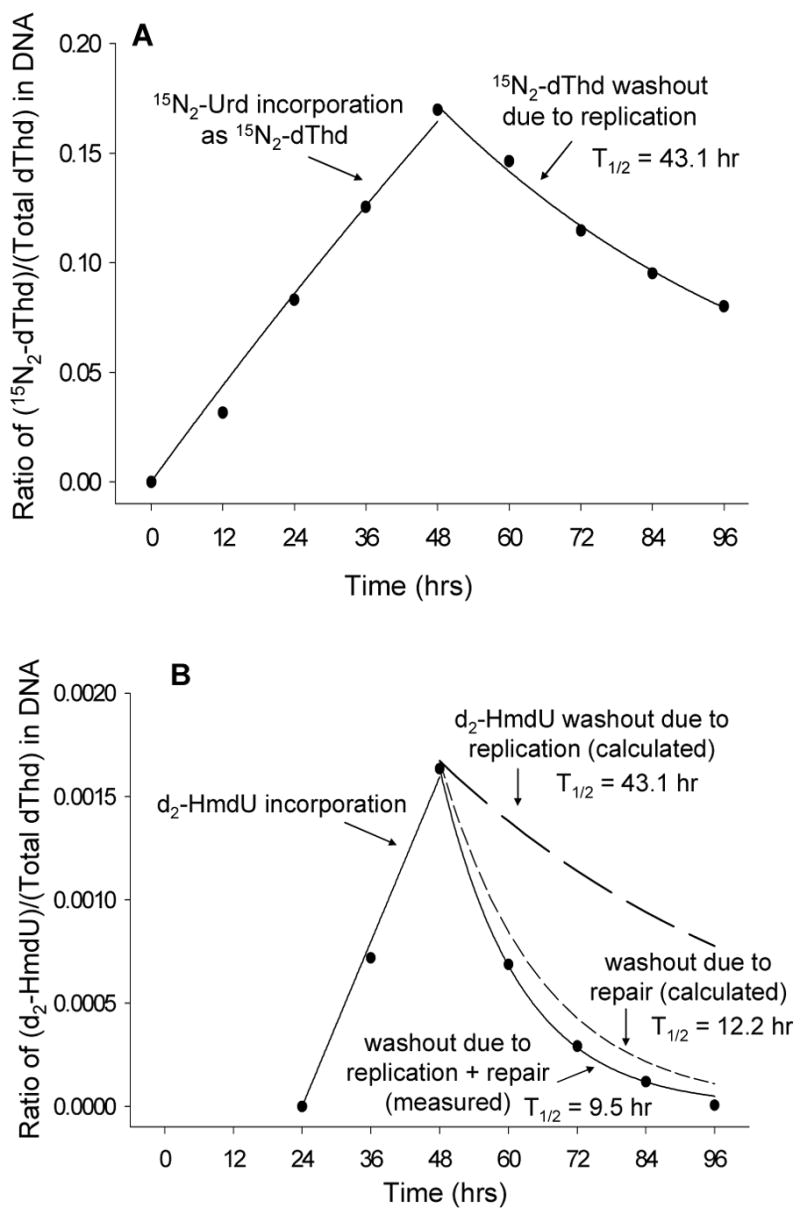
Incorporation and washout of dThd and HmdU by replication and repair. U2OS cells were incubated with 100 μM 15N-enriched uridine (15N2-Urd) for 24 h, then with both 100 μM 15N2-Urd and 10μM d2-HmdU for an additional 24 h. At 48 h, the cells were washed with DPBS and given fresh media containing no isotope labeled compounds. Every 12 h, a plate of cells was harvested and DNA isolated, internal standard was added, and sample was derivatized and analyzed by GC-NCI-MS. (A) Incorporation and washout of 15N-enriched dThd in DNA. Washout is due to DNA replication only. Exponential growth and decay equations (eqn 2 and 3) were fit to data in SigmaPlot and the half-life of washout was calculated using eqn 6 based on the rate constant obtained from the parameters of the fit. (B) Incorporation and washout of d2-HmdU. Washout is due to DNA replication plus repair of d2-HmdU out of the DNA. In addition to data indicating washout both by replication and repair, calculated curves are shown to indicate d2-HmdU decline by replication alone and d2-HmdU decline by repair alone. Exponential growth and decay equations (eqn 4 and 5) were fit to data in SigmaPlot and half-lives calculated as mentioned above.
The decline of enriched HmdU can be attributed to DNA replication in addition to removal from the DNA by the base excision repair machinery. Using eqn 5, our data for the washout of d2-HmdU were also fit to a theoretical exponential decay curve, and an apparent rate constant of 0.0729 sec−1 was obtained from the fit. The rate constant was again used to calculate a half-life of washout measured as 9.5 h (Figure 4B), which was much shorter than that for enriched thymidine. This half-life represents decline of d2-HmdU due to both replication and repair processes acting together. In order to calculate the half-life of decline due to d2-HmdU repair alone from the DNA, we subtracted the rate constant obtained from analysis of the rate of replication, determined by the decline of enriched thymdine (0.0161 sec−1), from the rate constant obtained from enriched HmdU decline (0.0729 sec−1). The resulting rate constant (0.0568 sec−1) was then used with eqn 6 and the half-life was calculated to be 12.2 h, which represents decline of d2-HmdU due to repair from the DNA (Fig. 4B). Figure 5 is a schematic showing overall incorporation, replication, and repair.
Figure 5.

Overall analysis of incorporation, replication, and repair experiment shown in Figure 4. Replication of the DNA is shown as happening once during each 24 h period, with the strands from each round of replication labeled with a different color for clarity. Only one branch from the first round of replication is expanded. At 0 h, 100 μM 15N2-Urd is added to the cell media and incorporated into the DNA during the following replication cycle as 15N2-Thd (labeled as bold, italic T). At 24 h, 10 μM d2-HmdU is added in addition to 15N2-Urd and both are incorporated into the DNA during the following replication cycle (d2-HmdU is labeled as bold, italic H). At 48 h, media is replaced with fresh media containing no supplemental 15N2-Urd or d2-HmdU, and the washout of isotope labeled Thd and HmdU is shown over the remaining 48 h. The top branch shows decline of both 15N2-Thd and d2-HmdU from the DNA by replication alone, as only the parental strand retains the isotope labeled compounds, whereas newly replicated strands contain unenriched Thd only. The bottom branch shows decline of 15N2-Thd by replication, and d2-HmdU by replication and repair acting together. DNA replication leads to decline of 15N2-Thd and d2-HmdU by the same amount as seen in the top branch. In addition, one of the two d2-HmdU residues shown is removed by base excision repair during the first round of replication (from 48 to 72 h – blue H replaced by green T) and the the other is removed during the following round (from 72 to 96 h – blue H replaced by red T).
In order to independently confirm that U2OS cells have repair activity against HmU when paired with adenine, nuclear extracts were prepared and base excision assays performed with 10 μg of protein (total protein from nuclear extract), using oligonucleotides containing both uracil and HmU paired opposite adenine. Our results show substantial base excision activity against U:A, and less, but clearly identifiable activity against HmU:A (Figure 6), which confirms the presence of base excision repair against HmdU in U2OS cells.
Figure 6.
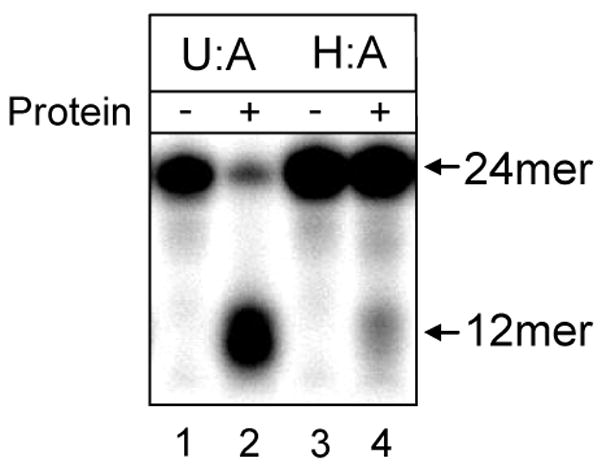
Base excision of uracil and HmU from oligonucleotides incubated with U2OS cell nuclear extract. Nuclear extracts were prepared and 10 μg of protein were incubated for 60 min at 37°C with 2 pmol 32P-end labeled 24mer duplex oligonucleotides containing either uracil or HmU in the center position of the labeled strand, both paired opposite adenine (labeled as U:A or H:A, respectively). Cleavage of the oligonucleotide at the position of the modified base is indicated by the appearance of a band at the 12mer position, whereas uncleaved oligonucleotide is shown at the 24mer position. Excision of HmU from the oligonucleotide was observed (lanes 3 and 4), indicating the presence of repair glycosylases in U2OS cells specific for this lesion. Excision of uracil was also observed (lanes 1 and 2), and was included in the figure as a positive control.
Discussion
The thymine damage product, HmU, has long been considered a valuable indicator of oxidative DNA damage. Complicating the use of HmU as a marker, however, is the known reactivity of HmU under standard conditions used during DNA hydrolysis for GC-MS analysis. In fact, the conversion of HmU to the corresponding unstable formate ester during formic acid hydrolysis has previously led to controversies regarding the amount of HmU in damaged DNA (35).
More recently, investigators have exploited the extreme sensitivity of negative chemical ionization-mass spectrometry methods for the measurement of damaged DNA bases (33, 38). These methods require derivatization with halogenated derivatives such as 3,5-bis(trifluoromethyl)benzyl or pentafluorobenzyl bromide. A method recently reported by Chen et al. demonstrated that a sensitivity of ~7 fmol (7×10⁻¹⁵ mol) could be obtained for the quantification of HmU free base in urine samples, with a limit of detection for standards being ~20 amol (2×10⁻¹⁷ mol) on the column (33).
As sensitive as this method is for measuring HmU free base, similar methods could not be directly applied to measure HmU in DNA samples due to the problems with HmU reactivity under hydrolysis conditions. In the method presented here, the reactivity of the hydroxymethyl group of HmU in acid-catalyzed conditions has been exploited to form a stable methyl ester. Both HmU and its formate ester derivative formed during formic acid hydrolysis are converted to 5-methoxymethyluracil (MmU), as shown in Scheme 1. The formation of MmU, the methyl ester of HmU, under acidic conditions was first described by Cline et al. in 1959 (36) and subsequently was shown to be stable in DNA and during DNA hydrolysis (41).
Following conversion to the methyl ester, MmU is converted by derivatization of the ring nitrogens to the 3,5-bis(trifluoromethyl)benzyl derivative of MmU, extracted with isooctane and injected into the GC-MS. Figure 1A shows chromatographic separation of derivatized thymine from derivatized HmU (MmU) using our conditions. Figure 1B shows the mass spectrum of derivatized HmU (MmU) using electron impact (EI) analysis. The molecular ion [M+] corresponds to a mass to charge ratio (m/z) of 608, with major fragments at 593 [M-CH3], 589 [M-F], 578 [M-OCH3], 381 [M-BTFMBz], and 227 [BTFMBz]. Figure 1C shows a mass spectrum of the same compound using negative chemical ionization (NCI) analysis, which yields one main fragment with a m/z of 381 [M-BTFMBz]. As expected, derivatization of the isotope-labeled internal standard 15N2,d2-HmdU resulted in EI and NCI mass spectra shifted up 4 mass units due to the isotopically enriched atoms. Thymine in the DNA was also successfully derivatized and measured, yielding thymine-BTFMBz2 with the [M+] ion at m/z of 578 on EI and the major fragment on NCI at 351 (data not shown).
One potential problem in measuring HmU levels in DNA is the conversion of thymine (present in large quantities in DNA) to HmU during formic acid hydrolysis, which has been observed by other groups (5, 29) as well as in our studies. We characterized our background levels of HmU formed during the hydrolysis and derivatization steps by subjecting thymine to our procedures both with and without formic acid hydrolysis (Table 1). The levels of HmU formed from thymine with prior acid hydrolysis (29 ± 16 HmU per 105 thymine) are consistent with, though slightly higher than Djuric et al. (5), who measured 11 ± 7 HmU per 105 thymine when treating thymine with formic acid under slightly different conditions. Djuric et al. were able to measure a small difference between HmU formed from acid-hydrolyzed thymine and HmU found endogenously in acid-hydrolyzed calf-thymus DNA (39 ± 4 HmU per 105 thymine). Under our conditions, we measure the same amounts of HmU from thymine treated with acid hydrolysis (29 ± 16 HmU per 105 thymine) and HmU found in acid-hydrolyzed U2OS DNA (21 ± 3 HmU per 105 thymine, Table 1), suggesting a lower limit in our ability to accurately measure endogenously formed HmU in DNA when using formic acid hydrolysis. However, our method is capable of measuring a difference between background HmU levels in DNA (whether abberant formed by acid hydrolysis or endogenously present) and HmU levels in DNA treated under oxidizing conditions, as our hydrogen peroxide-treated DNA was measured to have 623 ± 126 HmU per 105 thymine (Table 1).
Our method was also utilized to investigate the incorporation of exogenous stable-isotope labeled HmdU into the DNA of cells in culture, where the incorporation was at much greater levels than background levels of HmdU formed during acid hydrolysis. HmdU can be incorporated into the DNA of living cells and triggers cell death when HmdU incorporation exceeds a threshold (17–19). The incorporation of exogenous HmdU can provide a method of introducing into the DNA a single form of DNA damage repaired by the base excision repair pathway. In our study, we chose a human osteosarcoma cell line, U2OS, that is sensitive to HmdU toxicity at a measurable level, incorporates HmdU into its DNA, and has repair activity against HmdU. Consistent with previous studies (18), we demonstrate that increasing concentrations of HmdU in the media of the cells results in increased HmdU in cellular DNA (Figure 3A, Table 2). Using the stable-isotope analogs described here, unenriched HmU can be distinguished from deuterium-enriched HmU (+2 mass units) and from 15N, deuterium-enriched HmU (+4 mass units) (Figure 2), which allowed us to successfully measure exogenously delivered d2-HmdU in the cellular DNA, using 15N2,d2-HmdU as an internal standard. Increasing incorporation of HmdU into DNA was accompanied by increasing cell death, presumably by repair-triggered cell death as suggested by previous studies (18) (Figure 3B, Table 2).
Using our method, cells previously labeled with enriched uridine were grown in the presence of sublethal amounts of d2-HmdU, and incorporation of d2-HmdU into the DNA was measured (Figures 4 and 5). When these cells were replated into fresh media, the d2-HmdU content of the DNA declined due to DNA synthesis during replication as well as due to repair (Figure 4B). DNA replication could be independently monitored in the same cells by measuring the dilution of enriched thymidine as a function of time (Figure 4A). The contribution of DNA repair to the decline of d2-HmdU could then be distinguished from the decline of the d2-HmdU attributable to DNA replication. The calculated half-life for repair of HmdU from the DNA of viable cells under our conditions is approximately 12 hours. To confirm that base excision repair of HmU in the DNA of U2OS cells occurs, we prepared nuclear extracts from U2OS cells and tested their ability to excise HmU when paired opposite adenine in 32P-end-labeled oligonucleotides. Oligonucleotides with HmU:A base pairs were chosen because HmdUTP is incorporated opposite adenine, producing HmU:A in pseudo-Watson-Crick geometry (9). Figure 6 shows definite repair activity against HmU, as well as against uracil, which was included as a control. The higher levels of uracil glycosylase activity compared to HmU glycosylase activity are consistent with previous studies using cell nuclear extracts of human cells (42, 43), and are likely due to the increased need for repair of uracil from human cellular DNA.
While the HmU content of the DNA derived from the exogenous HmdU was measured by observing the relative size of the m/z 383 peak (d2-HmU, +2 mass units), it is possible that heavy HmU could also have been derived from the oxidation of enriched thymine derived from the enriched uridine label (15N2-Urd, +2 mass units). However, the method described here allows for the monitoring of background levels of HmU derived from either endogenous oxidation or oxidation occurring during sample preparation at the same time as monitoring for isotope-labeled HmU from exogenously delivered d2-HmdU. Based upon the measured extent of background unenriched HmU present in the samples compared to unenriched thymine, we were able to estimate the amount of enriched HmU derived from oxidation of enriched thymine in the DNA sample, and thus correct for this in reporting our results. In all cases, these corrections changed the original values by 15% or less.
In human cells, there are several DNA-repair glycosylases which are a part of base excision repair that can excise HmU from the DNA (12–14). Boorstein, et al. equated HmU repair activity in human cells with the DNA glycosylase SMUG1 (12), while our group has reported on a partially purified HmU glycosylase with different substrate specificity from SMUG1 (13). More recently, Zhang, et al. have shown that hNEIL1 and hNTH1 are also able to excise HmU from DNA (14). It is possible there are still other glycosylases in human cells that have the ability to remove HmU from the DNA. In these and other studies (42, 43), characterization of repair activities against damaged bases have made use of purified glycosylases or cell nuclear extracts in conjunction with base excision assays. However, the method we present here using stable-isotope tracers is able to measure repair rates in living cells against an important oxidative DNA damage product while simultaneously monitoring DNA replication, leading to a more global picture of base excision repair rates in living cells.
We report here a method for the analysis of HmU in DNA using a new GC-NCI-MS method. While the sensitivity of the method is substantial, the potential conversion of thymine to HmU during formic acid hydrolysis limits the accuracy of the measurement of endogenous HmU present in DNA. However, our interest here is to investigate the incorporation and repair of exogenously delivered HmdU. An advantage of our method is found in the use of stable-isotope labeled HmdU, which can be distinguished from abberantly formed or endogenously present HmdU. Using this method, we have quantified the level of enriched HmdU incorporation into the DNA of cells in culture, and we have shown this method to be useful for examining DNA-repair kinetics. The method reported here should be valuable in subsequent studies of base excision repair in human cells.
Acknowledgments
This study was supported by the National Institutes of Health (GM50351). D.K.R. is supported in part by the Loma Linda University School of Medicine Medial Scientist Training Program.
Footnotes
Abbreviations: HmU, 5-hydroxymethyluracil; HmdU, 5-hydroxymethyl-2′-deoxyuridine; MmU, 5-methoxymethyluracil; d2-HmU, [5-2H2]hydroxymethyluracil; 15N2,d2-HmU, [1,3-15N2, 5-2H2]hydroxymethyluracil; 15N2-Thy, 1,3-15N2-thymine; 15N2-Urd, 1,3-15N2-uridine; 15N2-Thd, 1,3-15N2-thymidine; d2-HmdU, [5-2H2]hydroxymethyl-2′-deoxyuridine; 15N2,d2-HmdU, [1,3-15N2, 5-2H2]hydroxymethyl-2′-deoxyuridine; BTFMBz, 3,5-bis(trifluoromethyl)benzyl; GC-NCI-MS, gas chromatography-negative chemical ionization-mass spectrometry
References
- 1.Loeb LA. Endogenous carcinogenesis: molecular oncology into the twenty-first century – presidential address. Cancer Res. 1989;49:5489–5496. [PubMed] [Google Scholar]
- 2.Mullaart E, Lohman PH, Berends F, Vijg J. DNA damage metabolism and aging. Mutat Res. 1990;237:189–210. doi: 10.1016/0921-8734(90)90001-8. [DOI] [PubMed] [Google Scholar]
- 3.Teebor GW, Frenkel K, Goldstein MS. Ionizing radiation and tritium transmutation both cause formation of 5-hydroxymethyl-2′-deoxyuridine in cellular DNA. Proc Natl Acad Sci USA. 1984;81:318–321. doi: 10.1073/pnas.81.2.318. [DOI] [PMC free article] [PubMed] [Google Scholar]
- 4.Frenkel K, Zhong ZJ, Wei HC, Karkoszka J, Patel U, Rashid K, Georgescu M, Solomon JJ. Quantitative high-performance liquid chromatography analysis of DNA oxidized in vitro and in vivo. Anal Biochem. 1991;196:126–136. doi: 10.1016/0003-2697(91)90128-g. [DOI] [PubMed] [Google Scholar]
- 5.Djuric Z, Luongo DA, Harper DA. Quantitation of 5-(hydroxymethyl)uracil in DNA by gas chromatography with mass spectral detection. Chem Res Toxicol. 1991;4:687–691. doi: 10.1021/tx00024a014. [DOI] [PubMed] [Google Scholar]
- 6.Ames BN, Shigenaga MK, Hagen TM. Oxidants, antioxidants, and the degenerative diseases of aging. Proc Natl Acad Sci USA. 1993;90:7915–7922. doi: 10.1073/pnas.90.17.7915. [DOI] [PMC free article] [PubMed] [Google Scholar]
- 7.Levy DD, Teebor GW. Site directed substitution of 5-hydroxymethyluracil for thymine in replicating ϕX-174am3 DNA via synthesis of 5-hydroxymethyl-2′-deoxyuridine-5′-triphosphate. Nucleic Acids Res. 1991;19:3337–3343. doi: 10.1093/nar/19.12.3337. [DOI] [PMC free article] [PubMed] [Google Scholar]
- 8.Herrala AM, Vilpo JA. Template-primer activity of 5-(hydroxymethyl)uracil-containing DNA for prokaryotic and eukaryotic DNA and RNA polymerases. Biochemistry. 1989;28:8274–8277. doi: 10.1021/bi00447a003. [DOI] [PubMed] [Google Scholar]
- 9.Mellac S, Fazakerley GV, Sowers LC. Structures of base pairs with 5-(hydroxymethyl)-2′-deoxyuridine in DNA determined by NMR spectroscopy. Biochemistry. 1993;32:7779–7786. doi: 10.1021/bi00081a025. [DOI] [PubMed] [Google Scholar]
- 10.Kallen RG, Simon M, Marmur J. The occurrence of a new pyrimidine base replacing thymine in a bacteriophage DNA: 5-hydroxymethyl uracil. J Mol Biol. 1962;5:248–250. doi: 10.1016/s0022-2836(62)80087-4. [DOI] [PubMed] [Google Scholar]
- 11.Boorstein RJ, Chiu LN, Teebor GW. Phylogenetic evidence of a role for 5-hydroxymethyluracil-DNA glycosylase in the maintenance of 5-methylcytosine in DNA. Nucleic Acids Res. 1989;17:7653–7661. doi: 10.1093/nar/17.19.7653. [DOI] [PMC free article] [PubMed] [Google Scholar]
- 12.Boorstein RJ, Cummings A, Jr, Marenstein DR, Chan MK, Ma Y, Neubert TA, Brown SM, Teebor GW. Definitive identification of mammalian 5-hydroxymethyluracil DNA N-glycosylase activity as SMUG1. J Biol Chem. 2001;276:41991–41997. doi: 10.1074/jbc.M106953200. [DOI] [PubMed] [Google Scholar]
- 13.Baker D, Liu P, Burdzy A, Sowers LC. Characterization of the substrate specificity of a human 5-hydroxymethyluracil glycosylase activity. Chem Res Toxicol. 2002;15:33–39. doi: 10.1021/tx010113b. [DOI] [PubMed] [Google Scholar]
- 14.Zhang QM, Yonekura SI, Takao M, Yasui A, Sugiyama H, Yonei S. DNA glycosylase activities for thymine residues oxidized in the methyl group are functions of the hNEIL1 and hNTH1 enzymes in human cells. DNA Repair. 2005;4:71–79. doi: 10.1016/j.dnarep.2004.08.002. [DOI] [PubMed] [Google Scholar]
- 15.Rogstad DK, Liu P, Burdzy A, Lin SS, Sowers LC. Endogenous DNA lesions can inhibit the binding of the AP-1 (c-Jun) transcription factor. Biochemistry. 2002;41:8093–8102. doi: 10.1021/bi012180a. [DOI] [PubMed] [Google Scholar]
- 16.Ivarie R. Thymine methyls and DNA-protein interactions. Nucleic Acids Res. 1987;15:9975–9983. doi: 10.1093/nar/15.23.9975. [DOI] [PMC free article] [PubMed] [Google Scholar]
- 17.Kaufman ER. Biochemical analysis of toxic effects of 5-hydroxymethyl-2′-deoxyuridine in mammalian cells. Somat Cell Mol Genet. 1986;12:501–512. doi: 10.1007/BF01539921. [DOI] [PubMed] [Google Scholar]
- 18.Boorstein RJ, Chiu LN, Teebor GW. A mammalian cell line deficient in activity of the DNA repair enzyme 5-hydroxymethyluracil-DNA glycosylase is resistant to the toxic effects of the thymidine analog 5-hydroxymethyl-2′-deoxyuridine. Mol Cell Biol. 1992;12:5536–5540. doi: 10.1128/mcb.12.12.5536. [DOI] [PMC free article] [PubMed] [Google Scholar]
- 19.Mi LJ, Chaung W, Horowitz R, Teebor GW, Boorstein RJ. Excessive base excision repair of 5-hydroxymethyluracil from DNA induces apoptosis in Chinese hamster V79 cells containing mutant p53. Carcinogenesis. 2001;22:179–186. doi: 10.1093/carcin/22.1.179. [DOI] [PubMed] [Google Scholar]
- 20.Horton JK, Joyce-Gray DF, Pachkowski BF, Swenberg JA, Wilson SH. Hypersensitivity of DNA polymerase β null mouse fibroblasts reflects accumulation of cytotoxic repair intermediates from site-specific alkyl DNA lesions. DNA Repair. 2003;2:27–48. doi: 10.1016/s1568-7864(02)00184-2. [DOI] [PubMed] [Google Scholar]
- 21.Horton JK, Stefanick DF, Naron JM, Kedar PS, Wilson SH. Poly(ADP-ribose) polymerase activity prevents signaling pathways for cell cycle arrest after DNA methylating agent exposure. J Biol Chem. 2005;280:15773–15785. doi: 10.1074/jbc.M413841200. [DOI] [PubMed] [Google Scholar]
- 22.Braithwaite EK, Kedar PS, Lan L, Polosina YY, Asagoshi K, Poltoratsky VP, Horton JK, Miller H, Teebor GW, Yasui A, Wilson SH. DNA polymerase λ protects mouse fibroblasts against oxidative DNA damage and is recruited to sites of DNA damage/repair. J Biol Chem. 2005;280:31641–31647. doi: 10.1074/jbc.C500256200. [DOI] [PubMed] [Google Scholar]
- 23.Meldrum JB, Gupta VS, Lowes NR, Paterson AR. Toxicologic and antitumor studies on 5-hydroxymethyldeoxyuridine. Toxicol Appl Pharmacol. 1985;79:423–435. doi: 10.1016/0041-008x(85)90140-1. [DOI] [PubMed] [Google Scholar]
- 24.Kahilainen LI, Bergstrom DE, Vilpo JA. 5-Hydroxymethyl-2′-deoxyuridine. Cytotoxicity and DNA incorporation studied by using a novel [2-14C]-derivative with normal and leukemic human hematopoietic cells. Acta Chem Scand B. 1985;39:477–484. doi: 10.3891/acta.chem.scand.39b-0477. [DOI] [PubMed] [Google Scholar]
- 25.Kahilainen L, Bergstrom D, Kangas L, Vilpo JA. In vitro and in vivo studies of a promising antileukemic thymidine analogue, 5-hydroxymethyl-2′-deoxyuridine. Biochem Pharmacol. 1986;35:4211–4215. doi: 10.1016/0006-2952(86)90697-0. [DOI] [PubMed] [Google Scholar]
- 26.Vilpo JA, Suvanto E, Kangas L. Antileukemic activity against L1210 leukemia, pharmacokinetics and hematological side effects of 5-hydroxymethyl-2′-deoxyuridine. Leuk Res. 1987;11:877–880. doi: 10.1016/0145-2126(87)90132-9. [DOI] [PubMed] [Google Scholar]
- 27.Giese RW. Detection of DNA adducts by electron capture mass spectrometry. Chem Res Toxicol. 1997;10:255–270. doi: 10.1021/tx9601263. [DOI] [PubMed] [Google Scholar]
- 28.Saha M, Kresbach GM, Giese RW, Annan RS, Vouros P. Preparation and mass spectral characterization of pentafluorobenzyl derivatives of alkyl and hydroxyalkyl-nucleobase DNA adducts. Biomed Environ Mass Spectrom. 1989;18:958–972. doi: 10.1002/bms.1200181103. [DOI] [PubMed] [Google Scholar]
- 29.Annan RS, Kresbach GM, Giese RW, Vouros P. Trace detection of modified DNA bases via moving-belt liquid chromatography-mass spectrometry using electrophoric derivatization and negative chemical ionization. J Chromatogr. 1989;465:285–296. doi: 10.1016/s0021-9673(01)92666-4. [DOI] [PubMed] [Google Scholar]
- 30.Kresbach GM, Itani M, Saha M, Rogers EJ, Vouros P, Giese RW. Ester and related derivatives of ring N-pentafluorobenzylated 5-hydroxymethyluracil. Hydrolytic stability, mass spectral properties, and trace detection by gas chromatography-electron-capture detection, gas chromatography-electron-capture negative ion mass spectrometry, and moving-belt liquid chromatography-electron-capture negative ion mass spectrometry. J Chromatogr. 1989;476:423–438. doi: 10.1016/s0021-9673(01)93886-5. [DOI] [PubMed] [Google Scholar]
- 31.Abdel-Baky S, Giese RW. Gas chromatography/electron capture negative-ion mass spectrometry at the zeptomole level. Anal Chem. 1991;63:2986–2989. doi: 10.1021/ac00024a036. [DOI] [PubMed] [Google Scholar]
- 32.Teixeira AJ, Gommers-Ampt JH, Van de Werken G, Westra JG, Stavenuiter JF, de Jong AP. Method for the analysis of oxidized nucleosides by gas chromatography/mass spectrometry. Anal Biochem. 1993;214:474–483. doi: 10.1006/abio.1993.1525. [DOI] [PubMed] [Google Scholar]
- 33.Chen HJ, Wu CF, Huang JL. Measurement of urinary excretion of 5-hydroxymethyluracil in human by GC/NICI/MS: correlation with cigarette smoking, urinary TBARS and etheno DNA adduct. Toxicol Lett. 2005;155:403–410. doi: 10.1016/j.toxlet.2004.11.009. [DOI] [PubMed] [Google Scholar]
- 34.LaFrancois CJ, Yu K, Sowers LC. Quantification of 5-(Hydroxymethyl)uracil in DNA by gas chromatography/mass spectrometry: problems and solutions. Chem Res Toxicol. 1998;11:786–793. doi: 10.1021/tx970233c. [DOI] [PubMed] [Google Scholar]
- 35.LaFrancois CJ, Fujimoto J, Sowers LC. Synthesis and characterization of isotopically enriched pyrimidine deoxynucleoside oxidation damage products. Chem Res Toxicol. 1998;11:75–83. doi: 10.1021/tx970186o. [DOI] [PubMed] [Google Scholar]
- 36.Cline RE, Fink RM, Fink K. Synthesis of 5-substituted pyrimidines via formaldehyde addition. J Am Chem Soc. 1959;81:2521–2527. [Google Scholar]
- 37.Schreiber E, Matthias P, Muller MM, Schaffner W. Rapid detection of octamer binding proteins with ‘mini-extracts’, prepared from a small number of cells. Nucleic Acids Res. 1989;17:6419. doi: 10.1093/nar/17.15.6419. [DOI] [PMC free article] [PubMed] [Google Scholar]
- 38.Jiang Q, Blount BC, Ames BN. 5-Chlorouracil, a marker of DNA damage from hypochlorous acid during inflammation. J Biol Chem. 2003;278:32834–32840. doi: 10.1074/jbc.M304021200. [DOI] [PubMed] [Google Scholar]
- 39.Klecker RW, Katki AG, Collins JM. Toxicity, metabolism, DNA incorporation with lack of repair, and lactate production for 1-(2′-fluoro-2′-deoxy-β-D-arabinofuranosyl)-5-iodouracil in U-937 and MOLT-4 cells. Mol Pharmacol. 1994;46:1204–1209. [PubMed] [Google Scholar]
- 40.Rusmintratip V, Riggs AD, Sowers LC. Examination of the DNA substrate selectivity of DNA cytosine methyltransferases using mass tagging. Nucleic Acids Res. 2000;28:3594–3599. doi: 10.1093/nar/28.18.3594. [DOI] [PMC free article] [PubMed] [Google Scholar]
- 41.Mellac S, Fazakerley GV, Sowers LC. Structures of oligonucleotides containing 5-(methoxymethyl)-2′-deoxyuridine determined by NMR spectroscopy. J Biomol Struct Dyn. 1994;11:1017–1033. doi: 10.1080/07391102.1994.10508049. [DOI] [PubMed] [Google Scholar]
- 42.Rusmintratip V, Sowers LC. An unexpectedly high excision capacity for mispaired 5-hydroxymethyluracil in human cell extracts. Proc Natl Acad Sci USA. 2000;97:14183–14187. doi: 10.1073/pnas.97.26.14183. [DOI] [PMC free article] [PubMed] [Google Scholar]
- 43.Liu P, Burdzy A, Sowers LC. Repair of the mutagenic DNA oxidation product, 5-formyluracil. DNA Repair. 2003;2:199–210. doi: 10.1016/s1568-7864(02)00198-2. [DOI] [PubMed] [Google Scholar]