Abstract
Despite the similarity in the active site pockets of carbonic anhydrase (CA) isozymes I and II, the binding affinities of benzenesulfonamide inhibitors are invariably higher with CA II as compared to CA I. To explore the structural basis of this molecular recognition phenomenon, we have designed and synthesized simple benzenesulfonamide inhibitors substituted at the para position with positively-charged, negatively-charged, and neutral functional groups, and we have determined the affinities and X-ray crystal structures of their enzyme complexes. The para-substituents are designed to bind in the midsection of the 15 Å deep active site cleft, where interactions with enzyme residues and solvent molecules are possible. We find that a para-substituted positively-charged amino group is more poorly tolerated in the active site of CA I compared with CA II. In contrast, a para-substituted negatively-charged carboxylate substituent is tolerated equally well in the active sites of both CA isozymes. Notably, enzyme-inhibitor affinity increases upon neutralization of inhibitor charged groups by amidation or esterification. These results inform the design of short molecular linkers connecting the benzenesulfonamide group and a para-substituted tail group in “two-prong” CA inhibitors: an optimal linker segment will be electronically neutral, yet capable of engaging in at least some hydrogen bond interactions with protein residues and/or solvent. Microcalorimetric data reveal that inhibitor binding to CA I is enthalpically less favorable and entropically more favorable than inhibitor binding to CA II. This contrasting behavior may arise in part from differences in active site desolvation and the conformational entropy of inhibitor binding to each isozyme active site.
Introduction
Due to their involvement in a variety of pathophysiological processes such as glaucoma, hypertension, convulsion and epilepsy, altitude sickness, obesity, and diabetes, the carbonic anhydrases (CA) have historically served as drug design targets for the treatment of human diseases.1 However, due to serious side effects, several highly potent carbonic anhydrase inhibitors have failed to pass scrutiny at different stages in clinical trials, and some CA-targeted drugs have been withdrawn from the market.2 The lack of tissue-selective and isozyme-specific inhibition of CA is likely the most prominent reason for unwanted side effects resulting from systemic administration of a nonspecific CA inhibitor. For example, inhibition of CA II in the eye lowers intraocular pressure, the primary symptom of glaucoma. However, since many CA isozymes are expressed in nearly all tissues where they perform various tissue-specific functions, the long-term systemic administration of a nonspecific CA II inhibitor may not only lower intraocular pressure, but it may also impair the physiological functions of carbon dioxide transport and/or acid-base balance in other tissues.1a,3 This conundrum inspired the development of the topically-applied CA II inhibitors dorzolamide and brinzolamide to lower intraocular pressure in glaucoma patients, since topical administration minimizes long-term systemic exposure to the inhibitors. Even so, the systemically-administered CA inhibitors acetazolamide, dichlorophenamide, and methazolamide are approved in the U.S. for the treatment of epilepsy, glaucoma, high altitude sickness, and sleep apnea.4 The design of isozyme specific inhibitors remains a critical challenge in the chemistry and biology of the carbonic anhydrases.
In the animal kingdom, there are fifteen CA isozymes, of which five are cytoplasmic (I, II, III, VII, and XIII), two are mitochondrial (VA and VB), one is secreted (VI), four are membrane associated (IV, IX, XII, XIV), and three are non-catalytic (VIII, X, XI).5 Of these isozymes, the X-ray crystal structures of seven (I, II, III, IV, V, XII, and XIV) have been determined in the absence and presence of inhibitors.6 Although these isozymes exhibit varying degrees of amino acid sequence identity, their active site clefts are remarkably similar and consist of a catalytic Zn2+ ion situated at the bottom of a 15 Å-deep conical active site roughly divisible into a hydrophobic half and a hydrophilic half.6b The Zn2+ ion is coordinated by H94, H96, H119, and a solvent molecule with tetrahedral geometry.
The best inhibitors of CA contain an arylsulfonamide group that coordinates to the active site Zn2+ ion. General features of sulfonamide-metal coordination are conserved across all isozymes of known structure: the ionized sulfonamide NH− group displaces the zinc-bound hydroxide ion and donates a hydrogen bond to the side chain of T199, and one sulfonamide S=O group accepts a hydrogen bond from the backbone NH group of T199.5,6 The aromatic rings of these inhibitors make additional weakly polar and van der Waals interactions in the active site, and ring substituents are capable of van der Waals and hydrogen bond interactions with residues and solvent molecules in the midsection of the active site cleft.6
Given that the simplest arylsulfonamide, benzenesulfonamide, binds to CA with micromolar affinity, numerous benzenesulfonamide derivatives have been synthesized and evaluated against different carbonic anhydrase isozymes.5 Although many such inhibitors yield impressive nanomolar binding affinity, they typically exhibit minimal, if any, specificity for one CA isozyme versus another. Structure-based approaches7 toward the design of isozyme-specific inhibitors are potentially facilitated by the availability of more than 240 crystal structures of CA-inhibitor complexes in the protein data bank,8 yet attempts to design isozyme specific inhibitors have met with limited success, e.g., usually achieving 10–100 fold differences in binding to one isozyme relative to another.9 One limitation in the available structural data is the partial molecular disorder of some10a–c, but not all10d, of the larger inhibitors observed in crystal structures. For example, such molecular disorder characterizes the binding of certain “two-prong” inhibitors containing cupric-iminodiacetate groups tethered to benzenesulfonamide by 5 – 12 Å long linker segments.11 This observation now inspires us to explore the contribution of the length and chemical nature of the linker segment to enzyme-inhibitor recognition, affinity, and specificity.
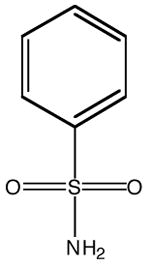
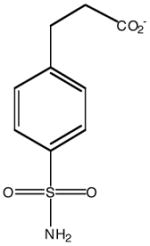
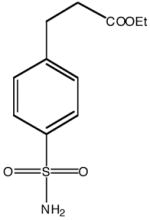
Here, we report the structural and functional consequences of positively-charged, negatively-charged, and neutral groups incorporated at the para position of benzenesulfonamide CA inhibitors (Table 1). The para-substituted groups are chemically and electronically diverse and are designed to interact with the midsection of the active site cleft, i.e., where linker segments of two-prong benzenesulfonamide inhibitors would bind. Correlation of these structural data with microcalorimetric measurements of inhibitor binding allows us to discern structural and chemical features of inhibitor linker segments that may contribute to enzyme-inhibitor affinity and specificity.
Table 1.
Binding Affinities of CA Inhibitorsa
| Inhibitor structure | 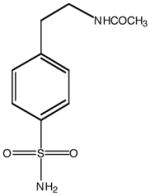 |
 |
 |
 |
 |
|
|---|---|---|---|---|---|---|
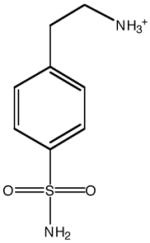
| Inhibitor name | 4-(acetyl-2-aminoethyl) benzene-sulfonamide | 4-aminoethyl benzene-sulfonamide | benzene-sulfonamide | 4-carboxyethyl benzene-sulfonamide | 4-carboxyethyl benzene-sulfonamide ethyl ester | |
| Inhibitor label | MH 1.25 | pAEBS | BS | pCEBS | MH 1.29 | |
| CAI | Ki (μM) | 2.0 ± 0.1 | 88 ± 4 | 3.3 ± 0.3b | 2.3 ± 0.1 | 0.1 ± 0.02 |
| Kd (μM) | 2.7 ± 0.1 | 72 ± 3 | 4.0 ± 0.2c | 1.5 ± 0.1 | 0.3 ± 0.01 | |
| 1/Ka (μM) | n.h.d | n.h.d | 2.6 ± 0.5 | 0.63 ± 0.1 | 0.091 ± 0.03 | |
| CAII | Ki (μM) | 0.9 ± 0.03 | 8.2 ± 0.3 | 1.5 ± 0.1e | 0.8 ± 0.06 | 0.06 ± 0.01 |
| Kd (μM) | 0.9 ± 0.02 | 4.4 ± 0.2 | 0.7 ± 0.04c | 0.4 ± 0.01 | 0.03 ± 0.001 | |
| 1/Ka (μM) | 0.1 ± 0.06 | 4.7 ± 0.2 | 0.59 ± 0.1e | 0.38 ± 0.06 | 0.055 ± 0.02 | |
Ki values determined by kinetic assay of p-nitrophenyl acetate hydrolysis; Kd values determined by dansylamide displacement assay; 1/Ka values determined by isothermal titration calorimetry.
Banerjee, A. L.; Eiler, D.; Roy, B. C.; Jia, X.; Haldar, M. K.; Mallik, S.; Srivastava, D. K. Biochemistry, 2005, 44, 3211–3224.
reference 11.
No heat of binding was detected by isothermal titration calorimetry.
Roy, B. C.; Banerjee, A. L.; Swanson, M.; Jia, X. G.; Haldar, M. K.; Mallik, S.; Srivastava, D. K. J. Am. Chem. Soc. 2004, 126, 13206–13207.
Results
Binding affinities of CA inhibitors
The Ki, Kd, and 1/Ka values of benzenesulfonamide derivatives determined by kinetic measurements of p-nitrophenylacetate hydrolysis, the dansylamide displacement assay, and isothermal titration calorimetric (ITC) studies of CA-inhibitor complexes, respectively, are recorded in Table 1. The Ki, Kd, and 1/Ka values measured for each inhibitor are generally comparable, and as a group these inhibitors exhibit somewhat preferential binding affinity for CA II than for CA I (a common feature of most benzenesulfonamide derivatives for which Ki values are reported in the literature5). However, the degree of isozyme specificity appears to depend on the para-substituted group for the inhibitors shown in Table 1. For example, the positively charged amino group of pAEBS causes ~6-fold and ~20-fold decreases relative to benzenesulfonamide in binding affinity to CA II and CA I, respectively, indicating that the positively-charged amino group is more poorly tolerated in the CA I active site than in the CA II active site. In contrast, the negatively charged carboxylate group of pCEBS causes slight (~2-fold) increases in binding affinity to both isozymes relative to benzenesulfonamide, indicating that the negatively-charged carboxylate is accommodated equally well in the CA I and CA II active sites. A marked increase in the binding affinities of both positively and negatively charged benzenesulfonamide derivatives results when para-substituted charged groups are neutralized by acylation to yield MH 1.25 and MH 1.29, respectively (Table 1).
Analysis of isothermal titration calorimetric data allows us to dissect enthalpic and entropic contributions to the overall binding free energy of each enzyme-inhibitor complex that yields a measurable heat of binding (Table 2). In the case of CA II, the titration of the enzyme by all benzenesulfonamide inhibitors yields exothermic peaks. However, in the case of CA I, except for pCEBS and MH 1.29 the exothermic peaks were either weaker (benzenesulfonamide) or of insufficient magnitude to measure (pAEBS and MH 1.25). In the comparison of inhibitor binding to CA isozymes, then, the most dramatic differences in ITC binding profiles are noted for pAEBS and MH 1.25: each of these inhibitors exhibits measurable heat of binding to CA II, but neither inhibitor exhibits a measurable heat of binding to CA I. Since pAEBS and MH 1.25 do indeed bind to CA I as demonstrated by kinetic and dansylamide displacement assays (Table 1), one interpretation regarding the lack of a significant heat signal could be that the binding of these inhibitors is dominated by favorable entropic changes.
Table 2.
Thermodynamic Parameters of CA-Inhibitor Complexation
| Enzyme | Inhibitor | n | Ka (M−1) | ΔH° (kcal/mol) | ΔS° (cal/mol-K) |
|---|---|---|---|---|---|
| CA I | BS | 0.9 | (3.8±0.7) × 105 | −7.1±0.3 | 1.7 |
| pAEBS | n.h.a | n.h.a | n.h.a | n.h.a | |
| MH 1.25 | n.h.a | n.h.a | n.h.a | n.h.a | |
| pCEBS | 0.8 | (1.6±0.3) × 106 | −9.0 ± 0.3 | −1.9 | |
| MH 1.29 | 0.8 | (1.1±0.4) × 107 | −9.9±0.4 | −1.1 | |
| CA II | BS | 0.8 | (1.7±0.3) × 106 | −9.1±0.3 | −2.1 |
| pAEBS | 0.9 | (2.1±0.1) × 105 | −8.9 ± 0.1 | −5.6 | |
| MH 1.25b | 0.8 | (1.0±0.6) × 107 | −13 ± 0.6 | −11.7 | |
| pCEBS | 1.0 | (2.6±0.4) × 106 | −11±0.3 | −7.7 | |
| MH 1.29 | 0.9 | (1.8±0.5) × 107 | −11±0.3 | −3.83 |
No heat of binding was measurable by isothermal titration calorimetry.
Thermodynamic parameters for the primary binding (a) site.
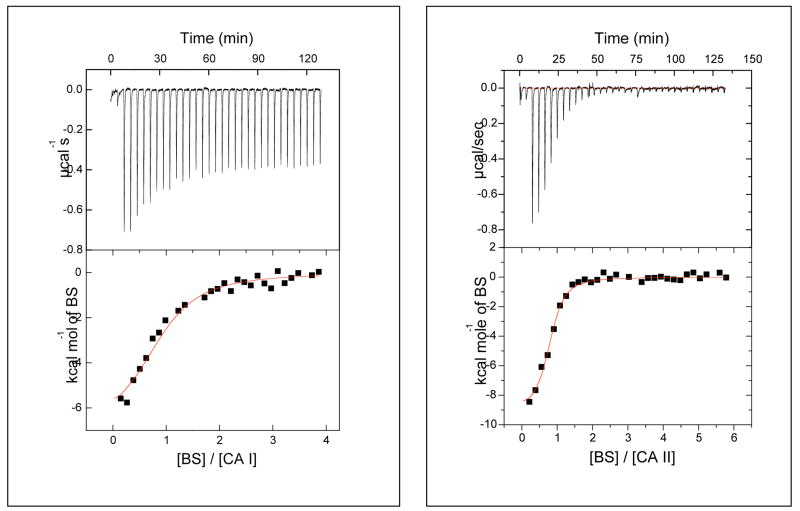
Figure 1 shows comparative microcalorimetric data for the binding of benzenesulfonamide to CA I and CA II. The best fit of the experimental data yields the stoichiometry (n), association constant (Ka), and enthalpic change (ΔH°) of 0.90, 3.8 × 10⁵ M−1, and −7.1 kcal/mol, respectively, against CA I, and corresponding values of 0.8, 1.7 × 10⁶ M−1, and −9.1 kcal/mol against CA II. Assuming standard states of 1 M, the above Ka values yield ΔG° values of −7.6 and −8.5 kcal/mol, respectively, for binding to CA I and CA II. From these data, the entropic contributions (ΔS°) are deduced to be 1.7 and −2.0 entropy units (cal/mol-K), respectively, for inhibitor binding to CA I and CA II. Although the magnitudes of these values seem relatively small, they are comparable in magnitude to ΔS values of 0 – 7 entropy units estimated for the transfer of a protein-bound water molecule to bulk solvent.13 That these values are opposite in sign indicates that benzenesulfonamide binding to CA I is favored by both enthalpic and entropic contributions, whereas binding to CA II is favored by enthalpic contributions but slightly opposed by entropic contributions.
Figure 1.
Isothermal microcalorimetric titration data for the binding of benzenesulfonamide (BS) to recombinant human carbonic anhydrase isozymes I (left panel) and II (right panel). The upper and lower panels represent the raw calorimetric data and fitted data, respectively. The solid smooth lines represent the best fit of the data for the binding of benzenesulfonamide to CA I (left panel) with stoichiometry n = 0.9, association constant Ka = 3.8 × 10⁶ M−1, and ΔH° = −7.1 kcal/mol. The corresponding parameters for the binding of benzenesulfonamide to CA II are 0.8, 1.7 × 10⁶ M−1, and − 9.1 kcal/mol, respectively.
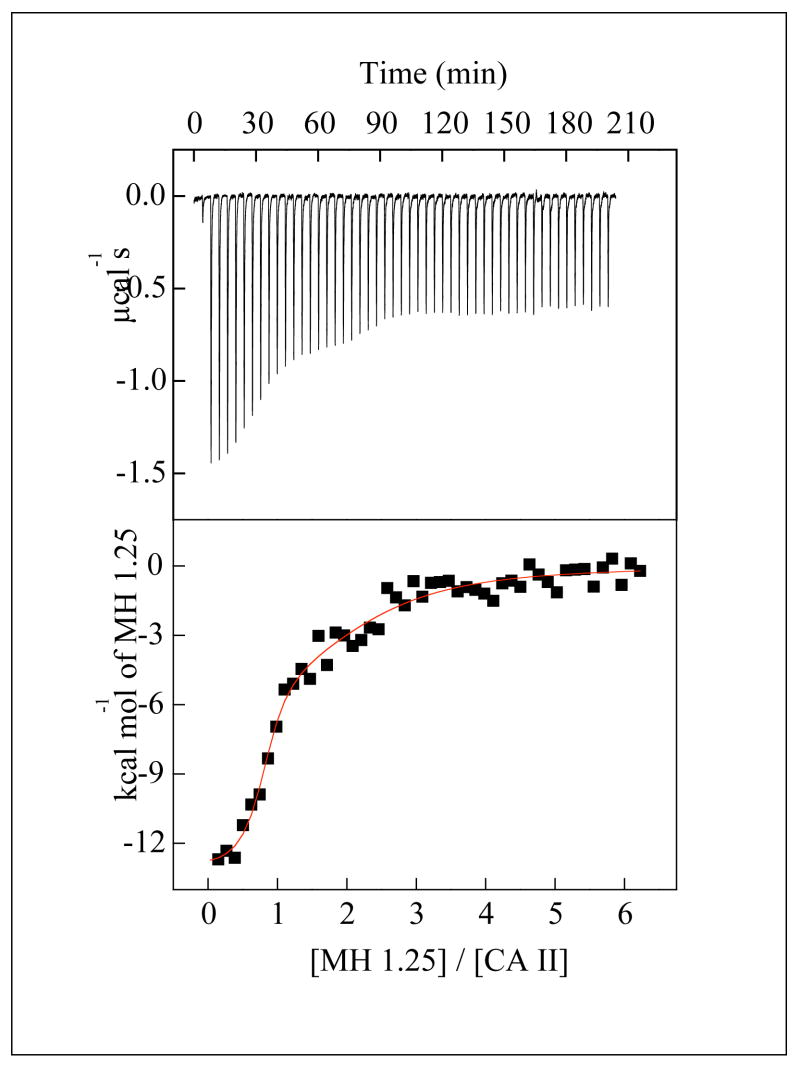
Thermodynamic parameters are recorded in Table 2 for the binding of all inhibitors for which heats of binding are measurable by ITC. With the exception of the CA II-MH 1.25 complex, all binding data conform to the expected 1:1 stoichiometry of each enzyme-inhibitor complex (0.8 < n < 1.0). As shown in Figure 2, the raw ITC data for the titration of CA II by MH 1.25 reveal two inflection points consistent with inhibitor binding to both the active site and a weaker secondary site near the N-terminus (vide infra).11 In general, each ITC-derived 1/Ka value is approximately equal to the corresponding Ki and Kd value of each inhibitor (Table 1). Irrespective of the benzenesulfonamide derivative, both ΔH° and ΔS° values are generally more negative (i.e., enthalpically more favorable and entropically more disfavored) for binding to CA II compared with binding to CA I. Thus, the favorable entropy (or the minimal unfavorable entropy) of inhibitor binding to CA I (Table 2) is not dependent on the electronic charge of groups attached to the benzenesulfonamide moiety, but instead is dependent on some feature of the enzyme structure.
Figure 2.
Isothermal microcalorimetric data for the binding of MH 1.25 to CA II. Note the raw data (top panel) shows two inflection points, consistent with two-site binding. The solid smooth line is the best fit of the data according to the two binding site model for the following stoichiometries (n1, n2), association constants (Ka1, Ka2), and enthalpic changes (ΔH°1, ΔH°2); 0.8, 1.5, 1.0 × 10⁷ M−1, 2.1 × 10⁵ M−1, −13.0 kcal mol−1, and −6.1 kcal mol−1, respectively.
X-ray crystallographic studies
High resolution (1.01 – 1.85 Å) crystal structures were determined for all enzyme-inhibitor complexes (Tables 3 and 4) except for the CA I-pAEBS complex, which yielded uninterpretable electron density for the inhibitor (consistent with low occupancy, a high degree of molecular disorder, or both). Inhibitor binding does not trigger any major structural changes in any of the enzyme-inhibitor complexes studied, and the root-mean-square deviations of backbone Cα atoms between the unliganded enzyme6c, 14 and each enzyme-inhibitor complex range from 0.266–0.299 Å for CA II and 0.307–0.344 Å for CA I. The benzenesulfonamide moiety of each inhibitor binds identically in the active site: the ionized sulfonamide NH− group coordinates to Zn2+ and donates a hydrogen bond to Oγ of T199, and one sulfonamide oxygen accepts a hydrogen bond from the backbone NH group of T199.
Table 3.
Crystallographic Data Collection and Refinement Statistics for CA II-Inhibitor Complexes
| Inhibitor Complex | pAEBS | MH 1.25 | pCEBS | MH 1.29 |
|---|---|---|---|---|
| Space Group | P21 | P21 | P21 | P21 |
| Unit Cell constants, (σ) (Å) | a = 42.289(5)
b = 41.440(6) c = 72.357(9) β = 104.558(8)° |
a = 42.264(2)
b = 41.338(4) c = 71.975(5) β = 104.496(4)° |
a = 42.280(2)
b = 41.361(3) c = 72.135(4) β = 104.500(3)° |
a = 42.339(5)
b = 41.189(6) c = 72.077(8) β = 104.838(7)° |
| Wavelength (Å) | 1.0000 | 0.9184 | 0.9184 | 1.0000 |
| No. measured reflections | 245,255 | 315,311 | 409,170 | 216,120 |
| No. unique reflections | 74,655 | 105,952 | 120,621 | 90,979 |
| Max resolution (Å) | 1.20 | 1.03 | 1.01 | 1.10 |
| Rmerge (outer shell)a | 0.076 (0.270) | 0.061 (0.283) | 0.064 (0.345) | 0.072 (0.348) |
| Completeness of data (outer shell) (%) | 98.8 (95.3) | 89.7 (56.9) | 95.4 (71.1) | 92.7 (87.2) |
| No. reflections used in refinement | 73,136 | 103,824 | 118,194 | 89,164 |
| No. reflections in test set | 1502 | 2111 | 2407 | 1802 |
| Rworkb | 0.1316 | 0.1293 | 0.1214 | 0.1327 |
| Rfreeb | 0.1647 | 0.1636 | 0.1481 | 0.1637 |
| No. nonhydrogen atomsc | 2375 | 2514 | 2493 | 2429 |
| No. solvent moleculesc | 273 | 364 | 340 | 256 |
| r.m.s.d. from ideality | ||||
| bond lengths (Å) | 0.013 | 0.014 | 0.016 | 0.015 |
| bond angles (°) | 2.3 | 2.4 | 2.3 | 2.4 |
| Dihedral angles (°) | 26.4 | 26.2 | 26.0 | 26.5 |
| Improper dihedral angles (°) | 1.60 | 1.68 | 1.72 | 1.74 |
| PDB accession codes | 2NNG | 2NNS | 2NNO | 2NNV |
Rmerge for replicate reflections, R = Σ|Ih − <Ih>|/Σ<Ih>; Ih is the intensity measured for reflection h; <Ih> is the average intensity for reflection h calculated from replicate data.
Crystallographic R factor, Rwork = Σ||Fo| − |Fc||/Σ|Fo| for reflections contained in the working set. Free R factor, Rfree = Σ||Fo| − |Fc||/Σ|Fo| for reflections contained in the test set held aside during refinement. |Fo| and |Fc| are the observed and calculated structure factor amplitudes, respectively.
per asymmetric unit
Table 4.
Crystallographic Data Collection and Refinement Statistics for CA I-Inhibitor Complexes
| Inhibitor Complex | MH 1.25 | pCEBS | MH 1.29 |
|---|---|---|---|
| Space Group | P212121 | P212121 | P212121 |
| Unit Cell constants (Å) | a = 62.4(1)
b = 72.3(1) c = 122.3(2) |
a = 62.422(8)
b = 71.82(1) c = 121.96(1) |
a = 62.28(1)
b = 71.82(1) c = 121.73(1) |
| Wavelength (Å) | 1.1271 | 1.1271 | 1.0000 |
| No. measured reflections | 560,061 | 392,855 | 181,031 |
| No. unique reflections | 80,458 | 65,427 | 46,613 |
| Max resolution (Å) | 1.55 | 1.65 | 1.85 |
| Rmerge (outer shell)a | 0.097 (0.549) | 0.099 (0.451) | 0.113 (0.391) |
| Completeness of data (outer shell) (%) | 99.9 (99.8) | 97.5 (98.2) | 98.6 (96.3) |
| No. reflections used in refinement | 78,912 | 61,854 | 41,995 |
| No. reflections in test set | 1581 | 2516 | 1759 |
| Rworkb | 0.2157 | 0.1996 | 0.1947 |
| Rfreeb | 0.2477 | 0.2222 | 0.2251 |
| No. nonhydrogen atomsc | 4601 | 4605 | 4526 |
| No. solvent moleculesc | 519 | 525 | 447 |
| r.m.s.d. from ideality | |||
| bond lengths (Å) | 0.005 | 0.006 | 0.006 |
| bond angles (°) | 1.3 | 1.4 | 1.3 |
| Dihedral angles (°) | 24.3 | 24.2 | 24.3 |
| Improper dihedral angles (°) | 0.77 | 0.83 | 0.81 |
| PDB accession codes | 2NMX | 2NN1 | 2NN7 |
Rmerge for replicate reflections, R = Σ|Ih − <Ih>|/Σ<Ih>; Ih is intensity measured for reflection h; <Ih> is average intensity for reflection h calculated from replicate data.
Crystallographic R factor, Rwork = Σ||Fo| − |Fc||/Σ|Fo| for reflections contained in the working set. Free R factor, Rfree = Σ||Fo| − |Fc||/Σ|Fo| for reflections contained in the test set held aside during refinement. |Fo| and |Fc| are the observed and calculated structure factor amplitudes, respectively.
per asymmetric unit
In CA II-inhibitor complexes, the para-substituted tail of each inhibitor is well-ordered and associates with the hydrophobic side of the active site cleft in the vicinity of P201 and P202. Polar groups in the tails of 3 inhibitors (pAEBS, pCEBS and MH 1.25) make hydrogen bonds with well-ordered solvent molecules but make no direct hydrogen bonds with enzyme residues. The ester moiety of MH 1.29 makes no hydrogen bond interactions. Each CA II active site also contains a glycerol molecule from the cryosolvent utilized for flash-cooling of protein crystals prior to X-ray data collection. This glycerol solvent molecule presumably displaces water solvent molecules and forms hydrogen bonds with N67 Nδ2, N67 Oδ1, Q92 Nε2, and 2 solvent molecules. The electron density map of the CA II-MH 1.25 complex (Figure 3a) illustrates representative features of all four CA II-inhibitor complexes, and a superposition of all four complexes is found in Figure 4a.
Figure 3.
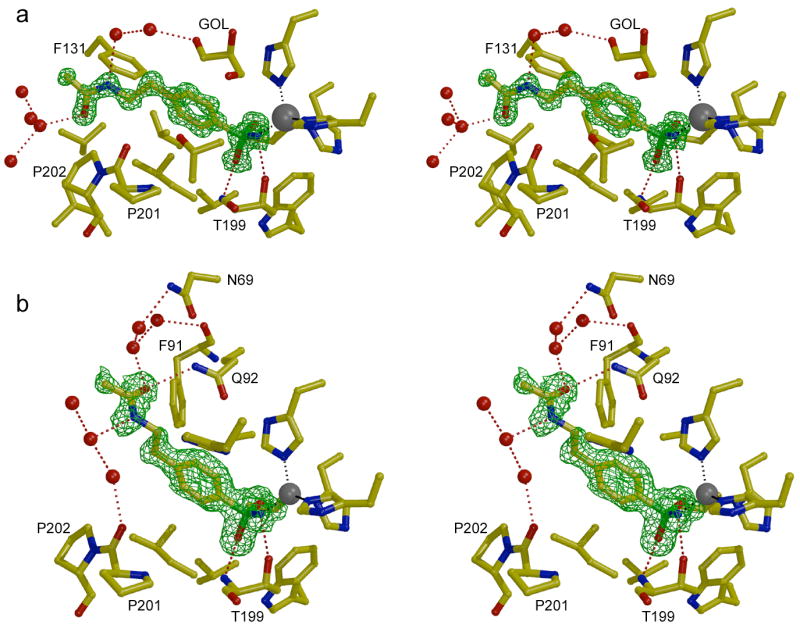
Omit maps showing the binding of inhibitor MH 1.25 to CA II (a) and CA I (b) contoured at 3σ. The zinc ion appears as a gray sphere and water molecules appear as red spheres. A glycerol cryosolvent molecule (GOL) also binds in the CA II active site. Hydrogen bond and metal coordination interactions are designated by red and gray dotted lines, respectively. Figure prepared with Bobscript and Raster3D.28
Figure 4.
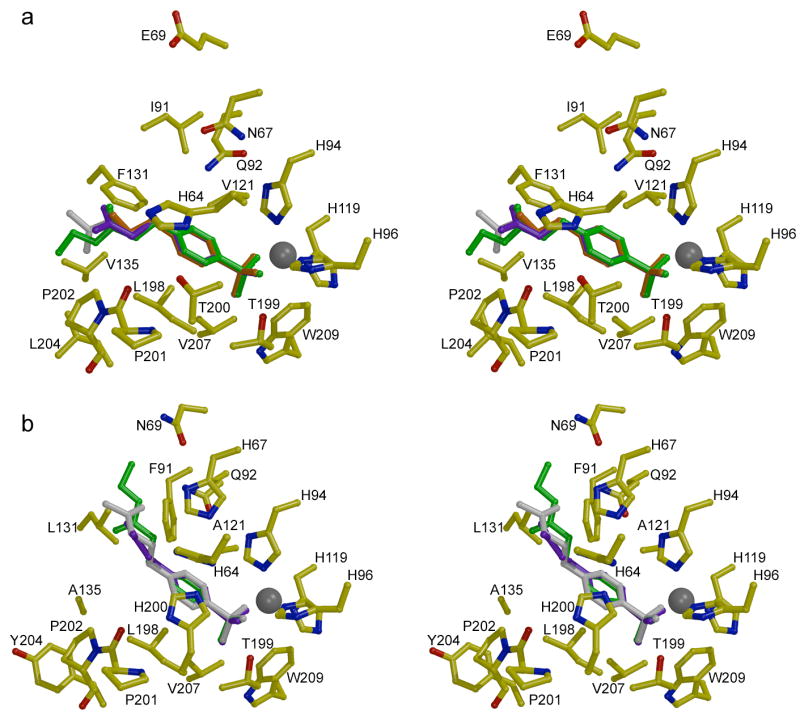
Stereo figures showing the structures of inhibitor complexes with (a) CA II and (b) CA I. The binding conformations of pAEBS (orange), pCEBS (purple), and MH 1.29 (green) are superimposed on each isozyme complex with MH 1.25 (white). Note that the para-substituted tails of inhibitors bound to CA II associate with P201-P202, but the tails of inhibitors bound to CA I associate with F91-Q92 on the opposite wall of the active site. Figure prepared with Bobscript and Raster3D.28
In three of the CA II-inhibitor complexes (MH 1.25, pCEBS, and MH 1.29), a second inhibitor molecule binds near the N-terminus of the enzyme at the rim of the active site (data not shown). The sulfonamide nitrogen forms hydrogen bonds to the carbonyl oxygen of H15 and to the carboxylate of D19 in a manner similar to that observed for certain other CA II inhibitors.11 However, in contrast with previous examples of inhibitor binding to this “b” site, there are no specific interactions between the inhibitor tail and the protein. Inhibitor binding to the weaker “b” site is presumably a consequence of the relatively high concentrations of inhibitors employed in the crystal soaking protocol used to prepare each crystalline enzyme-inhibitor complex.
The electron density map of the CA I-MH 1.25 complex (Figure 3b) illustrates representative features observed in all three CA I-inhibitor complexes. The inhibitors MH 1.25, pCEBS, and MH 1.29 bind solely in the active site of CA I, i.e., no binding is observed at a secondary site. The benzenesulfonamide moieties of these inhibitors make the same intermolecular interactions in their CA I complexes as observed in their CA II complexes. However, the tails of these inhibitors adopt significantly different conformations in CA I compared with CA II: the tails of inhibitors binding to CA I associate with the F91-Q92 wall of the active site, whereas the tails of inhibitors bound to CA II associate with the opposite wall of the active site defined by P201-P202. Other than a hydrogen bond between the amide carbonyl of MH 1.25 and the side chain NH2 group of Q92, polar groups in the tails of these inhibitors do not make any direct hydrogen bond interactions with CA I residues; instead, these substituents typically make 2–3 hydrogen bond interactions with well ordered solvent molecules. The superposition of the three CA I-inhibitor complexes is found in Figure 4b, where comparison with the CA II-inhibitor complexes in Figure 4a clearly reveals the differing conformations of the inhibitor tails in the two isozyme active sites.
Discussion
Four aspects of structure-affinity relationships are evident in the binding of differently charged benzenesulfonamide derivatives to CA I and CA II. First, the free amino group at the para position of benzenesulfonamide (i.e., pAEBS) is tolerated least well by CA I in comparison with CA II. Second, inhibitor binding to CA I is generally enthalpically less favorable and entropically more favorable than inhibitor binding to CA II. Third, although the benzenesulfonamide rings of different inhibitors adopt the same general orientation and make the same intermolecular contacts, their para-substituted tails associate with opposite walls in the active sites of CA I and CA II. Fourth, the preferred conformations of para-substituted tails are similar regardless of whether they are positively charged, negatively charged, or neutral: inhibitor tails always associate with the F91-Q92 wall of CA I and the P201-P202 wall of CA II.
All of the inhibitors studied, including the parent unsubstituted benzenesulfonamide, exhibit slightly higher binding affinities for CA II than for CA I (Table 1). Isozyme discrimination is most pronounced for pAEBS, which bears a positively charged amino substituent, and isozyme discrimination is rather modest for pCEBS, which bears a negatively charged carboxylate substituent. Possibly, the sensitivity to positive charge on the inhibitor tail results from electrostatic interactions with histidine residues on the surface of each isozyme. Inhibitor affinity for each isozyme is enhanced by acylation of pAEBS and pCEBS to yield neutral inhibitors MH 1.25 and MH 1.29, respectively. Microcalorimetric data reveal relatively weak isozyme discrimination for MH 1.25 and slightly stronger discrimination for MH 1.29, but in neither case does isozyme discrimination exceed a factor of 10-fold.
Additional insight on the binding of these inhibitors derives from the comparison of the enthalpic and entropic changes that accompany enzyme-inhibitor complexation. The active site cleft of each CA isozyme is fairly wide (15 Å) and deep (15 Å), roughly divisible into a hydrophobic half and a hydrophilic half.6 In spite of more negative binding entropies, CA II exhibits higher binding affinity than CA I for all of the ligands. This may derive in part from the presence of a hydrophobic niche in the midsection of the CA II active site, formed by residues F131, V135, L198, and L204, that acts as a somewhat constricted binding site for the p-derivatized inhibitor tails; this niche is less pronounced in CA I due to the substitutions F131L and V135A (Figure 4).
The midsection of the CA II active site cleft is slightly more constricted than that of CA I due in part to the presence of F131 and V135. X-ray crystallographic structure determinations of unliganded CA I and CA II reveal several ordered water molecules in each active site.6c,14 The release of these water molecules to bulk solvent, e.g., as triggered by inhibitor binding, is generally characterized by an enthalpic cost due to the disruption of favorable hydrogen bond and van der Waals interactions, and an entropic gain estimated to be 0 – 7 entropy units per solvent molecule released.13,15 The energetics of active site desolvation are offset by inhibitor binding, which is expected to yield an enthalpic gain due to new hydrogen bonds and van der Waals interactions in the complex, and a net entropic loss due to the fixed position, orientation, and conformation of the inhibitor in the enzyme active site (despite a small entropic gain due to additional vibrations in the enzyme-inhibitor complex).15,16 Except for the binding of benzenesulfonamide to CA I, the ITC data reported in Table 2 conform to this view of favorable enthalpic and unfavorable entropic changes. Moreover, the magnitudes of both ΔH° and ΔS° generally appear to be greater for inhibitor binding to CA II. Indeed, the magnitude of ΔS° appears to be greater for inhibitor binding to CA II compared with inhibitor binding to CA I, and especially so for the largest inhibitors MH 1.25 and MH 1.29. This is consistent with the hypothesis that the immobilization of inhibitor tails in the F131 hydrophobic niche contributes to the less favorable entropies of binding to CA II – the bigger the inhibitor tail, the bigger the entropic cost of binding.
Krishnamurthy and colleagues describe an additional phenomenon of enthalpy-entropy compensation in the binding of benzenesulfonamide inhibitors bearing p-substituted oligoglycine, oligosarcosine, and oligoethylene glycol chains containing 1-5 residues.15d These investigators find that ΔH° becomes less favorable and ΔS° becomes more favorable as the length of the oligomeric tail group increases. In other words, the enzyme-inhibitor interface is characterized by increasing residual disorder as the tail group becomes longer, and this is consistent with the results of X-ray crystallographic experiments.10a,10b Strikingly, ΔH° and −TΔS° nearly perfectly compensate each other such that an essentially invariant ΔG° is measured despite the different chemical structure of each oligomer and the different number of residues in each oligomer. Krishnamurthy and colleagues describe this as the “interfacial mobility” model of binding.15d The implications of these results for the design of tight-binding enzyme inhibitors is that the conformational entropy of the linker segment connecting two “prongs” of a bivalent enzyme inhibitor represents a substantial barrier to the simultaneous interaction of both prongs. This may explain the molecular disorder accompanying the binding of some, but not all, two-prong inhibitors containing different linker segments to CA II.11 As noted by Krishnamurthy, the use of more rigid linker segments in bivalent enzyme inhibitors would optimize the enthalpy and entropy of binding.15d
In conclusion, thermodynamic and X-ray crystallographic data for the binding of differently charged benzenesulfonamide derivatives to CA I and CA II provide important insight regarding the design of molecular linkers that can potentially be used to enhance or alter the affinity and specificity of bivalent enzyme inhibitors. The results reported herein suggest that positively charged moieties should be avoided in the design of linker segments, and such charges are more poorly tolerated by CA I compared with CA II. The structural basis for such charge discrimination may be due in part to unfavorable long range electrostatic interactions with histidine residues on the surface of each isozyme. Moreover, the results reported herein suggest that changes in the conformational entropy of p-substituted substituents of benzenesulfonamide inhibitors are more substantial for binding to CA II than to CA I, consistent with the slightly more constricted midsection of the active site cleft found in CA II. These insights regarding structure-affinity relationships for molecular linkers now inform the design of bivalent benzenesulfonamide inhibitors containing nanoscale molecular recognition elements, e.g., a fullerene-benzenesulfonamide, which we will report in due course.17
Experimental Methods
Materials
Zinc sulfate, ampicillin, chloramphenicol, Tris and IPTG were purchased from Life Science Resources, Milwaukee, WI; yeast extracts, and tryptone were purchased from Becton Dickinson, Sparks, MD; acetonitrile, p-aminoethylbenzenesulfonamide (pAEBS) and p-carboxyethylbenzenesulfonamide (pCEBS) were from Aldrich Chemicals, Milwaukee, WI; HEPES, p-aminomethylbenzenesulfonamide-agarose, p-nitrophenyl acetate, and PMSF were obtained from Sigma; dansylamide was purchased from Avocado Research Chemicals (Heysham, Lancashire, U.K.). All other chemicals were of reagent grade and were used without further purification.
Methods
The recombinant forms of human CA isozymes I and II (henceforth simply designated as CA I and CA II) were cloned, expressed, and purified as described previously.9a The enzyme concentrations were determined spectrophotometrically using ε280 = 49 mM−1 cm−1 and 54 mM−1cm−1 based on MW = 30,000 for CA I and CA II, respectively. The enzyme activities of CA I and CA II were measured in 25 mM HEPES buffer, pH 7.0, containing 10% acetonitrile (the standard buffer) at 25° C, utilizing 0.4 mM p-nitrophenyl acetate as substrate.18 Unless stated otherwise, all the experiments reported herein were performed in the above assay buffer.
Synthesis of benzenesulfonamide derivatives
4-(Acetyl-2-aminoethyl) benzenesulfonamide (MH 1.25) was synthesized by acylation reaction of the commercially available p-aminoethylbenzenesulfonamide. To a solution of 4-(2-aminoethyl) benzenesulfonamide (792 mg, 4 mmol) in DMF (15 mL), acetic anhydride (5 mL) was added and the reaction mixture was stirred at room temperature for 14 h. The solvents were evaporated under reduced pressure. Trace amounts of acetic anhydride present with the white residue were removed by the addition of toluene and the evaporation of the solvent under reduced pressure. The white solid was then dissolved in methanol and hexane was added slowly to precipitate the pure product (760 mg, 79%) as a white powder. 1H NMR (400 MHz, CDCl3) δ: 1.77 (s, 3H), 2.75–2.78 (t, 2H), 3.26–3.29 (q, 2H), 7.28 (s, 2H), 7.38 (d, 2H, J = 8 Hz), 7.74 (d, 2H, J = 8Hz), 7.90–7.94 (m, 1H). 13C NMR (100 MHz, CDCl3) δ: 23.24, 35.51, 40.19, 126.33, 129.73, 142.68, 144.42, 169.73.
 |
The p-carboxyethylbenzenesulfonamide ethyl ester (MH 1.29) was synthesized from the commercially available free acid p-carboxyethylbenzenesulfonamide (pCEBS) by the esterification reaction as detailed below. p-Aminosulfonyldihydrocinnamic acid (250 mg, 1.09 mmol) and p-toluenesulfonic acid (30 mg, 0.15 mmol) were taken up in ethanol (25 mL) and heated to reflux for 12 h. After evaporation of the solvent under reduced pressure, the oily residue was purified by column chromatography (SiO2/chloroform; Rf = 0.3). The pure product was obtained as a white solid (256 mg, 91%). 1H NMR (400 MHz, CDCl3) δ: 1.18–1.21 (t, 3H), 2.64–2.68 (t, 2H), 2.98–3.01 (t, 2H), 4.06–4.11 (q, 2H, J = 7 Hz), 7.39 (d, 2H, J = 8Hz), (7.81 d, 2H, J = 8 Hz). 13C NMR (100 MHz, CDCl3) δ: 17.24, 34.38, 39.01, 64.38, 130.09, 132.78, 145.74, 149.60, 176.98.
 |
Spectrophotometric studies for determining the Ki values of CA-inhibitor complexes
The steady-state kinetic experiments for CA I and CA II catalyzed reactions were performed on a Perkin-Elmer Lambda 3B spectrophotometer in the standard assay buffer, pH 7.0, as described previously.9a The initial rates of the enzyme-catalyzed reactions were measured by following the hydrolysis of the chromogenic substrate, pnitrophenyl acetate, at 348 nm. Due to the slow esterase activity of CA I and CA II, fairly high concentrations of the enzymes had to be utilized to reliably measure the initial rates of the enzyme reaction in the absence and presence of benzenesulfonamide derivatives as inhibitors. Under this situation, we analyzed the inhibition data (according the competitive inhibition model) by taking into account the free and bound inhibitor concentrations (Eq. 1).9a
| (1) |
Where v and v0 are initial rates in the presence and absence of inhibitors, and [I]t, [E]t and Ki represent total inhibitor, total enzyme, and the inhibition constant, respectively. The inhibition data were analyzed by Eq. 1 using the non-linear regression analysis software Grafit 4.0 to obtain the Ki values of inhibitors against both CA I and CA II.
Spectrofluorometric studies for determining the Kd values of CA-inhibitor complexes
The spectrofluorometric studies involving dansylamide as fluorescence probe were performed on Perkin Elmer lambda 50-B spectrofluorometer in the standard assay buffer pH 7.0. The binding of dansylamide to carbonic anhydrase results in a blue shift in the emission spectrum of the fluorophore with a marked enhancement in its quantum yield.19 Banerjee and coworkers provided evidence that the latter feature was more pronounced when dansylamide was bound at the active site of CA I as compared to that of CA II.20 The dissociation constants of the CA I-dansylamide and CA IIdansylamide complexes were determined as described previously.9a The dissociation constants (Kd) of CA-inhibitor complexes were determined by monitoring the fluorescence signals associated with the competitive displacement of dansylamide by inhibitors. The data were fitted by Eq. 2 using the non-linear regression analysis software Grafit 4.0.
| (2) |
Where E, D, and B are representative of enzyme (CA), dansylamide, and inhibitor, respectively. The suffix “t” denotes total concentration of the individual species. Kd and Kb are the dissociation constants of the enzyme-inhibitor and enzyme-dansylamide complexes, respectively.
Isothermal titration calorimetry of inhibitor binding to CA isozymes
The isothermal titration calorimetric experiments were performed on an MCS isothermal titration calorimeter (ITC). A complete description of its predecessor instrument (OMEGA-ITC), experimental strategies, and data analysis are given by Wiseman et al.21 The calorimeter was calibrated by known heat pulses as described in the MCS-ITC manual. During titration, the reference cell was filled with a 0.03% azide solution in water. Prior to the titration experiment, both the enzyme and ligand solution were thoroughly degassed. The sample cell was filled either with 1.8 mL (effective volume = 1.36 mL) of buffer (for control) or with an appropriately diluted enzyme. The contents of the sample cell were titrated with several aliquots (4 μL each) of the ligand. During the titration, the reaction mixture was constantly stirred at 400 rpm. The enzyme concentrations were adjusted by 2% (as recommended by the manufacturer) to include a dilution effect of the enzyme solution, which occurs following a buffer rinse.
All calorimetric titration data were presented after subtracting the background signal, deduced from the magnitude of heat pulses at the end of the titration. The raw experimental data were presented as the amount of heat produced per second following each injection of ligand into the enzyme solution (minus the blank) as a function of time. The amount of heat produced per injection was calculated by integration of the area under individual peaks by the Origin software. Final data are presented as the amount of heat produced per injection versus the molar ratio of ligand to enzyme. The data were analyzed according to Wiseman et al.,21 which yields stoichiometry (n), association constant (Ka) and the standard enthalpy changes (ΔH0) for the binding of inhibitors to CA I and CA II sites. The standard free energy change (ΔG0) for the binding was calculated according to the relationship ΔG0 = − RT lnKa. Given the magnitudes of ΔG0 and ΔH0, the standard entropy changes (ΔS0) for the binding process were calculated according to the standard thermodynamic equation, ΔG0 = ΔH0 − T ΔS0.
X-ray crystallographic studies of enzyme-inhibitor complexes
The purified forms of CA I and CA II9b were crystallized by the hanging drop method. For CA II crystallization, 5 μl of protein solution (10 mg/ml protein, 1 mM methyl mercuric acetate, 50 mM Tris-sulfate, pH 8.0) and 5 μl of precipitant solution (2.5 M (NH4)2SO4, 50 mM Tris-sulfate, pH 7.7) were mixed and suspended over a reservoir containing 1 ml of precipitant solution at 4° C. Crystals formed within 3 days. Single crystals were transferred to fresh sitting drops containing precipitant solution plus 1 mM inhibitor (from 20 mM stock in acetonitrile). After 1 day, crystals were transferred to a drop containing 30% glycerol, 70% precipitant solution, then flash cooled in liquid nitrogen.
For CA I crystallization, 5 μl of protein solution (11 mg/ml protein, 50 mM Tris-sulfate, pH 8.7) and 5 μl of precipitant solution (23% polyethylene glycol (PEG) 3350, 200 mM NaCl, and 100 mM HEPES, pH 7.1) were mixed and suspended over a reservoir containing 1 ml of precipitant solution at 4° C. Crystals formed within 2 weeks. Inhibitor solution (20 mM in acetonitrile) was added to crystallization drops to a final concentration of 2 mM. Crystals were allowed to equilibrate for 1 day prior to transfer to 5% glycerol, 95% precipitant solution, then flash cooled in liquid nitrogen.
X-ray diffraction data were collected at 100 K at the Advanced Light Source (Berkeley, CA), beamline 5.0.2, using an ADSC Quantum 315 CCD detector.22 Data were integrated and reduced using HKL200023 or CrystalClear (Rigaku/MSC, The Woodlands, TX). Diffraction data for each CA II crystal were indexed in space group P21 with one molecule in the asymmetric unit. Diffraction data for CA I were indexed in space group P212121 with two molecules in the asymmetric unit. Unit cell parameters and data reduction statistics are recorded in Tables 3 and 4.
The atomic coordinates of CA II refined at 1.54 Å resolution6d were obtained from the Research Collaboratory for Structural Bioinformatics Protein Data Bank (RCSB PDB) (accession code 2CBA)8 and used as a starting model for crystallographic refinement after deletion of nonprotein atoms. An initial round of rigid body refinement followed by simulated annealing and individual B factor refinement was performed using the program CNS 1.1.24 Model visualization and rebuilding was performed using the graphics program O 10.25 Locations of mercury and zinc ions were identified from peaks in |Fo| − |Fc| maps, and residue 206 was modeled as S-(methylmercury)-cysteine. Refinement was then continued using the program SHELX-97.26 Anisotropic refinement of all atoms led to a drop in Rfree of 0.0337 for the CA II-pAEBS complex, 0.0245 for the CA II-MH 1.25 complex, 0.0425 for the CA II-pCEBS complex, and 0.0385 for the CA II-MH 1.29 complex. The addition of riding hydrogen atoms to each model resulted in an additional decrease in Rfree of 0.0158 for the CA II-pAEBS complex, 0.0132 for the CA II-MH 1.25 complex, 0.0132 for the CA II-pCEBS complex, and 0.0157 for the CA II-MH 1.29 complex. Inhibitor molecules were identified from peaks in |Fo| − |Fc| maps and were gradually built into the models over several rounds of refinement; restraints on inhibitor bond angles and distances were taken from similar structures in the Cambridge Structural Database27 and standard restraints were used on protein bond angles and distances throughout refinement. Alternate conformations of disordered side chains and inhibitor molecules were modeled by fitting to positive and negative peaks in |Fo| − |Fc| maps. Water molecules were built into peaks >3σ in |Fo| − |Fc| maps that demonstrated appropriate hydrogen-bonding geometry.
The atomic coordinates of orthorhombic CA I refined at 1.55 Å resolution (PDB accession code 2FOY)11c were used as a starting model for crystallographic refinement after deleting non-protein atoms. An initial round of rigid body refinement followed by simulated annealing and individual B factor refinement was performed using the program CNS 1.1.24 Model visualization and rebuilding were performed using the graphics program O.25 Locations of zinc ions were identified from peaks in |Fo| − |Fc| maps. Water molecules that demonstrated appropriate hydrogen-bonding geometry were built into peaks >3σ in |Fo| − |Fc| maps. Inhibitor molecules were identified from peaks in |Fo| − |Fc| maps; refinement restraints on inhibitor bond angles and lengths were taken from the refined models of the CA II complexes.
Final refinement statistics for all structures of CA I- and CA II-inhibitor complexes are presented in Tables 3 and 4. The atomic coordinates of each structure have been deposited in the PDB with the accession codes listed in Tables 3 and 4.
Acknowledgments
This research was supported by the National Institutes of Health grants CA 113746 to DKS and SM, GM 63404 to SM, and GM 49758 to DWC. DWC was also supported in part by the Underwood Fellowship from the Biotechnology and Biological Sciences Research Council for sabbatical study in the Department of Biochemistry, University of Cambridge, where he also thanks Professor Sir Tom Blundell for stimulating scientific discussions. The crystallographic data were collected at the Cornell High Energy Synchrotron Source (CHESS), which is supported by the National Science Foundation grant DMR-0225180 and the National Institute of Health grant RR-01646.
Abbreviations
- BS
benzenesulfonamide
- pAEBS
para-aminoethyl benzenesulfonamide
- pCEBS
para-carboxyethyl benzenesulfonamide
- MH 1.25
4-(acetyl-2-aminoethyl) benzenesulfonamide
- MH 1.29
p-aminosulfonyldihydrocinnamic acid ethyl ester
- ITC
isothermal titration calorimetry
Contributor Information
D. K. Srivastava, Email: dk.srivastava@ndsu.nodak.edu.
Sanku Mallik, Email: sanku.mallik@ndsu.nodak.edu.
David W. Christianson, Email: chris@sas.upenn.edu.
References
- 1.(a) Schuman J. Expert Opin Drug Saf. 2002;1:181–194. doi: 10.1517/14740338.1.2.181. [DOI] [PubMed] [Google Scholar]; (b) Gray WD, Rauh CE. J Pharmacol Exp Ther. 1967;156:383–396. [PubMed] [Google Scholar]; (c) Barnish IT, Cross PE, Dickinson RP, Gadsby B, Parry MJ, Randall MJ, Sinclair IW. J Med Chem. 1980;23:117–121. doi: 10.1021/jm00176a003. [DOI] [PubMed] [Google Scholar]; (d) Pastorekova S, Parkkila S, Pastorek J, Supuran CT. J Enzyme Inh Med Chem. 2004;19:199–229. doi: 10.1080/14756360410001689540. [DOI] [PubMed] [Google Scholar]; (e) Scozzafava A, Mastrolorenzo A, Supuran CT. Expert Opin Ther Pat. 2006;16:1627–1664. doi: 10.1517/13543776.16.1.27. [DOI] [PubMed] [Google Scholar]
- 2.(a) Herkel U, Pfeiffer N. Curr Opin Ophthalmol. 2001;12:88–93. doi: 10.1097/00055735-200104000-00002. [DOI] [PubMed] [Google Scholar]; (b) Scozzafava A, Mastrolorenzo A, Supuran CT. Expert Opin Ther Pat. 2004;14:667–702. [Google Scholar]
- 3.(a) Maren TH. In: The Carbonic Anhydrases: New Horizons. Chegwidden WR, Carter ND, Edwards YH, editors. Birkhauser Verlag; Basel: 2000. pp. 425–435. [Google Scholar]; (b) Mansoor UF, Zhang X-R, Blackburn GM. In: The Carbonic Anhydrases: New Horizons. Chegwidden WR, Carter ND, Edwards YH, editors. Birkhauser Verlag; Basel: 2000. pp. 437–459. [Google Scholar]
- 4.Carbonic Anhydrase Inhibitors (Systemic) [(accessed Nov, 2006)]; http://www.mayoclinic.com/health/drug-information/DR202114.
- 5.(a) Supuran CT, Scozzafava A, Conway J. Carbonic Anhydrase: Its Inhibitors and Activators. CRC Press; Boca Raton, Florida: 2004. [Google Scholar]; (b) Supuran CT, Scozzafava A, Casini A. Med Res Rev. 2003;23:146–189. doi: 10.1002/med.10025. [DOI] [PubMed] [Google Scholar]; (c) Tripp BC, Smith K, Ferry JG. J Biol Chem. 2001;276:48615–48618. doi: 10.1074/jbc.R100045200. [DOI] [PubMed] [Google Scholar]
- 6.(a) Kannan KK, Notstrand B, Fridborg K, Lövgren S, Ohlsson A, Petef M. Proc Natl Acad Sci USA. 1975:51–55. doi: 10.1073/pnas.72.1.51. [DOI] [PMC free article] [PubMed] [Google Scholar]; (b) Liljas A, Kannan KK, Bergstén PC, Waara I, Fridborg K, Strandberg B, Carlbom U, Järup L, Lövgren S, Petef M. Nat New Biol. 1972;235:131–137. doi: 10.1038/newbio235131a0. [DOI] [PubMed] [Google Scholar]; (c) Håkansson K, Carlsson M, Svensson LA, Liljas A. J Mol Biol. 1992;227:1192–1204. doi: 10.1016/0022-2836(92)90531-n. [DOI] [PubMed] [Google Scholar]; (d) Mallis RJ, Poland BW, Chatterjee TK, Fisher RA, Darmawan S, Honzatko RB, Thomas JA. FEBS Lett. 2000:237–241. doi: 10.1016/s0014-5793(00)02022-6. [DOI] [PubMed] [Google Scholar]; (e) Stams T, Chen Y, Boriack-Sjodin PA, Hurt JD, Liao J, May JA, Dean T, Laipis P, Silverman DN, Christianson DW. Protein Science. 1998;7:556–563. doi: 10.1002/pro.5560070303. [DOI] [PMC free article] [PubMed] [Google Scholar]; (f) Stams T, Nair SK, Okuyama T, Waheed A, Sly WS, Christianson DW. Proc Natl Acad Sci USA. 1996;93:13589–13594. doi: 10.1073/pnas.93.24.13589. [DOI] [PMC free article] [PubMed] [Google Scholar]; (g) Boriack-Sjodin PA, Heck RW, Laipis PJ, Silverman DN, Christianson DW. Proc Natl Acad Sci USA. 1995;92:10949–10953. doi: 10.1073/pnas.92.24.10949. [DOI] [PMC free article] [PubMed] [Google Scholar]; (h) Whittington DA, Waheed A, Ulmasov B, Shah GN, Grubb JH, Sly WS, Christianson DW. Proc Natl Acad Sci USA. 2001;98:9545–9550. doi: 10.1073/pnas.161301298. [DOI] [PMC free article] [PubMed] [Google Scholar]; (i) Whittington DA, Grubb JH, Waheed A, Shah GN, Sly WS, Christianson DW. J Biol Chem. 2004;279:7223–7228. doi: 10.1074/jbc.M310809200. [DOI] [PubMed] [Google Scholar]
- 7.(a) Geysen HM, Schoenen F, Wagner D, Wagner R. Nat Rev Drug Discov. 2003;2:222–230. doi: 10.1038/nrd1035. [DOI] [PubMed] [Google Scholar]; (b) Jager S, Brand L, Eggeling C. Curr Pharm Biotechnol. 2003;4:463–476. doi: 10.2174/1389201033377382. [DOI] [PubMed] [Google Scholar]
- 8.Berman HM, Westbrook J, Feng Z, Gilliland G, Bhat TN, Weissig H, Shindyalov IN, Bourne PE. Nucleic Acids Res. 2000;28:235–242. doi: 10.1093/nar/28.1.235. [DOI] [PMC free article] [PubMed] [Google Scholar]
- 9.(a) Scozzafava A, Supuran CT. Journal of Enzyme Inhibition. 1999;14:343–363. doi: 10.3109/14756369909030328. [DOI] [PubMed] [Google Scholar]; (b) Popescu A, Simion A, Scozzafava A, Briganti F, Supuran CT. Journal of Enzyme Inhibition. 1999;14:407–423. doi: 10.3109/14756369909030332. [DOI] [PubMed] [Google Scholar]; (c) Kim CY, Whittington DA, Chang JS, Liao J, May JA, Christianson DW. J Med Chem. 2002;45:888–893. doi: 10.1021/jm010163d. [DOI] [PubMed] [Google Scholar]; (d) Gupta SP, Kumaran S. Journal of Enzyme Inhibition & Medicinal Chemistry. 2005;20:251–259. doi: 10.1080/14756360500067439. [DOI] [PubMed] [Google Scholar]; (e) Innocenti A, Villar R, Martinez-Merino V, Gil MJ, Scozzafava A, Vullo D, Supuran CT. Bioorg Med Chem Lett. 2005;15:4872–4876. doi: 10.1016/j.bmcl.2005.04.078. [DOI] [PubMed] [Google Scholar]; (f) Mincione F, Starnotti M, Masini E, Bacciottini L, Scrivanti C, Casini A, Vullo D, Scozzafava A, Supuran CT. Bioorg Med Chem Lett. 2005;15:3821–3827. doi: 10.1016/j.bmcl.2005.06.054. [DOI] [PubMed] [Google Scholar]; (g) Özensoy Ö, Puccetti L, Fasolis G, Arslan O, Scozzafava A, Supuran CT. Bioorg Med Chem Lett. 2005;15:4862–4866. doi: 10.1016/j.bmcl.2005.08.048. [DOI] [PubMed] [Google Scholar]; (h) Hillebrecht A, Supuran CT, Klebe G. ChemMedChem. 2006:839–853. doi: 10.1002/cmdc.200600083. [DOI] [PubMed] [Google Scholar]
- 10.(a) Boriack PA, Christianson DW, Kingery-Wood J, Whitesides GM. J Med Chem. 1995:2286–2291. doi: 10.1021/jm00013a004. [DOI] [PubMed] [Google Scholar]; (b) Bunn AMC, Alexander RS, Christianson DW. J Am Chem Soc. 1994;116:5063–5068. [Google Scholar]; (c) Elbaum D, Nair SK, Patchan MW, Thompson RB, Christianson DW. J Am Chem Soc. 1996;118:8381–8387. [Google Scholar]; (d) Alterio V, Vitale RM, Monti SM, Pedone C, Scozzafava A, Cecchi A, De Simone G, Supuran CT. J Am Chem Soc. 2006;128:8329–8335. doi: 10.1021/ja061574s. [DOI] [PubMed] [Google Scholar]
- 11.Jude KM, Banerjee AL, Haldar MK, Manokaran S, Roy B, Mallik S, Srivastava DK, Christianson DW. J Am Chem Soc. 2006;128:3011–3018. doi: 10.1021/ja057257n. [DOI] [PMC free article] [PubMed] [Google Scholar]
- 13.Dunitz JD. Science. 1994;264:670. doi: 10.1126/science.264.5159.670. [DOI] [PubMed] [Google Scholar]
- 14.Kannan KK, Ramanadham M, Jones TA. Ann N Y Acad Sci. 1984;429:49–60. doi: 10.1111/j.1749-6632.1984.tb12314.x. [DOI] [PubMed] [Google Scholar]
- 15.(a) Tanford C. The Hydrophobic Effect: formation of micelles and biological membranes. 2. Wiley; New York: 1980. [Google Scholar]; (b) Dill KA. Biochemistry. 1990;29:7133–7155. doi: 10.1021/bi00483a001. [DOI] [PubMed] [Google Scholar]; (c) Rowe ES, Zhang F, Leung TW, Parr JS, Guy PT. Biochemistry. 1998;37:2430–2440. doi: 10.1021/bi9721602. [DOI] [PubMed] [Google Scholar]; (d) Krishnamurthy VM, Bohall BR, Semetey V, Whitesides GM. J Am Chem Soc. 2006;128:5802–5812. doi: 10.1021/ja060070r. [DOI] [PMC free article] [PubMed] [Google Scholar]
- 16.Sturtevant JM. Proc Natl Acad Sci USA. 1977;74:2236–2240. doi: 10.1073/pnas.74.6.2236. [DOI] [PMC free article] [PubMed] [Google Scholar]
- 17.Zakharian T, Jude KM, Christianson DW. study in progress. [Google Scholar]
- 18.Pocker Y, Stone JT. Biochemistry. 1967;6:668–678. doi: 10.1021/bi00855a005. [DOI] [PubMed] [Google Scholar]
- 19.Chen RF, Kernohan JC. J Biol Chem. 1967;242:5813–5823. [PubMed] [Google Scholar]
- 20.Banerjee AL, Tobwala S, Ganguly B, Mallik S, Srivastava DK. Biochemistry. 2005;44:3673–3682. doi: 10.1021/bi0475018. [DOI] [PubMed] [Google Scholar]
- 21.Wiseman T, Williston S, Brandts JF, Lin LN. Anal Biochem. 1989;179:131–137. doi: 10.1016/0003-2697(89)90213-3. [DOI] [PubMed] [Google Scholar]
- 22.Szebenyi DME, Arvai A, Ealick S, LaIuppa JM, Nielson C. Journal of Synchrotron Radiation. 1997;4:128–135. doi: 10.1107/S0909049597000204. [DOI] [PubMed] [Google Scholar]
- 23.Otwinowski Z, Minor W. Methods Enzymol. 1997;276:307–326. doi: 10.1016/S0076-6879(97)76066-X. [DOI] [PubMed] [Google Scholar]
- 24.Brünger AT, Adams PD, Clore GM, DeLano WL, Gros P, Grosse-Kunstleve RW, Jiang JS, Kuszewski J, Nilges M, Pannu NS, Read RJ, Rice LM, Simonson T, Warren GL. Acta Cryst. 1998;D54:905–921. doi: 10.1107/s0907444998003254. [DOI] [PubMed] [Google Scholar]
- 25.Jones TA, Zou JY, Cowan SW, Kjeldgaard M. Acta Cryst. 1991;A47:110–119. doi: 10.1107/s0108767390010224. [DOI] [PubMed] [Google Scholar]
- 26.Sheldrick GM, Schneider TR. Methods Enzymol. 1997;277:319–343. [PubMed] [Google Scholar]
- 27.Allen FH. Acta Cryst. 2002;B58:380–388. [Google Scholar]
- 28.(a) Merritt EA, Murphy MEP. Acta Cryst. 1994;D50:869–873. doi: 10.1107/S0907444994006396. [DOI] [PubMed] [Google Scholar]; (b) Kraulis PJ. J Appl Crystallogr. 1991;24:946–950. [Google Scholar]; (c) Esnouf RM. Journal Of Molecular Graphics & Modelling. 1997;15:132–134. doi: 10.1016/S1093-3263(97)00021-1. [DOI] [PubMed] [Google Scholar]


