

Abstract
Single cell electroporation was performed using electrolyte-filled capillaries on fluorescently labeled A549 cells. Cells were exposed to brief pulses (50 − 300 ms) at various cell-capillary tip distances. Cell viability and electroporation success were measured. In order to understand the variability in single cell electroporation, logistic regression was used to determine whether the probabilities of cell survival and electroporation depend on experimental conditions and cell properties. Both experimental conditions and cell properties (size and shape) have a significant effect on the outcome. Finite element simulations were used to compare bulk electroporation to single-cell electroporation in terms of cell size and shape. Cells are more readily permeabilized and are more likely to survive if they are large and hemispherical as opposed to small and ellipsoidal with a high aspect ratio. The dependence of the maximum transmembrane potential across the cell membrane on cell size is much weaker than it is for bulk electroporation. Observed survival probabilities are related to the calculated fraction of the cell's surface area that is electroporated. Observed success of electroporation is related to the maximum transmembrane potential achieved.
INTRODUCTION
The cell membrane acts as a barrier to the free diffusion of molecules and ions such as DNA, RNA, proteins, drugs, etc. between the cytoplasm and the external medium. Electroporation1-5 is a technique that uses electric fields to temporarily permeabilize the cell membrane by inducing a transmembrane potential. When the transmembrane potential reaches a critical value of about 250 mV, transient pores appear in the membrane. During the effective pore open time, impermeable molecules can freely diffuse into the cell interior. It is now routinely used in cell biology and biotechnology for gene transfection2, 6-8, and in medical applications for gene therapy9 and cancer chemotherapy10.
A biological cell placed in a uniform electric field results in a local distortion of the field near the cell. As the conductivity of the cell membrane is several orders of magnitude lower than the cytoplasm and the extracellular medium, most of the field is concentrated across the membrane. Analytical solutions exist for the transmembrane potential for spherical cells in a uniform electric field. The most general form of the steady-state transmembrane potential induced on the spherical cells is given by the Schwan equation 11:
| (1) |
where ΔΦ is the induced transmembrane potential, E is the external electric field, r is the radius of the cell, and θ is the polar angle measured from the center of the cell with respect to the direction of the field. The steady state, to which Eq. 1 applies, is reached on the microsecond timescale12. Schwan's equation shows that at a given electric field transmembrane potential depends on the cell size. Schwan's equation has now been further extended to calculate the transmembrane potential on prolate and oblate spheroidal cells. Kotnik et al.13 have proposed an analytical solution of transmembrane potential on spheroidal cells in homogeneous electric fields with the polar radius parallel to the electric field vector. Further, Gimsa et al.14, 15 have calculated the transmembrane potential on arbitrarily oriented spheroidal cells in an electric field. However, all these calculations apply for a uniform electric field.
Single-cell electroporation has been performed using modified patch clamp techniques 16, micropipettes 17, and electrolyte-filled capillaries 18. Unlike bulk electroporation3-5, 19, fields produced in single-cell electroporation are highly focused and inhomogeneous. The inhomogeneity is particularly evident when the tip opening diameter is smaller than the cell diameter, and the tip is near the cell. The Schwan equation does not apply if the electric field is inhomogeneous.
The analysis of the cytoplasmic contents of single cells using microfluidics and separations (capillary electrophoresis) is a burgeoning field20-29. Typically, the single cells are destroyed in the process of analysis. While we do not realize this goal in the present paper, we do look forward to the analysis of single, adherent (i.e., in a ‘natural’ state) cells without killing them in the process. Recent reports using nanoelectrodes30 and chemical permeabilizing agents to introduce enzyme substrates into single cells31 justify our optimism. Single-cell electroporation has the capability to open a ‘window’ onto the cell's contents permitting (in principle) analysis of cytoplasmic effluent. However, as an approach to single-cell sampling, it must be reproducible, and the dependence of the outcome on experimental and cellular parameters must be known.
Thus, we performed single-cell electroporation using an electrolyte-filled capillary at various pulse durations and cell-capillary tip distances. From these experiments we determined the electroporation success and cell viability. Logistic regression was carried out on cell viability and electroporation success. From the regression results it was found that both the experimentally controlled parameters and the cell attributes (size and shape) play a significant role in cell permeabilization (p < 0.05). Further, finite element simulations were performed to compare the single-cell electroporation results with bulk electroporation.
EXPERIMENTAL SECTION
Materials
The chemicals used for buffer preparations were all analytical grade and were purchased from Sigma (St. Louis, MO). Thioglo-1 was purchased from Covalent Associates (Woburn, MA). Propidium iodide and calcein AM were purchased from Invitrogen/Molecular probes (Eugene, OR). A549 cell lines were obtained from American Type Culture Association (Manassas, VA). Basal medium Eagle (BME), Trypsin-EDTA, fetal bovine serum (FBS), L-glutamine and penicillin were all obtained from Gibco-BRL (Carlsbad, CA). Milli-Q (Millipore Synthesis A 10, Billerica, MA) water was used. Intracellular buffer consisted of NaCl, 5 mM; KCl, 140 mM; MgCl2, 1.5 mM; D-glucose, 10 mM; HEPES, 20 mM; pH adjusted to 7.4.
Cell culture
Basal medium Eagle, supplemented with 10 % fetal bovine serum, and 1% antibiotic was used to culture human lung cancer A549 cells. Cells were grown in 75 mL cell culture flasks in a CO2 cell culture incubator (HERA cell incubator, Newtown, CT) at 37 °C and 5% CO2 to about 80% confluency. Before the experiments, cells were plated on 35 mm glass bottom cell-culture dishes (MatTek Corporation, Ashland, MA) and were grown for 1−3 days. Experiments were performed on the 2nd and 3rd day following the cell plating. Details of single-cell electroporation can be found elsewhere 32.
Cell staining
The cells were stained with cell-permeable dye Thioglo-1 (2 μM in intracellular buffer) for 30 seconds at room temperature. Thioglo-1 is a maleimide-based reagent which gives a highly fluorescent product upon its reaction with active –SH groups in proteins, enzymes, and small peptides33, 34. Cells were washed and bathed in the intracellular buffer and mounted on the cell chamber (DH 35i culture dish incubator, Warner Instruments, Holliston, MA) and transferred to the stage of the microscope.
Probe preparation
To perform electroporation experiments, fused-silica capillaries from Polymicro Technology (Phoenix, AZ) were used as a probe. Capillaries were pulled with a CO2 laser puller (Sutter Instruments Co. P-2000, Novato, CA) using a one line program i.e. Heat: 260; Filament: 0; Velocity: 30; Delay: 128; Pull: 0. This one line program created reproducible capillaries with a short pulled tip with an inner diameter of about 5 μm. The final length of the capillaries was 15 cm.
Electroporation Setup
The experimental setup is depicted in Figure 1. The fifteen-cm long pulled capillary with a tip about 5 μm in diameter was positioned using a high-graduation micromanipulator (Narishige, NMN-21, Tokyo, Japan). The observed distance between the capillary tip and the cell (dm) was the projection of the capillary image in the horizontal imaging plane (cell dish surface). These distances (dm) were 2.0 μm, 3.5 μm, 5.0 μm, 7.0 μm, and 10.0 μm. The other end of the capillary was placed in a vial filled with intracellular buffer. A platinum electrode placed in this vial was connected to the electroporator (ECM 830, BTX Instruments, San Diego, CA) and the electrical circuit was completed with a grounded platinum electrode placed in the cell dish. For elongated cells the capillary tip was always positioned near the ‘long’ side of the cell, thus the major axis of the hemispheroidal cell and the symmetry axis of the capillary are perpendicular.
Figure 1.

Schematic diagram of the experimental setup. Cultured cells were mounted in a chamber on the microscope stage. The tapered outlet end of the capillary was positioned close to a fluorescent cell with the help of a micromanipulator. The inlet end of the capillary was placed in a buffer-filled vial. The setup was connected to a high voltage power supply.
Electroporation
Cells were exposed to single pulses of 500 V with pulse durations ranging from 50 ms-300 ms. This will be referred as ‘pulsing’ of the cells. For all these pulsing conditions the distance between the tip of the capillary and the cell varied from 2.0 μm-10 μm. The pulse was applied at 25.0 seconds from the start of the acquisition. Diffusive loss of fluorescent thiol adducts from the cell interior was determined quantitatively with Simple PCI software (Compix, Inc., Sewickley, PA). The smallest distinguishable intensity change was about 4% of the signal. This was chosen as a threshold value for determination of electroporation success. For a cell to be considered permeabilized it had to loose 4% or more of its fluorescence intensity within 90 s of electroporation.
Fluorescence Imaging
Cells were observed through a 40 × 1.3 NA oil immersion objective using an inverted microscope (Olympus, IX 71, Melville, NY) equipped with an HBO 100 W mercury lamp as the excitation source. For Thioglo-1, an Omega fluorescence cube (specially built, Omega, Brattleboro, VT) was used with filters for excitation at 378 nm and emission at 480 nm. For live/dead imaging, DA/FI/TX-3X-A, a triple band pinkel filter set from Semrock (Rochester, NY) was used (Exciter 1: 387 ≤ λex, Exciter 2: 494≤ λex, Exciter 3: 572 ≤ λex, Emission: 457, 530, 628 ≤ λem ) . A charged couple device (CCD) camera (Hamamatsu, ORCA-285, Bridgewater, NJ) imaged cells. The image collection frequency was one frame per second. Image processing was performed by the image acquisition software from Compix (Simple PCI). All the data were corrected for photobleaching.
Cell Viability Assay
Following electroporation experiments, live/dead analysis was performed on the cells using calcein AM and propidium iodide35. Cell survival percentage was calculated for each experimental condition based on this live/dead assay. It is important to note that a measurement of cell viability was made on each cell that was electroporated.
Cell properties
The cell properties were obtained by using the Compix software. A macro file was set to a certain critical value. The cell measurements were then done according to the cell size, cell shape and intensity. The cell size factors used were area, diameter, perimeter, breadth and width. The shape factor used was the aspect ratio (maximum length/ maximum breadth). The intensity factors used were grey-level and standard deviation of the grey level. The parameter ‘grey-level’ is the average of the grey-level intensity of each pixel in the object corresponding to the average fluorescence intensity.
Simulation
The finite element method was used to compute the potential distribution in the experimental system using Comsol 3.2a (Comsol Inc., Burlington, MA). This enables the calculation of a transmembrane potential (TMP) for cells. The TMP varies across the cell surface. Electroporation occurs when TMP is greater than some critical value, TMPc which is often given as 0.25 V. The area of the cell membrane over which the TMP is greater than TMPc is called A*. The fraction of the hemispherical cell's area corresponding to A* will be called F*. The capillary is positioned 45 degrees with respect to surface normal (Fig. 1). The center of the tip opening in all calculations is positioned 5 micrometers above the surface and at the specified distance from the cell. In comparison to prior computational work on electroporation from the top (capillary 90 °C to the surface) in which cylindrical symmetry could be invoked36, a full, three-dimensional simulation was performed. In single-cell electroporation simulations, a realistic model of the capillary tip shape was used. For the simulation geometries, the equation ▽(σ▽V ) = 0 was solved to determine the potential inside and outside the cell, with appropriate boundary conditions. Here V is the potential and σ is the conductivity. A steady state condition was assumed. It is important, especially in 3-D simulations, to avoid simulating unnecessary parts of the experiment. One such part is the potential inside the capillary – it is very reproducible in the cylindrically symmetrical calculations as, e.g., tip-cell distance changes. Thus, a boundary condition was specified a mere 2.0 μm up into the capillary lumen from the tip. When that potential (which is independent of radius) is 6.76 V it corresponds to the experimental situation in which we apply 500 V at the distal end of the capillary 15 cm away from the tip. The ground electrode was a 90 degree section of the simulated cylindrical bath (0.5 mm radius, 0.5 mm height) opposite the tip opening. Parameters of the solutions and membrane used in the simulations are in Zudans et al.36
3-D simulations were performed for hemispherical cells of three sizes: small, median, and large cell with diameters 19 μm, 25 μm, and 39 μm respectively (corresponding to the 5th, 50th and 95th %ile of our cells). 3-D simulations were also performed for hemispheroidal cells of three sizes: small, median, and large cell with an aspect ratio of 3. The major and minor axes of the spheroidal cells were set so that the projected area was independent of aspect ratio. This allows us to separate the variables of ‘size’ and ‘shape’. The projected area is the apparent area under the microscope. Simulations were performed for the real conditions where the major axis of the spheroidal cell was perpendicular to the symmetry axis of the capillary. Results of the simulations of the hemispheroidal cells are shown in the supplementary material Figure S1-S3).
Statistical analysis
Data from 226 cells from the electroporation experiments were used for statistical analysis. As the outcomes, cell survivability (live/dead) and electroporation success, are binary, logistic regression was used for analysis using the program STATA (Intercooled 9.0). The dependent variables used for logistic regression were the cell properties and the experimental conditions. In the logistic ‘model’, the effects of the parameters are independent of each other. The cell properties were first transformed in order to get a normal distribution. The logistic regression was run on transformed values of cell properties. These transformed variables were then later untransformed to get the probabilities of cell survivability and electroporation success. The experimental parameters used for logistic regression were pulse duration (50 − 300 ms) and cell-capillary tip distance (2−10 μm).
RESULTS
Logistic Regression
Table 1 gives the correlation matrix of the cell properties. It can be seen from the table, and as was expected, that the cell size parameters: area, diameter, perimeter, width are highly correlated. Factor analysis (maximum likelihood estimation with varimax rotation) was performed on all the cell properties to determine the number of factors that explained most of the variance. Also, data were transformed to create near normal distributions for a function of the variables. Three factors explained virtually all of the variance (Table 2). Factor loadings greater than or equal to 0.60 are highlighted in the Table. The factors correspond to ‘size’ (factor 1), ‘shape’ (factor 2), and ‘intensity’ (factor 3). Factor 1 explains 66% of the variance, factor 2 explains 21% of the variance, and factor 3 explains 13% of the variance.
Table 1.
Correlation matrix of cell properties.
| Area | Diameter | Perimeter | Breadth | Width | Aspect Ratio | Stdev grey-level | Grey-level | |
|---|---|---|---|---|---|---|---|---|
| Area | 1.00 | |||||||
| Diameter | 0.99 | 1.00 | ||||||
| Perimeter | 0.92 | 0.92 | 1.00 | |||||
| Breadth | 0.68 | 0.70 | 0.47 | 1.00 | ||||
| Width | 0.82 | 0.81 | 0.82 | 0.47 | 1.00 | |||
| Aspect Ratio | 0.36 | 0.36 | 0.62 | −0.02 | 0.38 | 1.00 | ||
| Stdev grey-level | −0.44 | −0.47 | −0.37 | −0.46 | −0.43 | −0.07 | 1.00 | |
| Grey-level | −0.42 | −0.42 | −0.52 | −0.18 | −0.45 | −0.43 | 0.47 | 1.00 |
Table 2.
Factor loadings and unique variances. The shaded areas represent absolute values of the factor loading greater than or equal to 0.6.
| Variable | Factor 1 | Factor 2 | Factor 3 | Uniqueness |
|---|---|---|---|---|
| Area | 0.97 | 0.15 | −0.14 | 0.01 |
| Diameter | 0.97 | 0.14 | −0.17 | 0.00 |
| Perimeter | 0.84 | 0.51 | −0.13 | 0.01 |
| Breadth | 0.72 | −0.34 | −0.25 | 0.30 |
| Width | 0.76 | 0.26 | −0.24 | 0.30 |
| Aspect Ratio | 0.25 | 0.80 | −0.04 | 0.29 |
| Stdev grey-level | −0.38 | 0.03 | 0.60 | 0.51 |
| Grey-level | −0.29 | −0.40 | 0.52 | 0.50 |
Ultimately, based on these factor analysis results, the most significant uncorrelated variables were taken. These variables were area, aspect ratio and standard deviation of grey-level. Logistic regression was performed to study the cell survivability and electroporation success based on these cell properties and experimental conditions.
In logistic regression, the following model is used;
| (2) |
| (3) |
where the odds ratio, OR, is related to the probability of the event, P, as shown in eq. 2. The regression determines the coefficients, bi, corresponding to independent variables xi. This sort of regression is applied to problems with a binary outcome (e.g., live/dead, on/off)37. A linear regression of “probability” on the variables is not appropriate, as there is nothing inherent in linear regression limiting the outcome to the range of 0 to 1. As eq. 4 shows, the probability is a sigmoidal function of the variables.
| (4) |
The results from logistic regression analysis on cell survivability are listed in Table 3. There are results from two separate regressions. The left three columns correspond to regression on the untransformed, unscaled variables. The right three columns correspond to regression on transformed, scaled variables. Transformation was described above. Scaling is used to yield regression coefficients near unity for convenience. The results indicate that there is a significant (p < 0.05) relationship between cell survivability and experimental conditions: pulse duration, cell-capillary tip distance, and cell properties: area, and aspect ratio. The standard deviation of the grey-level showed a borderline significance (p = 0.097). The results from logistic regression on electroporation success are listed in Table 4. The results show that there is significant relationship between electroporation success and experimental conditions: pulse duration, cell-capillary tip distance and cell parameter: area. The logistic regression was also carried out to study the effect of cell survivability and electroporation success on the interaction terms between cell properties and experimental conditions. Interaction terms were generated by taking the products of experimental conditions (pulse duration and cell-capillary tip distance) and cell properties (area, aspect ratio and standard deviation of grey level). None of the interaction terms showed any effect on cell survivability (p > 0.05) and electroporation success (p > 0.05).
Table 3.
Results of logistic regression analysis of cell survivability (Alive) as a function of experimental conditions and cell properties.
| Alive | Odds Ratio | P value | Variables (transformed) | Odds Ratio | p value |
|---|---|---|---|---|---|
| PulseDuration | 0.987 | 0.000 |
PulseDuration 50 |
0.50 | 0.000 |
| Distance | 2.27 | 0.000 | Distance | 2.30 | 0.000 |
| Area | 1.00 | 0.036 |
1000 Area |
0.41 | 0.005 |
| Aspect Ratio | 0.458 | 0.030 |
10 AspectRatio |
1.37 | 0.005 |
| Stdev grey-level | 2.79 * 107 | 0.166 | 1000(stdevgreylevel)3 | 1.21 | 0.097 |
Table 4.
Results of logistic regression analysis of electroporation success as a function of experimental conditions and cell properties.
| Electroporatio n Success | Odds Ratio | P value | Variables (transformed) | Odds Ratio | P value |
|---|---|---|---|---|---|
| PulseDuration | 1.01 | 0.000 |
PulseDuration 50 |
1.87 | 0.00 |
| Distance | 0.289 | 0.000 | Distance | 0.29 | 0.00 |
| Area | 1.00 | 0.001 |
1000 Area |
0.32 | 0.001 |
After the logistic regression analysis was carried out, probabilities of cell survivability and electroporation success were computed using equation 4. The probabilities were computed at the following experimental condition values: pulse durations 50−300 ms and cell-capillary tip distance 2−10 μm. For all these experimental conditions, probabilities were computed for three cell sizes: small (5th percentile; diameter: 19 μm), median (50th percentile; diameter: 25 μm), and a large (95th percentile; diameter 39 μm). The aspect ratio for these cell sizes ranged from 1−3. The median value of standard deviation of grey-level was taken. In the 3×3 matrix of contour plots in Figure 2, the cell size changes from left to right, and the aspect ratio changes in the vertical direction. In these contour plots, the red grid marks the area where the cell survivability is between 0−50 percent. The black grid marks the area where the electroporation success is between 0−50 percent. The green grid is the good area where there is a greater than 50 percent chance of cell survivability and greater than 50 percent chance of electroporation success. The blue grid which can only be seen in contour plots B, C, F and I, is the area where there is greater than 90 percent chance of both cell survival and electroporation success.
Figure 2.

Contour plots of probabilities of cell survivability and electroporation success as a function of pulse duration and cell-capillary tip distance and cell properties. The cell size changes in the horizontal direction. Cell sizes used were: small (5th percentile; diameter 19 μm), median (50th percentile; diameter 25 μm), and large (95th percentile; diameter 39 μm). Aspect ratio changes in the vertical direction. Aspect ratio was changed from 1−3. Black grid marks the area of 0−50 % electroporation success. Red grid marks the area of 0−50 % cell survivability. Green grid marks the area of > 50 % electroporation success and > 50% cell survivability. Blue grid marks the area of > 90 % electroporation success and > 90 % cell survivability.
Simulation
Figure 3 is a false color image of the transmembrane potential for the three cell aizes. Figures 4-6 show the maximum TMP, the area permeabilized (A*), and the fraction of the cell's surface area permeabilized (F*) vs. distance. False color, maximum TMP vs. distance and F* vs. distance for cells varying in aspect ratio are qualitatively similar (figures S1-S3).
Figure 3.
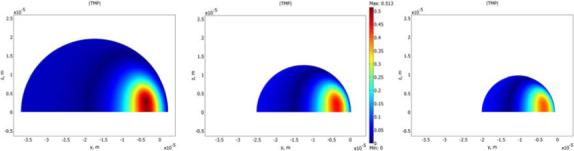
Simulated transmembrane potential (TMP) for three cell sizes (side view): small (5th percentile; diameter: 19 μm), median (50th percentile; diameter: 25 μm), and large (95th percentile; diameter: 39 μm).
Figure 4.

Maximum transmembrane potential (TMPmax) plotted as a function of distance for a small (5th percentile; diameter: 19 μm), median (50th percentile; diameter: 25 μm), and a large (95th percentile; diameter: 39 μm) cell.
Figure 6.

Fraction of the cell area above a critical transmembrane potential (F*) plotted as a function of distance for a small (5th percentile; diameter: 19 μm), median (50th percentile; diameter: 25 μm), and a large (95th percentile; diameter: 39 μm) cell.
DISCUSSION
Variability within a set of experimental conditions is a big issue in bulk and single-cell electroporation. An example of variability in bulk electroporation can be seen in Gabriel and Teissie et al.38 in which they showed significant variability in cell permeation and cell survivability under constant conditions. Significant variability in electroporation and cell viability under constant conditions is also observed in single-cell electroporation in a chip39, 40, and with an electrolyte-filled capillary18. In this paper, we have used statistical analysis to understand the variability in single-cell electroporation. We used several cell properties and experimental conditions and studied their effect on cell survivability and electroporation success. The cell properties were area, aspect ratio and standard deviation of the gray level. The experimental variables were pulse duration and cell-capillary tip distance. From the results of factor analysis (Table 2) and logistic regression (Tables 3 and 4), two cell properties were significant (p < 0.05); cell size (area) and cell shape (aspect ratio). The intensity factor had borderline significance. More experiments could perhaps resolve whether it is a significant factor or not. Pulse duration and cell-capillary tip distance were also highly significant (p <0.05). We have shown in a previous paper32 that pulse duration and cell-capillary tip distance affect cell survivability and electroporation success. Cell survivability decreases, but electroporation success increases as we go from shorter to longer pulses. Upon increasing the cell-capillary tip distance, the cell survivability increases, but electroporation success decreases. In this paper, our main aim was to understand how the cell properties and experimental conditions influence cell survivability and electroporation success. Analysis was also performed to study the interaction terms between the experimental conditions and the cell properties (for example, regression was run on the product of cell-capillary tip distance and cell diameter). The interaction terms did not prove to be significant, thus the prediction of ‘success’ or ‘viability’ is not improved by their inclusion.
Figure 2 shows how the variables (cell properties and experimental conditions) influence the outcome (cell survivability and electroporation success). It can be seen that the cell properties have a considerable effect on the outcome. The green (‘good’) area increases from left to right, i.e., as the cell size increases. Furthermore, on moving vertically, the green area increases as the cells become more spherical. From these contour plots we can conclude that a wide range of values of pulse duration and cell-capillary tip distance give good results for a large spherical cell (plot C). A small cell with a high aspect ratio (plot G) has the lowest probability of cell survival and electroporation success and there is a narrow range of pulse duration and cell-capillary tip distance over which modest success can be expected.
Two cell-based factors are important: size and shape. In bulk electroporation, variability in cell permeabilization has been explained to some extent in terms of cell size. Puc et al.41 in a bulk electroporation experiment with 448 cells measured the size distribution of a cell population with flow cytometry. They determined experimentally that cell permeabilization and survival as a function of pulse amplitude can be explained to a large extent by cell size distribution about the mean. In bulk electroporation it is well established from the Schwan equation (Equation 1) that the TMP for a spherical cell depends linearly on the cell size. A doubling of the cell's diameter leads to a doubling of the TMP. Higher TMP is related to greater permeabilization of the cell membrane.
In order to compare our results from single cell experiments with bulk electroporation and their dependence on cell size, we performed 3D simulations on hemispherical cells (Figure 3) using the finite element method with diameters corresponding to the 95th, 50th, and 5th percentiles of our cells (39, 25, 19 μm), and for tip-cell distances spanning the critical range (1 − 10 μm). The equation used to calculate the dependence (n) of TMP on cell radius at various cell-capillary tip distances is the slope of a log-log plot:
| (4) |
where TMP1 and TMP2 are the transmembrane potentials at radii r1 and r2 of two different sized cells at a given cell-capillary tip distance. The value of n is near 0.3. In bulk electroporation, n = 1. This can be inferred from Eq. 1. Thus, in single-cell electroporation the dependence of a cell's response on its size is significantly weaker than for bulk electroporation. The reason for this low dependence on cell size has to do with the relative dimensions of the tip opening diameter and the cell. When the tip opening is smaller than the cell, the field weakens considerably along the ‘z’ axis (the symmetry axis of the capillary). Thus, the magnitude of the total potential across the cell is dictated primarily by the potential at the cell surface proximal to the tip. A similar analysis comparing values of A* in the single-cell experiment to the bulk experiment gives a similar picture. The value of n (Eq. 4 with the ratio A*1/A*2 rather than TMP) is ∼ 1 from the single cell simulations, but it is 2 for the bulk experiment.
Although simulation results (Figure 3 and Figure 4) show that the cell size dependence of TMP in single-cell electroporation is not very strong, it still helps us in understanding the variability in single-cell electroporation. Figures 4-6 show that the maximum TMP, A* and F* for a small, median and a large cell are different at various cell-capillary tip distances. So, for example, if several cells were electroporated at identical conditions, a large cell would have for example, a smaller F* than a small cell. This would therefore lead to considerable variability in the results.
Our results from the logistic regression analysis (Table 3 and Table 4) and the contour plots (Figure 2) show that a large, spherical cell has the maximum probability of cell survival and electroporation success. Simulation results (Figure 4 and 6) show that a large cell has a larger TMP but a smaller F* than a small cell for distances < 7 μm. We infer that the higher TMP of a large cell is responsible for the higher probability of electroporation success. Furthermore, as large cell has a smaller F* than a small cell, this could mean that there is a smaller relative efflux of molecules from the cell, hence the probability of its cell survival would be higher. It is also possible that the differing values of TMP in the three sizes of cells lead to variations in pore size and resealing rates, which leads to differing mass transport rates and viability. However, the effect of TMP on pore size and kinetics is not very well known and is difficult to determine. It is also clear from the results that smaller cells require more investigation to determine under what conditions the probabilities of success and viability are higher.
The second important factor in our analysis is the shape factor. A recent report on bulk electroporation of cells under a microscope in the presence of a voltage-sensitive dye measured how TMP varied on irregularly shaped cells42. It has also been shown experimentally and numerically that for a spheroidal cell in suspension, the orientation of the cell with respect to a homogeneous field is an important parameter43. However there are no reports that study experimentally the effect of a change in shape of the cell from spherical to spheroidal on cell permeabilization. Gimsa and Wachner14 have given an analytical solution to calculate TMP induced by homogeneous fields on arbitrarily oriented cells of ellipsoidal shape. Using this mathematical framework for a homogeneous field, our calculations show that cells with the same projected area, and for the field perpendicular to the major axis, the TMP decreases as the aspect ratio of the cell increases. Also, our calculations show that at constant aspect ratio, the TMP increases as the size of the cell increases. In our single-cell electroporation experiments, where we have an inhomogeneous field as opposed to the homogeneous field in bulk electroporation, the change in aspect ratio of the cell shows a slightly different trend. From our 3D simulations (Figure S2), we observed that at a constant projected area, changing the aspect ratio of the cell from 1 to 3 changed TMPmax less than 10% at all distances. These simulation results show that in single cell electroporation, TMP is almost independent of aspect ratio. These simulation results agree well with our logistic regression results (Table 4). Logistic regression results (Table 4) and also the contour plots (Figure 2) show that electroporation success (which is related to TMP) is independent of aspect ratio of the cell as long as the projected area is kept constant. Our simulation results also show that when the aspect ratio of the cell is changed from 1 to 3 (projected area is kept constant), the fraction of cell (F*) electroporated increases (Figure S3). This could mean that the cell with a large aspect ratio would have a larger efflux of molecules from the cell, and hence its probability of survival would be lower than a cell with a small aspect ratio. Our results from the contour plots (Figure 2) show a similar trend. When the aspect ratio of the cell is increased, but the projected area is kept constant, cell survivability is decreased.
Therefore, cell size and shape are significant parameters in cell permeabilization and inducing variability in electroporation. It is likely that success of electroporation is related to maximum TMP, and survival is related to the fraction of the surface electroporated.
Supplementary Material
Figure 5.

Cell area above the critical transmembrane potential (A*) plotted as a function of distance for a small (5th percentile; diameter: 19 μm), median (50th percentile; diameter: 25 μm), and a large (95th percentile; diameter: 39 μm) cell.
ACKNOWLEDGMENTS
This work was financially supported by the National Institutes of Health (R01 GM066018), the Foundation for Strategic Research (SSF), Vetenskapsrådet (VR) and the Göran Gustafsson Foundation to whom we are grateful .
REFERENCES
- 1.Neumann E, Kakorin S, Toensing K. Bioelectrochemistry and Bioenergetics. 1999;48:3–16. doi: 10.1016/s0302-4598(99)00008-2. [DOI] [PubMed] [Google Scholar]
- 2.Faurie C, Golzio M, Phez E, Teissie J, Rols MP. Engineering in Life Sciences. 2005;5:179–186. [Google Scholar]
- 3.Bonnafous P, Vernhes MC, Teissie J, Gabriel B. Biochimica et Biophysica Acta, Biomembranes. 1999;1461:123–134. doi: 10.1016/s0005-2736(99)00154-6. [DOI] [PubMed] [Google Scholar]
- 4.Loste F, Eynard N, Teissie J. Bioelectrochemistry and Bioenergetics. 1998;47:119–127. [Google Scholar]
- 5.Gift EA, Weaver JC. Cytometry. 2000;39:243–249. [PubMed] [Google Scholar]
- 6.Neumann E. Bioelectrochemistry and Bioenergetics. 1992;28:247–267. [Google Scholar]
- 7.Neumann E, Schaefer-Ridder M, Wang Y, Hofschneider PH. EMBO J. 1982;1:841–845. doi: 10.1002/j.1460-2075.1982.tb01257.x. [DOI] [PMC free article] [PubMed] [Google Scholar]
- 8.Zimmermann U, Riemann F, Pilwat G. Biochimica et Biophysica Acta, Biomembranes. 1976;436:460–474. doi: 10.1016/0005-2736(76)90208-x. [DOI] [PubMed] [Google Scholar]
- 9.Xie TD, Sun L, Tsong TY. Biophys J. 1990;58:13–19. doi: 10.1016/S0006-3495(90)82349-3. [DOI] [PMC free article] [PubMed] [Google Scholar]
- 10.Mir LM, Orlowski S, Belehradek J, Jr., Paoletti C. European journal of cancer (Oxford, England : 1990) 1991;27:68–72. doi: 10.1016/0277-5379(91)90064-k. [DOI] [PubMed] [Google Scholar]
- 11.Grosse C, Schwan HP. Biophys J. 1992;63:1632–1642. doi: 10.1016/S0006-3495(92)81740-X. [DOI] [PMC free article] [PubMed] [Google Scholar]
- 12.Weaver JC, Chizmadzhev YA. Bioelectrochemistry and Bioenergetics. 1996;41:135–160. [Google Scholar]
- 13.Kotnik T, Miklavcic D. Biophys J. 2000;79:670–679. doi: 10.1016/S0006-3495(00)76325-9. [DOI] [PMC free article] [PubMed] [Google Scholar]
- 14.Gimsa J, Wachner D. Biophys J. 2001;81:1888–1896. doi: 10.1016/S0006-3495(01)75840-7. [DOI] [PMC free article] [PubMed] [Google Scholar]
- 15.Gimsa J, Wachner D. Biophys J. 1999;77:1316–1326. doi: 10.1016/S0006-3495(99)76981-X. [DOI] [PMC free article] [PubMed] [Google Scholar]
- 16.Rae JL, Levis RA. Pfluegers Arch. 2002;443:664–670. doi: 10.1007/s00424-001-0753-1. [DOI] [PubMed] [Google Scholar]
- 17.Haas K, Sin W-C, Javaherian A, Li Z, Cline HT. Neuron. 2001;29:583–591. doi: 10.1016/s0896-6273(01)00235-5. [DOI] [PubMed] [Google Scholar]
- 18.Nolkrantz K, Farre C, Brederlau A, Karlsson RID, Brennan C, Eriksson PS, Weber SG, Sandberg M, Orwar O. Anal Chem. 2001;73:4469–4477. doi: 10.1021/ac010403x. [DOI] [PubMed] [Google Scholar]
- 19.Kotnik T, Mir LM, Flisar K, Puc M, Miklavcic D. Bioelectrochemistry (Amsterdam, Netherlands) 2001;54:83–90. doi: 10.1016/s1567-5394(01)00114-1. [DOI] [PubMed] [Google Scholar]
- 20.Xia F, Jin W, Yin X, Fang Z. Journal of Chromatography, A. 2005;1063:227–233. doi: 10.1016/j.chroma.2004.12.022. [DOI] [PubMed] [Google Scholar]
- 21.Andersson H, van den Berg A. Curr Opin Biotechnol. 2003;15:44–49. doi: 10.1016/j.copbio.2004.01.004. [DOI] [PubMed] [Google Scholar]
- 22.Huang Y, Chen N, Borninski J, Rubinsky B. Proceedings - IEEE Annual International Conference on Micro Electro Mechanical Systems, 16th, Kyoto, Japan, Jan. 19-23, 2003; 2003. pp. 403–406. [Google Scholar]
- 23.Wheeler AR, Throndset WR, Whelan RJ, Leach AM, Zare RN, Liao YH, Farrell K, Manger ID, Daridon A. Anal Chem. 2003;75:3581–3586. doi: 10.1021/ac0340758. [DOI] [PubMed] [Google Scholar]
- 24.Stuart JN, Sweedler JV. Analytical and Bioanalytical Chemistry. 2003;375:28–29. doi: 10.1007/s00216-002-1609-z. [DOI] [PubMed] [Google Scholar]
- 25.Shaner LM, Brown PR. Journal of Liquid Chromatography & Related Technologies. 2000;23:975–997. [Google Scholar]
- 26.Krylov SN, Dovichi NJ. Electrophoresis. 2000;21:767–773. doi: 10.1002/(SICI)1522-2683(20000301)21:4<767::AID-ELPS767>3.0.CO;2-E. [DOI] [PubMed] [Google Scholar]
- 27.Sims CE, Meredith GD, Krasieva TB, Berns MW, Tromberg BJ, Allbritton NL. Anal Chem. 1998;70:4570–4577. doi: 10.1021/ac9802269. [DOI] [PubMed] [Google Scholar]
- 28.Lillard SJ, Yeung ES. Handbook of Capillary Electrophoresis. (2nd Edition) 1997:523–544. [Google Scholar]
- 29.Swanek FD, Ferris SS, Ewing AG. Handbook of Capillary Electrophoresis. (2nd Edition) 1997:495–521. [Google Scholar]
- 30.Fasching RJ, Bai SJ, Fabian T, Prinz FB. Microelectron Eng. 2006;83:1638–1641. [Google Scholar]
- 31.Gao N, Wang W, Zhang X, Jin W, Yin X, Fang Z. Anal Chem. 2006;78:3213–3220. doi: 10.1021/ac060278v. [DOI] [PubMed] [Google Scholar]
- 32.Agarwal AZ,I, Orwar O, Weber S,G. Anal Chem. 2007;79:161–167. doi: 10.1021/ac061270o. [DOI] [PMC free article] [PubMed] [Google Scholar]
- 33.Fabisiak JP, Sedlov A, Kagan VE. Antioxidants & Redox Signaling. 2002;4:855–865. doi: 10.1089/152308602760599016. [DOI] [PubMed] [Google Scholar]
- 34.Kagan VE, Kuzmenko AI, Tyurina YY, Shvedova AA, Matsura T, Yalowich JC. Cancer Res. 2001;61:7777–7784. [PubMed] [Google Scholar]
- 35.Silva GA, Czeisler C, Niece KL, Beniash E, Harrington DA, Kessler JA, Stupp SI. Science (Washington, DC, United States) 2004;303:1352–1355. doi: 10.1126/science.1093783. [DOI] [PubMed] [Google Scholar]
- 36.Zudans IA,A, Orwar O, Weber S,G. in press.
- 37.Weisberg S. Applied linear regression. (2nd ed.) 1985 [Google Scholar]
- 38.Gabriel B, Teissie J. Biochimica et Biophysica Acta, Molecular Cell Research. 1995;1266:171–178. doi: 10.1016/0167-4889(95)00021-j. [DOI] [PubMed] [Google Scholar]
- 39.Fox MB, Esveld DC, Valero A, Luttge R, Mastwijk HC, Bartels PV, van den Berg A, Boom RM. Analytical and Bioanalytical Chemistry. 2006;385:474–485. doi: 10.1007/s00216-006-0327-3. [DOI] [PubMed] [Google Scholar]
- 40.Khine M, Lau A, Ionescu-Zanetti C, Seo J, Lee LP. Lab on a Chip. 2005;5:38–43. doi: 10.1039/b408352k. [DOI] [PubMed] [Google Scholar]
- 41.Puc M, Kotnik T, Mir LM, Miklavcic D. Bioelectrochemistry. 2003;60:1–10. doi: 10.1016/s1567-5394(03)00021-5. [DOI] [PubMed] [Google Scholar]
- 42.Pucihar G, Kotnik T, Valic B, Miklavcic D. Annals of biomedical engineering. 2006;34:642–652. doi: 10.1007/s10439-005-9076-2. [DOI] [PubMed] [Google Scholar]
- 43.Valic B, Golzio M, Pavlin M, Schatz A, Faurie C, Gabriel B, Teissie J, Rols M-P, Miklavcic D. European biophysics journal : EBJ. 2003;32:519–528. doi: 10.1007/s00249-003-0296-9. [DOI] [PubMed] [Google Scholar]
Associated Data
This section collects any data citations, data availability statements, or supplementary materials included in this article.