

Abstract
A variation of affinity capillary electrophoresis, called the Replacement Ion (RI) method, has been developed to measure the binding of monovalent cations to random sequence, double-stranded (ds) DNA. In this method, the ionic strength is kept constant by gradually replacing a non-binding ion in the solution with a binding ion, and measuring the mobility of binding and non-binding analytes as a function of binding ion concentration. The method was validated by measuring the binding of Li+ ions to the adenosine nucleotides; the apparent dissociation constants obtained by the RI method are comparable to literature values obtained by other methods. The binding of Tris+, NH4+, Li+, Na+ and K+ to dsDNA was then investigated. The apparent dissociation constants observed for counterion binding to a random-sequence 26-base pair (bp) oligomer ranged from 71 mM for Tris+ to 173 mM for Na+ and K+. Hence, positively charged Tris buffer ions will compete with other monovalent cations in Tris-buffered solutions. The bound cations identified in this study may correspond to the strongly correlated, tightly bound ions recently postulated to exist as a class of ions near the surface of dsDNA (Tan, Z.-J., and Chen, S.-J. (2006) Biophys. J. 91, 518–536). Monovalent cation binding to random-sequence dsDNA would be expected to occur in addition to any site-specific binding of cations to A-tracts or other DNA sequence motifs. Single-stranded DNA oligomers do not bind the five tested cations under the conditions investigated here.
Keywords: Cation binding, Tris, Oligoucleotides, DNA, Capillary electrophoresis, Free solution electrophoretic mobility, Replacement Ion method
The binding of monovalent cations to DNA and other polynucleotides has been studied for many years. Early free boundary electrophoresis and conductivity studies (1–3) showed that the affinity of cations for calf thymus DNA decreases in the order Li+ > Na+ > K+ ≫ tetramethylammonium (TMA+). Competitive dialysis measurements (4) showed that Li+, Na+, K+, Cs+ and tetrabutylammonium (TBA+) ions bind to double-stranded (ds) DNA in a sequence-independent manner, while TMA+ and tetraethylammonium (TEA+) ions are preferentially bound by AT-rich DNAs. 23Na NMR measurements (5) showed that Na+, TEA+ and TBA+ bind to DNA with relative affinities of 20:5:1, respectively. Tris(hydroxymethyl)aminomethane (Tris+) ions also bind to DNA, with an affinity similar to that observed for Na+ (5).
More recently, Korolev et al. (6), studying the x-ray diffraction of oriented B-DNA fibers, found that the binding affinity decreases as Na+, K+ > Li+, opposite to the order observed in aqueous solution. Tikhominovaka and Chalikian (7), using ultrasonic velocimetry, found that Li+, Na+, K+, Rb+, Cs+, NH4+, and TMA+ ions retain their full hydration shells when bound to polydG·polydC and polydI·polydC, but are dehydrated when bound to polydA·polydT, suggesting site-specific binding in the latter case. Gearheart et al. (8), using ultrafast time-resolved Stokes-shift spectroscopy, found that Na+ interacts specifically with a random-sequence DNA oligomer, while TBA+ does not. Finally, Ouameur et al. (9), using FTIR and UV spectroscopy, found that thallium binds to calf thymus DNA with an apparent dissociation constant of 71 μM. They also found that cation binding increases with increasing cation concentration.
The site-specific binding of monovalent cations to DNA A-tracts, runs of 5 – 6contiguous adenine residues, has also been studied. X-ray diffraction (10–14), NMR (15–20), fluorescence resonance energy transfer (21) and electrophoresis (22, 23) measurements, along with molecular dynamics simulations (24–32), have suggested that monovalent counterions are preferentially localized in the narrow minor grooves of A-tracts, providing a rationale for the A-tract-induced curvature of the DNA helix axis (reviews: 33–36). Other theoretical (37, 38) and experimental (39–41) studies have also led to the conclusion that asymmetric counterion binding can induce modest but significant time-averaged effects on DNA conformation.
Monovalent cations bind to nucleotides as well as to DNA (42–44). Various studies have shown, for example, that 5′-adenosine triphosphate (ATP), 5′-adenosine diphosphate (ADP) and 5′-adenosine monophosphate (AMP) bind alkali metal ions with apparent dissociation constants ranging from 20 – 600 mM, depending on the particular cation-nucleotide pair (43, 44 and references therein). The binding affinities increase with the increasing number of phosphate residues in the nucleotide and decrease with the increasing radius of the bound cation, as expected for an electrostatic interaction between analyte and ligand (43, 45). Tris+ buffer ions also bind to the adenosine nucleotides, with apparent dissociation constants similar to those observed for Li+ (44). Since Tris+ and Li+ differ markedly in size, the binding of Tris+ probably occurs through a combination of hydrogen bonds and electrostatic interactions (44, 45). 5′-Adenosine carboxylic acid (A-COOH) and 3′-5′-cyclic AMP (cAMP) do not bind monovalent cations (44), suggesting that two or more closely spaced oxyanions are required for monovalent cation binding to mononucleotides.
The studies described in this report were designed to determine whether monovalent cations bind in a similar manner to random-sequence DNA and, if so, to measure the binding affinities. To evaluate cation binding, we have developed a variation of affinity capillary electrophoresis (see 46, 47 for a general discussion of the technique) called the Replacement Ion (RI) method. In this method, the ionic strength of the solution is kept constant by gradually replacing a non-binding ion in the solution with a test ion; the mobility of the analyte-ligand complex is measured as a function of test ion concentration. Since the ionic strength of the solution remains constant, the continual decrease of electrophoretic mobility with increasing ionic strength (48–51) does not affect the observed mobilities. Corrections for differences in the intrinsic conductivities of the binding and non-binding ions are made by including a non-binding analyte in each solution. Apparent dissociation constants are calculated by nonlinear curve fitting of the difference mobility profiles, assuming only that the on/off binding reaction is rapid and that the analyte and its ligand-bound complex have measurably different mobilities. The RI method was validated by measuring the binding of Li+ to ATP, ADP and AMP; the apparent dissociation constants are comparable to other values in the literature, obtained by different methods.
The RI method was then used to measure the binding of monovalent cations to two double-stranded (ds) DNAs, linear pUC19 (2686 bp) and a random-sequence 26 bp oligomer. Single-stranded (ss) DNA oligomers containing 5 and 26 nucleotides were also characterized. The test ions were Li+, Na+, K+, NH4+ and Tris+; several different quaternary ammonium ions were used as the non-binding ions. Na+ and K+ were chosen as test ions because of their biological relevance, Li+ and NH4+ were chosen because they bind to nucleotides (42, 43, 45), and Tris+ was chosen because Tris buffers are frequently used to maintain neutral pH in biochemical reactions carried out in vitro. The results indicate that the five tested monovalent cations bind weakly to dsDNA, with apparent dissociation constants in the range of ~100 mM. The cations do not bind significantly to ssDNA under the conditions used here.
MATERIALS AND METHODS
Samples
DNA oligomers containing 5 and 26 nucleotides (nt) were synthesized by Integrated DNA Technologies (Coralville, IA) and purified by HPLC or polyacrylamide gel electrophoresis (PAGE). The oligomers had the expected molecular weights when measured by Matrix-Associated Laser Desorption Ionization Time of Flight (MALDI-TOF) mass spectrometry, and migrated as single sharp peaks during capillary electrophoresis (CE). The 5-nt oligomer, called ss5 for brevity, had the sequence ACCGT; the sequence of one of the 26-nt oligomers (called ss26) was 5′-CGCAGTGTACGACTAGACTACAGACG. The double-stranded 26-bp oligomer (called ds26) was prepared by heating equimolar concentrations of ss26 and its complement in 10 mM Tris-Cl buffer, pH 8.0, to 94° C for 5 min and cooling slowly to room temperature. The duplex was monodisperse when analyzed by PAGE and CE. Plasmid pUC19 (2686 bp, Invitrogen, Carlsbad, CA) was linearized by digestion with the blunt-cutting enzyme SmaI; the linearized plasmid was monodisperse when analyzed by PAGE. Stock solutions containing ~30 ng/μL (~0.05 mM bp) of each DNA in 10 mM Tris-Cl buffer were stored at −20°C until needed. ATP, ADP, AMP, cAMP and A-COOH were reagent grade chemicals (Sigma Chemical Co., St. Louis, MO) used without further purification. The nucleotides were dissolved in deionized water (Nanopure II, Barnstead International, Dubuque, IA) at a concentration of 0.05 μg/μL and stored at −20°C.
Buffers
All CE experiments were carried out in solutions containing 200 mM diethylmalonic acid (DM), titrated to pH 7.3, the pKa of the second carboxyl group, with concentrated solutions of the hydroxide or amine of the cation of interest. Since the second carboxyl group of diethylmalonate is half ionized at pH 7.3, the concentration of the cation(s) in each solution was 300 mM; the ionic strength was 400 mM. This buffer concentration was chosen as a compromise between having enough cations in the solution to measure the affinity, and keeping the conductivity of the solution low enough to avoid Joule heating in the capillary. Since the anion is the buffering ion, the cation may be changed at will without altering the pH or buffering capacity of the solution.
The cations used in the conductivity experiments described below included the alkali metal ions Li+, Na+, K+ and Rb+; the partially substituted ammonium ions MeNH3+, Me3NH+, EtNH3+and Tris+; and the tetraalkylammonium ions Me4N+, Et4N+, Pr4N+ and Bu4N+, where Me, Et, Pr and Bu represent the methyl, ethyl, n-propyl and n-butyl groups, respectively. For brevity, the tetraalkylammonium ions are abbreviated TMA+, TEA+, TPA+ and TBA+, respectively, in the following text. Quantitative binding studies were carried out using Li+, Na+, K+, NH4+ and Tris+ as the test ions. Mixed cation-tetraalkylammonium solutions with the desired compositions were prepared by combining appropriate quantities of the individual stock solutions. Diethylmalonic acid, [CH3CH2)2C(COOH)2], was purchased from Sigma-Aldrich (St. Louis, MO). Other chemicals were obtained from Fisher Scientific (Fair Lawn, NJ), Research Products International (Mt. Prospect, IL), Eastman Kodak (Rochester ,NY) or Fluka (Steinheim, Germany). The pH of each buffer solution was measured with a Radiometer PHM82 Standard Meter (Copenhagen).
Capillary electrophoresis
Capillary zone electrophoresis measurements were carried out with a Beckman Coulter P/ACE MDQ Capillary Electrophoresis System (Fullerton, CA), run in the reverse polarity mode (anode on the detector side) with UV detection at 254 nm, using methods described previously (52). Migration times and peak areas were analyzed using the 32 Karat™ software. Bio-Rad (Hercules CA) LPA capillaries, coated internally with linear polyacrylamide, were used to minimize the electroosmotic flow (EOF) of the solvent. Previous studies have shown that the capillary coating does not affect the observed mobilities (52). The capillaries were 40.0 cm in length (29.8 cm to the detector) and had external diameters of 375 μm and internal diameters of 75 μm. The capillary was conditioned at the beginning of each day by rinsing with running buffer for 5 min at high pressure (25 p.s.i., 0.17 Mpa). The capillary was rinsed with deionized water at 25 p.s.i. for 5 – 10 min at the end of each day and stored in deionized water. The capillary cartridge was cooled with circulating liquid; the temperature of all experiments was 20.0 ± 0.1° C. The samples were hydrodynamically injected into the capillary by applying low pressure (0.5 p.s.i., 0.0035 MPa) for 3 s. The injection volume was 22 nL; the length of the sample plug was 0.51 cm, 1.3% of the total capillary length. The electric field strength was typically 150 – 200 V/cm (6 – 8 kV applied voltage); the current was ≤60 μA. Control experiments showed that the observed mobilities were independent of the applied electric field, the length of the sample plug and the DNA concentration.
The residual EOF of the capillary was measured frequently by the fast method of Williams and Vigh (53), using 40 mM acrylamide or benzyl alcohol as the analyte. The EOF of a new capillary was typically ~1 ×10⁻⁵ cm2/Vs. If the residual EOF mobility is negligible in comparison with the mobilities of the analytes, as in the present case, the apparent mobilities can be calculated from the migration times, using Eq. (1):
| (1) |
where μ is the observed mobility, Ld is the distance to the detector (in cm), E is the electric field strength (in V/cm), and t is the time required for the sample to migrate to the detector (in seconds). The migration times were very reproducible: the average standard deviation of the mobility measured for a given sample on a given day was ±0.2%. The average standard day-to-day variation of the mobility, using the same capillary, was typically ±1.6%.
Each mobility profile was measured in a single capillary. However, it was occasionally necessary to change capillaries, due to breakage or the deterioration of the capillary coating. To compare the results obtained in different capillaries, it was necessary to correct for differences in the residual EOF of different capillaries. Since the EOF mobility and the analyte mobility are additive (52, 54), the mobilities observed in the second and subsequent capillaries were corrected to the mobility that would have been observed in the original capillary, using Eq. (2):
| (2) |
where μss26,new cap is the observed mobility of ss26 (for example) in the new capillary, μss26,orig cap is the observed mobility of ss26 in the original capillary and Δμ is the difference between the mobilities observed in the two capillaries. The correction was typically less than 2%, but ranged up to 20% for one of the capillaries. The corrected mobilities and the mobility profiles were always independent of the capillary in which the measurements were carried out.
RESULTS
Identification of binding and non-binding ions
To have an objective measure of which monovalent ions bind to DNA and which do not, the free solution mobilities of single- and double-stranded DNAs were measured in DM solutions of constant ionic strength containing different monovalent cations. Typical results are illustrated in Figure 1. The open circles correspond to the mobilities observed in solutions containing TMA+, TEA+, TPA+ or TBA+ as the cation, while the closed circles correspond to the mobilities observed when the counterion was an alkali metal ion (Li+, Na+, K+ or Rb+) or a partially substituted ammonium ion (MeNH3+, Me3NH+, EtNH3+ or Tris+). In all cases, the mobility increased gradually as the limiting ionic conductivity of the cation at infinite dilution (hereafter called intrinsic conductivity for brevity) increased, as expected because the observed mobility of an analyte depends on the intrinsic conductivity of all the ions in the solution (55, 56). However, contrary to theory, the mobilities observed for dsDNA in solutions containing tetraalkylammonium ions are higher than observed in solutions containing other cations with the same intrinsic conductivities. Since the mobilities observed for ss26 and ss5 are essentially independent of the type of cation in the solution, the mobility differences observed for dsDNA cannot be attributed to the effect of different cations on the hydrogen-bonded structure of water. Cation effects on water structure would be expected to affect the mobilities of single-and double-stranded DNAs in a similar manner (57). Hence, the dependence of the mobility of dsDNA on the type of monovalent cation in the solution suggests that dsDNA binds all (tested) monovalent cations except the quaternary ammonium ions, decreasing its effective net charge and reducing the observed mobility.
Figure 1.
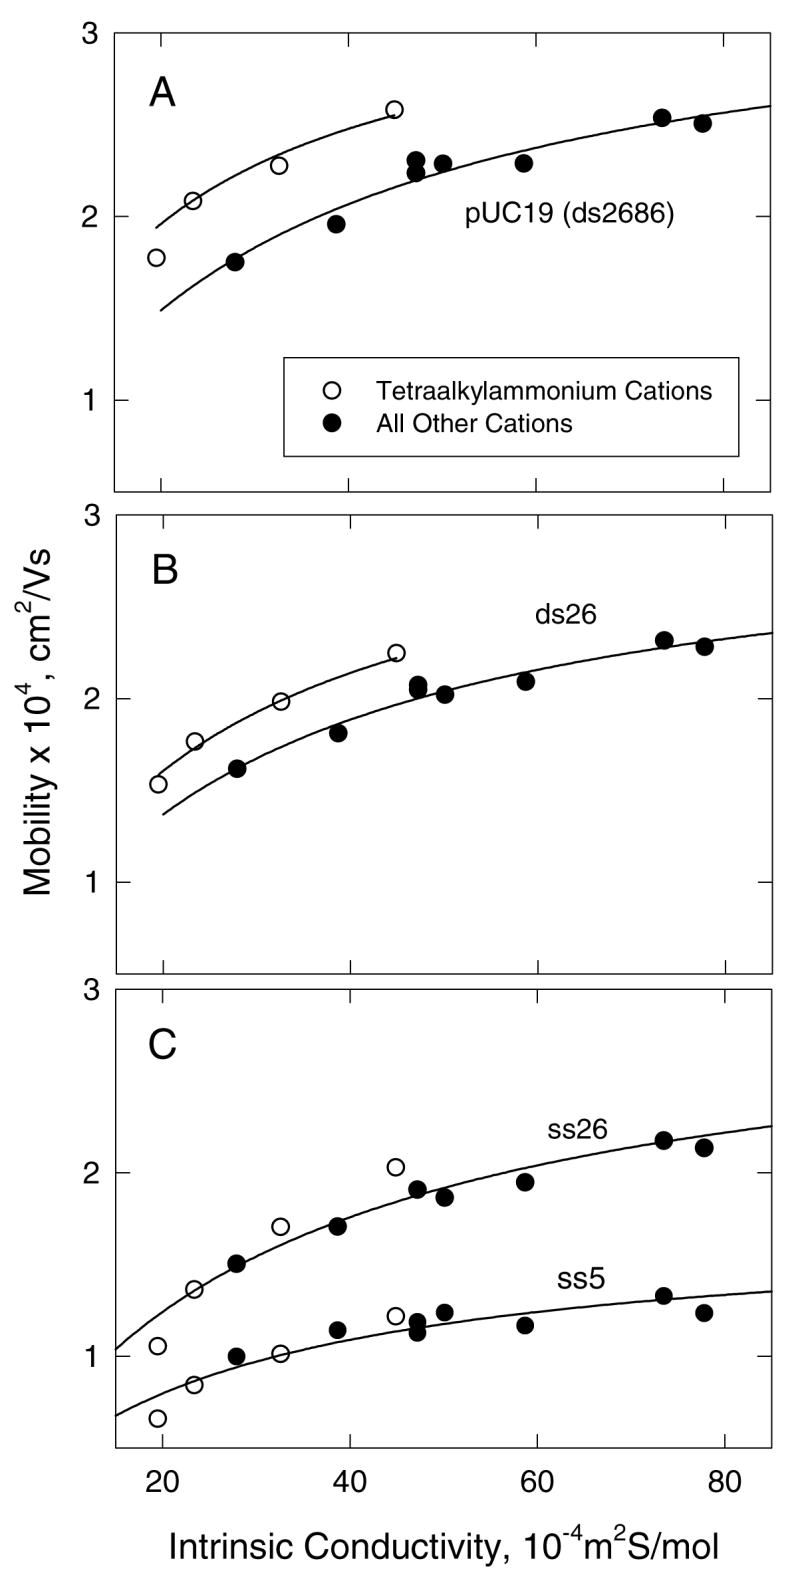
Dependence of the mobility of ss- and dsDNA on the intrinsic conductivity of the cation in the solution. (A), linear pUC19 (ds2686); (B), ds26; and (C), ss26 and ss5. All solutions contained 300 mM cation and a constant concentration of diethylmalonate as the anion. The open symbols correspond to solutions containing tetraalkylammonium cations: TMA+, TEA+, TPA+ or TBA+; the closed symbols refer to solutions containing Li+, Na+, K+, Rb+, MeNH3+, Me3NH+, EtNH3+ or Tris+. The drawn lines are rectangular hyperbolas that extrapolate to the origin, and are meant to guide the eye.
Very similar results have been observed with the adenosine nucleotides (44). The mobilities observed for ATP, ADP and AMP in solutions containing tetraalkylammonium ions are higher than observed in solutions containing other cations with the same intrinsic conductivity, while the mobilities of cAMP and A-COOH are independent of the nature of the cation (44). Hence, ATP, ADP and AMP bind all (tested) monovalent cations except the quaternary ammonium ions, in agreement with other results in the literature (42, 43, 45). On the basis of Figure 1, and for brevity in the following discussion, the tetraalkylammonium ions will be described as non-binding ions, while the other cations investigated in this study, Li+, Na+, K+, NH4+ and Tris+, will be described as binding ions, even though they do not bind to ssDNA, cAMP or A-COOH. The dependence of the observed mobility on the intrinsic conductivity of the cation in the solution will be called the conductivity effect, for brevity.
Validation of the RI method using the adenosine nucleotides as analytes
To validate the RI method, the mobilities of ATP, ADP and AMP were measured in solutions containing Li+ as the binding ion, TPA+ or TBA+ as the non-binding ion and cAMP as the non-binding analyte. The mobility profiles observed with TBA+ as the non-binding ion are illustrated in Figure 2; similar results were obtained with TPA+ (data not shown). The mobility of cAMP increases linearly with increasing [Li+] due to the conductivity effect, as expected since cAMP does not bind monovalent cations (44) and the intrinsic conductivity of Li+ is greater than that of TBA+ (58). By contrast, the mobilities of ATP and ADP decrease significantly with increasing [Li+] at the beginning of the titration, due to counterion binding. However, at [Li+] above ~100 mM, the mobility goes through a shallow minimum and then begins to increase slowly as the conductivity effect becomes predominant. The mobility of AMP exhibits a very small decrease at low [Li+] and then increases nearly linearly with increasing [Li+] because of the conductivity effect; however, the slope of the line is smaller than observed for cAMP.
Figure 2.
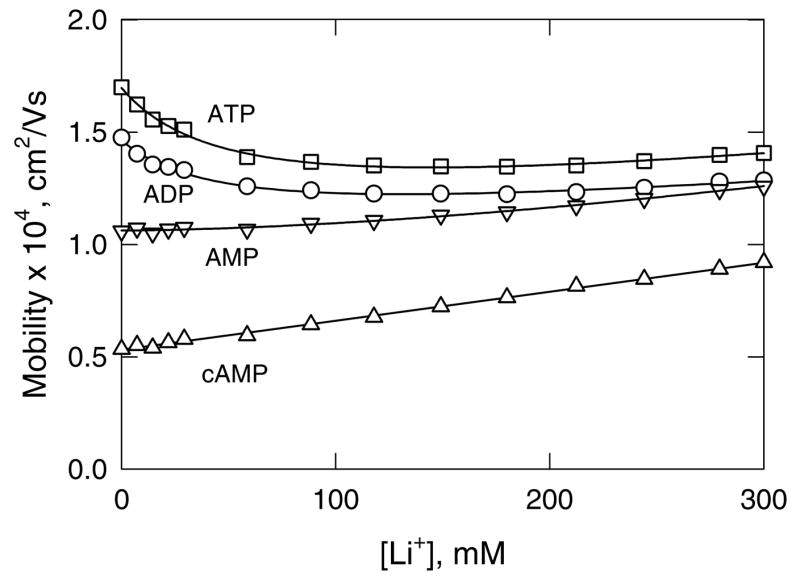
Mobility profiles observed for: (□), ATP; (○), ADP; (▽), AMP; and (△), cAMP, using Li+ as the binding ion and TBA+ as the non-binding ion. The straight line through the cAMP data was drawn by linear regression (R2 = 0.99); the curved lines are drawn to guide the eye.
The results in Figure 2 indicate that the mobility profiles observed for ATP, ADP and AMP are the sum of two effects: a curvilinear decrease in mobility due to counterion binding and a linear increase (or decrease) in mobility due to the conductivity effect. To take both effects into account, the mobility profiles can be analyzed with Eq. (3):
| (3) |
where μM is the mobility observed for the analyte-ligand complex at any given concentration [M+] of the test ion, μo is the mobility observed when [M+] = 0 (i.e., when the solution contains only a tetraalkylammonium ion as the cation), Δμspan is the span of the titration, (i.e., the difference in mobility that would be observed upon saturation of the binding site, if there were no conductivity effect), KD is the apparent dissociation constant characterizing the binding of the test ion to the analyte, and c is the slope of the line describing the conductivity effect. Binding, as used here, refers to the formation of a saturable complex between analyte and ligand, assuming the binding to be non-cooperative.
Eq. (3) contains three unknowns, Δμ, KD and c, which can be determined by non-linear curve fitting of the mobility profiles. However, the mobility profiles obtained from a typical experiment usually cover too small a range of ligand concentrations to determine all three parameters accurately (44). The parameter c in Eq. (3) can be eliminated if an analyte that does not bind the ligand is included in each solution. If the mobilities of the binding and non-binding analytes are different, subtracting the mobilities of the two analytes at each [M+] will give difference mobility profiles, which can be analyzed using Eq. (4):
| (4) |
Here, ΔμM is the difference in mobility between binding and non-binding analytes at a ligand concentration of [M+], Δμo is the value of ΔμM when [M+] = 0, and the other terms have been defined above. If the analyte has more than one independent binding site, additional terms corresponding to the second term on the right hand side of Eq. (4) would be needed. However, attempts to fit the difference mobility profiles with more than one binding constant gave two nearly identical KD values, indicating that multiple binding sites, if present, cannot be distinguished by the RI method. For this reason, the calculated KD values are called apparent dissociation constants. All calculations were carried out using the SigmaPlot suite of programs.
The apparent KD values calculated for the binding of Li+ to ATP, ADP and AMP, using TBA+ as the non-binding ion and cAMP as the non-binding analyte, are given in Table 1. Similar results were obtained using TPA+ as the non-binding ion (data not shown). The apparent KD values, which range from 82 – 373 mM for ATP, ADP and AMP, respectively, are similar to the values obtained by pH titration (43, 59, 60), titration calorimetry (61), NMR (62) and capillary electrophoresis using the Variable Ionic Strength (VIS) method (44). Hence, the RI method can accurately measure weak analyte-ligand binding constants.
Table 1.
Apparent KD values calculated for ATP, ADP and AMP by the RI method and comparison with literature values
| Analyte | Apparent KD, mM Measured | Apparent KD, mM Literature | References |
|---|---|---|---|
| ATP | 82 ± 6 | 13 – 75 | 43, 44, 59–61 |
| ADP | 115 ± 14 | 71 – 109 | 43, 44 |
| AMP | 373 ± 84 | 60 – 250 | 43, 44, 62 |
Calculated from Eq. (4), using Li+ as the binding ion, TBA+ as the non-binding ion and cAMP as the non-binding analyte. The uncertainties given for the KD values are the standard errors of the residuals obtained from the SigmaPlot curve fitting algorithm.
The VIS and RI methods of determining binding constants are fundamentally different, even though both are based on capillary electrophoresis measurements. In the VIS method, the test ion is one of the components of the background electrolyte and differences in mobility between binding and non-binding analytes, or between binding and non-binding ligands, are measured as a function of ionic strength (44). The VIS method relies on the assumption that the binding constants are independent of ionic strength, whereas the RI method determines the affinity at a specific ionic strength. The two methods give similar results, as shown in Table 1.
Mobility profiles observed for single- and double-stranded DNA
The mobility profiles observed for linear pUC19 (ds2686), ds26 and ss26, using Tris+ as the binding ion and TPA+ as the non-binding ion, are illustrated in Figure 3. The mobilities of pUC19 and ds26 decrease significantly with increasing [Tris+], especially at low [Tris+], due to counterion binding. The mobility of ss26 decreases approximately linearly with increasing [Tris+] because the intrinsic conductivity of Tris+ is somewhat less than that of TPA+ (58, 63).
Figure 3.
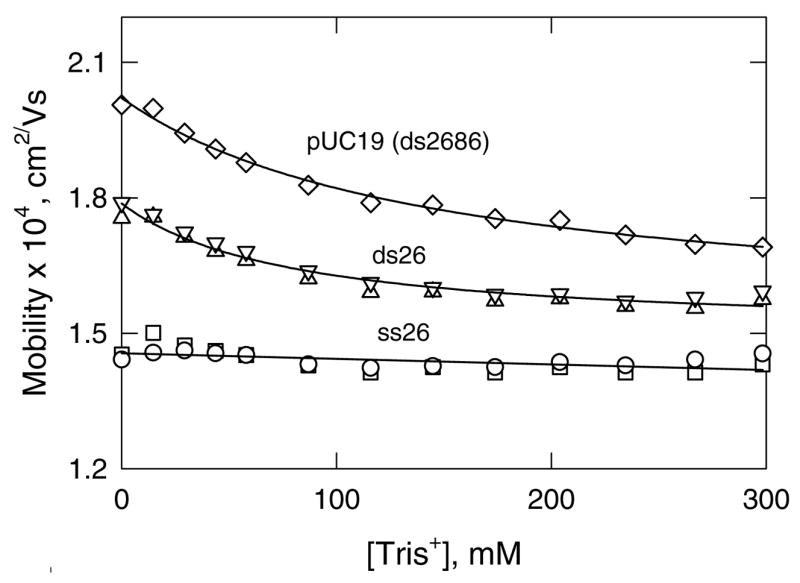
Mobility profiles observed for: (◇) linear pUC19 (ds2686); (△, ▽), ds26; and (○, □), ss26, using Tris+ as the binding ion and TPA+ as the non-binding ion. The two symbols for ds26 and ss26 represent independent runs on different days and illustrate the reproducibility of the method. The lines are drawn to guide the eye.
For other replacement ion pairs, the conductivity effect is more pronounced, as shown in Figure 4. With [Li+] as the test ion, the mobility of ss26 increases or decreases substantially with increasing [Li+], depending on whether the non-binding ion is TMA+, TEA+, TPA+ or TBA+ (Figure 4A). The slopes of the lines depend on whether the intrinsic conductivity of the particular tetraalkylammonium ion is greater or less than that of Li+. Similarly, if the non-binding ion is TPA+, the mobility of ss26 increases or decreases approximately linearly with increasing concentrations of K+, Na+, NH4+, Li+ and Tris+, as shown in Figure 4B. The correlation between the slopes of the lines in Figure 4 and the differences in the intrinsic conductivities of the binding and non-binding cations in each replacement ion pair is shown explicitly in Figure 5. The relatively good correlation between the two parameters indicates that the major factor contributing to the dependence of the mobility of a non-binding analyte on ligand concentration is the difference in the intrinsic conductivities of the replacement ion pair. However, the scatter of the data points suggests that secondary factors, such as the viscosity of the solution or the effect of the cation on the hydrogen-bonded structure of water (57), may also influence the observed mobilities.
Figure 4.
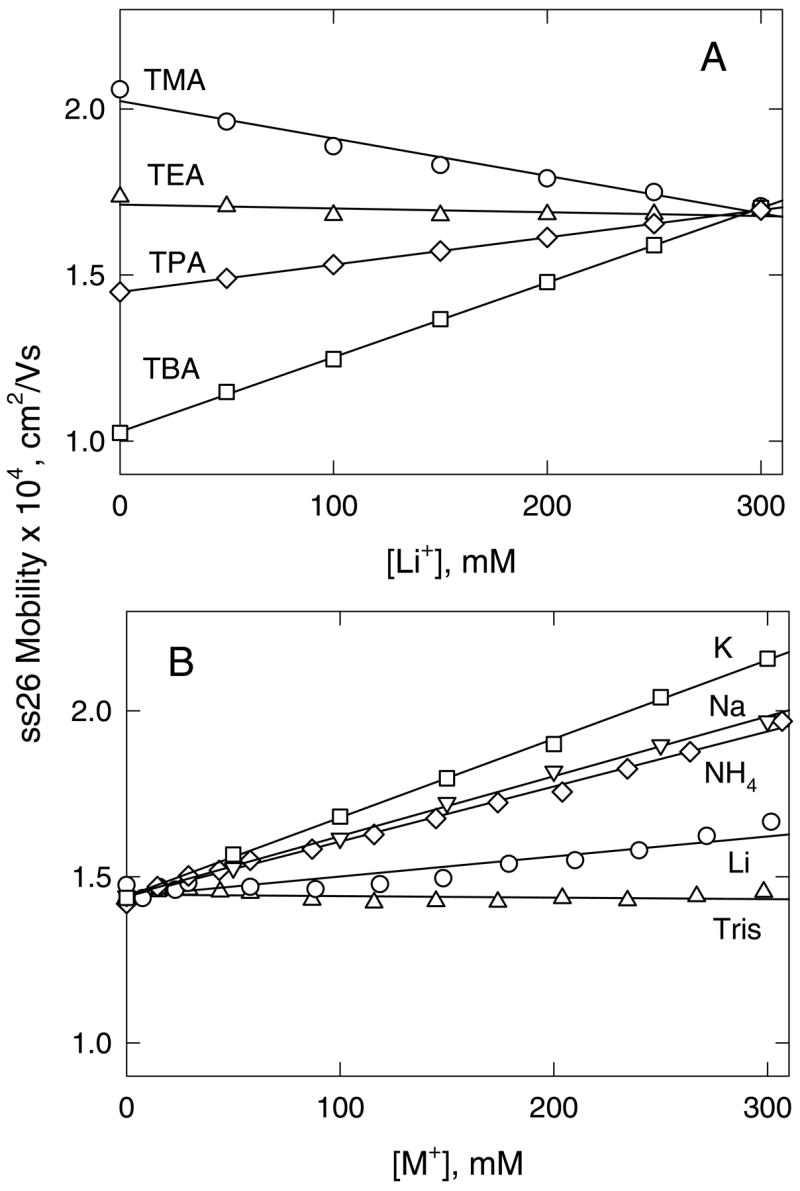
Dependence of the mobility of ss26, plotted as a function of binding ion concentration in solutions containing different replacement ion pairs. (A), Li+ replacing the tetraalkylammonium ions: (○), TMA+; (△), TEA+; (◇), TPA+; and (□), TBA+. (B), TPA+ replaced by: (o), Li+; (▽), Na+; (□), K+; (◇), NH4+; and (△), Tris+. The total cation concentration was always 300 mM. The straight lines were drawn by linear regression, with correlation coefficients, R2 = 0.99.
Figure 5.

Analysis of the conductivity effect. The filled circles correspond to the slopes of the lines observed for ss26 in Figure 4, plotted as a function of the difference in the intrinsic conductivities of the replacement ion pair. The curved line is meant to guide the eye.
Quantitative analysis of monovalent counterion binding by dsDNA
Because the mobility profiles obtained for ds26 and linear pUC19 were very similar (Figure 3), quantitative analysis of monovalent cation binding to dsDNA was carried out with ds26, using ss26 as the non-binding analyte. The difference mobility profiles obtained with Li+ as the binding ion and TMA+, TEA+, TPA+ or TBA+ as the non-binding ion are shown in Figure 6A. With the first three quaternary ammonium ions, the difference mobility profiles are hyperbolic, as expected for non-cooperative binding between analyte and ligand, allowing the apparent KD values to be calculated from Eq. (4). However, with TBA+ as the non-binding ion, the difference mobility profile exhibits a sigmoidal dependence on [Li+]. Therefore, this difference mobility profile was analyzed using a four parameter Hill equation (64):
| (5) |
where n is the cooperativity parameter and the other terms have been defined above. The apparent KD values and the cooperativity parameters, n, obtained for Li+ binding to ds26, using the four quaternary ammonium ions as the non-binding ions, are given in the top section of Table 2. The average apparent KD value is 114 ± 18 mM, indicating that the binding affinity is essentially independent of the identity of the non-binding ion. Similar results have been observed for the adenosine nucleotides (44).
Figure 6.

Difference mobility profiles calculated for ds26. (A), With Li+ as the binding ion and: (o), TMA+; (△), TEA+; (◇), TPA+; and (□), TBA+ as the non-binding ions. (B), With TPA+ as the non-binding ion and: (△), Tris+; (o), Li+; (▽), Na+; (◇), NH4+; and (□), K+ as the binding ions. The curved lines in (A) and (B) were calculated from Eq. (4) or (5), as described in the text, using the apparent KD and cooperativity parameters given in Table 2.
Table 2.
Apparent dissociation constants obtained for ds26 using various replacement ion pairs
| Binding Ion | Non-Binding Ion | Apparent KD, mM1 | Cooperativity, n | R2 |
|---|---|---|---|---|
| Li | TMA | 100 ± 19 | --- | 0.993 |
| Li | TEA | 108 ± 24 | --- | 0.969 |
| Li | TPA | 107 ± 16 | --- | 0.993 |
| Li | TBA | 140 ± 31 | 2.0 ± 0.2 | 0.998 |
| Tris | TPA | 71 ± 6 | --- | 0.997 |
| NH4 | TPA | 120 ± 13 | --- | 0.996 |
| Li | TPA | 107 ± 16 | --- | 0.993 |
| Na | TPA | 173 ± 31 | 1.6 ± 0.2 | 0.998 |
| K | TPA | 173 ± 31 | 1.6 ± 0.2 | 0.998 |
The difference mobility profiles obtained for ds26 using TPA+ as the non-binding ion and Tris+, NH4+, Li+, Na+ and K+ as the binding ions are illustrated in Figure 6B. The difference mobility profiles observed for the first three cations are hyperbolic and can be analyzed using Eq. (4). However, the difference mobility profiles observed for Na+ and K+ are sigmoidal, and must be analyzed with Eq. (5). The apparent dissociation constants and cooperativity parameters obtained for the binding of Tris+, NH4+, Li+, Na+ and K+ to ds26 are given in the bottom section of Table 2. The apparent KD values range from 71 to 173 mM, indicating that all five cations bind weakly to ds26 and, most likely, to other dsDNAs. The ratios of the apparent KD values obtained for the binding of the alkali metal ions Li+, Na+ and K+ to ds26 are 0.62:l.00:1.00, respectively, similar to the ratios of 0.67:1.00:1.25 observed by Ross and Scruggs for the same three cations binding to calf thymus DNA (1). The apparent KD values measured for the binding of Na+ and K+ to ds26, 173 mM, are significantly larger than the value of 71 μM determined by Ouameur et al. (9) for the binding of thallium to calf thymus DNA. However, these two results should not be compared quantitatively, because the binding ions are different and the experimental conditions were also very different. The apparent KD values reported for ds26 in Table 2 are similar to the values observed for binding of the same cations to ATP and ADP (Table 1), as might be expected for ligands binding to similar analytes.
DISCUSSION
The Replacement Ion (RI) method described in this report is a method of measuring weak binding affinities by capillary electrophoresis, using very small quantities of analyte. The experiments are carried out at constant ionic strength by gradually replacing a non-binding ion in the solution with the test ion. To compensate for the dependence of the observed mobility on the intrinsic conductivities of different ions, the mobilities of binding and non-binding analytes are measured in the same solution at each test ion concentration. The difference mobility profiles are then analyzed by nonlinear curve fitting, using Eq. (4) or (5) to calculate the apparent dissociation constants, depending on whether the binding isotherms are hyperbolic or sigmoidal. Binding and non-binding ions with similar intrinsic conductivities can be used to minimize the conductivity effect. However, as shown in Table 2, the calculated apparent KD values are essentially independent of the particular non-binding ion used, indicating that the difference mobility profiles adequately correct for the conductivity effect.
The results in Table 2 also indicate that monovalent cations bind weakly to dsDNA, with apparent dissociation constants ranging from 71 – 173 mM. These results, together with other studies in the literature (1–9), suggest that all, or nearly all, monovalent cations bind to random-sequence dsDNA in aqueous solutions. The apparent KD observed for the binding of Tris+ to ds26 is somewhat smaller than observed for the binding of other cations, suggesting that Tris-DNA complexes are stabilized by the formation of hydrogen bonds with the DNA bases (45), as well as by electrostatic interactions with the phosphate residues. Because of the similarity of the binding constants, positively charged Tris+ buffer ions will compete with other monovalent cations for binding to dsDNA in Tris-buffered solutions.
Counterion binding, as measured in the present study, implies the formation of saturable cation-dsDNA complexes, which in turn implies the site-binding of cations to random sequence dsDNA. The site-binding of monovalent counterions to random-sequence dsDNA has previously been suggested from circular dichroism (65) and thermal melting (66) studies. Site-bound cations are different from the condensed counterions that surround dsDNA because of its high linear charge density (67). Condensed counterions are territorially bound to the whole DNA molecule; the concentration of the condensed cations is nearly independent of the bulk cation concentration (67, 68). By contrast, the concentration of the bound cations described here increases with increasing cation concentration, even though the total ionic strength of the solution is held constant.
Recently, a new theory was proposed to describe the interaction between DNA and its counterions, called the tightly bound ion (TBI) theory (69–71). This theory separates the condensed counterion layer described by Manning (67) into two regions, one containing tightly bound ions and the other containing diffusively bound ions. The strongly correlated, tightly bound ions are trapped in discrete but unspecified locations (called tightly bound cells) on the DNA surface by the strong electrostatic field of the phosphate residues. Importantly, the number of tightly bound ions increases with increasing cation concentration and approaches saturation at high cation concentrations. The diffusively bound ions are weakly correlated and form an outer layer around the DNA and the tightly bound ions; the diffusively bound ions in this outer layer can be described by Poisson-Boltzmann theory. The rest of the cations are found in the bulk phase and contribute to the ionic strength of the solution (69–71).
The tightly bound ions in TBI theory appear to correspond to the bound cations in the present study, since the concentration of the tightly bound ions increases with increasing cation concentration and approaches saturation at high cation concentrations, as observed here. The nature of the binding site(s) is not known, although circular dichroism studies have suggested that alkali metal ions bind to guanine residues in the minor groove, causing an increase in the average winding angle of the helix backbone (65). Monovalent cation binding appears to approach saturation when the DNA is still negatively charged, suggesting that a minimal charge density is needed for binding to dsDNA. The importance of charge density is underscored by the absence of monovalent cation binding to ssDNA, cAMP and A-COOH under conditions where significant binding is observed with dsDNA, ATP, ADP and AMP. Further studies will be needed to determine how monovalent cation binding depends on DNA charge density.
The present study does not address the binding of monovalent cations to specific DNA sequences such as A-tracts, because ds26 and linear pUC19 have essentially random sequences. One would expect the site-binding of monovalent cations in the A-tract minor groove, for example, to occur in addition to the non-sequence-specific binding described here. Site binding of monovalent cations to DNA A-tracts will be described in a future communication (manuscript in preparation).
Footnotes
This work was supported in part by the National Institute of General Medical Sciences (GM061009).
Abbreviations: A-COOH, 5′-adenosine carboxylic acid; ADP, 5′-adenosine diphosphate; AMP, 5′-adenosine monophosphate; cAMP, 3′,5′-cyclic AMP; ATP, 5′-adenosine triphosphate; ds26, 26-base pair double-stranded DNA; CE, capillary electrophoresis; DM, diethylmalonate; PAGE, polyacrylamide gel electrophoresis; RI, replacement ion; ss5, 5-nucleotide single-stranded DNA; ss26, 26-nucleotide single-stranded DNA; TMA, tetramethylammonium; TEA, tetraethylammonium; TPA, tetrapropylammonium; TBA, tetrabutylammonium.
References
- 1.Ross PD, Scruggs RL. Electrophoresis of DNA. II. Specific interactions of univalent and divalent cations with DNA. Biopolymers. 1964;2:79–89. [Google Scholar]
- 2.Ross PD, Scruggs RL. Electrophoresis of DNA. III. The effect of several univalent electrolytes on the mobility of DNA. Biopolymers. 1964;2:231–236. [Google Scholar]
- 3.Strauss UP, Helfgott D, Pink H. Interactions of polyelectrolytes with simple electrolytes. II. Donnan equilibria obtained with DNA in solutions of 1-1 electrolytes. J Phys Chem. 1967;71:2550–2556. doi: 10.1021/j100867a024. [DOI] [PubMed] [Google Scholar]
- 4.Shapiro JT, Stannard BS, Felsenfeld G. The binding of small cations to deoxyribonucleic acid. Nucleotide specificity. Biochemistry. 1969;8:3233–3241. doi: 10.1021/bi00836a015. [DOI] [PubMed] [Google Scholar]
- 5.Anderson CF, Record MT, Jr, Hart PA. Sodium-23 NMR studies of cation-DNA interactions. Biophys Chem. 1978;7:301–316. doi: 10.1016/0301-4622(78)85007-8. [DOI] [PubMed] [Google Scholar]
- 6.Korolev N, Lyubartsev AP, Rupprecht A, Nordenskiöld L. Experimental and Monte Carlo simulation studies on the competitive binding of Li+, Na+ and K+ ions to DNA in oriented DNA fibers. J Phys Chem B. 1999;103:9008–9019. doi: 10.1016/s0006-3495(99)77107-9. [DOI] [PMC free article] [PubMed] [Google Scholar]
- 7.Tikhomirova A, Chalikian TV. Probing hydration of monovalent cations condensed around polymeric nucleic acids. J Mol Biol. 2004;341:551–563. doi: 10.1016/j.jmb.2004.06.015. [DOI] [PubMed] [Google Scholar]
- 8.Gearheart LA, Somoza MM, Rivers WE, Murphy CJ, Coleman RS, Berg MA. Sodium-ion binding to DNA: detection by ultrafast time-resolved Stokes-shift spectroscopy. J Am Chem Soc. 2003;125:11812–11813. doi: 10.1021/ja0363617. [DOI] [PubMed] [Google Scholar]
- 9.Ouameur AA, Nafisi Sh, Mohajerani N, Tajmir-Riahi HA. Thallium-DNA complexes in aqueous solution. Major or minor groove binding. J Biomol Struct Dyn. 2003;20:561–565. doi: 10.1080/07391102.2003.10506872. [DOI] [PubMed] [Google Scholar]
- 10.Shui X, Sines CC, McFail-Isom L, VanDerveer D, Williams LD. Structure of the potassium form of CGCGAATTCGCG: DNA deformation by electrostatic collapse around inorganic cations. Biochemistry. 1998;37:16877–16887. doi: 10.1021/bi982063o. [DOI] [PubMed] [Google Scholar]
- 11.Tereshko V, Minasov G, Egli M. A “Hydrat-ion” spine in a B-DNA minor groove. J Am Chem Soc. 1999;121:3590–3595. [Google Scholar]
- 12.Woods KK, McFail-Isom L, Sines CC, Howerton SB, Stephens RK, Williams LD. Monovalent cations sequester within the A-tract minor groove of [d(CGCGAATTCGCG)] J Am Chem Soc. 2000;122:1546–1547. [Google Scholar]
- 13.Sines CC, McFail-Isom L, Howerton SB, VanDerveer D, Williams LD. Cations mediate B-DNA conformational heterogeneity. J Am Chem Soc. 2001;122:11048–11056. [Google Scholar]
- 14.Howerton SB, Sines CC, VanDerver D, Williams LD. Locating monovalent cations in the grooves of B-DNA. Biochemistry. 2001;40:10023–10031. doi: 10.1021/bi010391+. [DOI] [PubMed] [Google Scholar]
- 15.Hud NV, Sklenáø V, Feigon J. Localization of ammonium ions in the minor groove of DNA duplexes in solution and the origin of DNA A-tract bending. J Mol Biol. 1999;186:651–660. doi: 10.1006/jmbi.1998.2513. [DOI] [PubMed] [Google Scholar]
- 16.MacDonald D, Herbert K, Zhang X, Polgruto T, Lu P. Solution structure of an A-tract bend. J Mol Biol. 2001;306:1081–1098. doi: 10.1006/jmbi.2001.4447. [DOI] [PubMed] [Google Scholar]
- 17.Barbiè A, Zimmer DP, Crothers DM. Structural origins of adenine-tract bending. Proc Natl Acad Sci USA. 2003;100:2369–2373. doi: 10.1073/pnas.0437877100. [DOI] [PMC free article] [PubMed] [Google Scholar]
- 18.Wu A, Delaglio F, Tjandra N, Zhurkin VB, Bax A. Overall structure and sugar dynamics of a DNA dodecamer from homo- and heteronuclear dipolar couplings and 31P chemical shift anisotropy. J Biomol NMR. 2003;26:297–315. doi: 10.1023/a:1024047103398. [DOI] [PubMed] [Google Scholar]
- 19.Marincola FC, Denisov VP, Halle B. Competitive Na+ and Rb+ binding in the minor groove of DNA. J Am Chem Soc. 2004;126:6739–6750. doi: 10.1021/ja049930z. [DOI] [PubMed] [Google Scholar]
- 20.Stefl R, Wu H, Ravindranathan S, Sklenáø V, Feigon J. DNA A-tract bending in three dimensions: solving the dA4T4 vs. dT4A4 conundrum. Proc Natl Acad Sci USA. 2004;101:1177–1182. doi: 10.1073/pnas.0308143100. [DOI] [PMC free article] [PubMed] [Google Scholar]
- 21.Tóth K, Sauermann V, Langowski J. DNA curvature in solution measured by fluorescence resonance energy transfer. Biochemistry. 1998;37:8173–8179. doi: 10.1021/bi973135z. [DOI] [PubMed] [Google Scholar]
- 22.Strauss JK, Maher LJ., III DNA bending by asymmetric phosphate neutralization. Science. 1994;266:1829–1834. doi: 10.1126/science.7997878. [DOI] [PubMed] [Google Scholar]
- 23.Stellwagen NC, Magnusdóttir S, Gelfi C, Righetti PG. Preferential counterion binding to A-tract DNA oligomers. J Mol Biol. 2001;305:1025–1033. doi: 10.1006/jmbi.2000.4362. [DOI] [PubMed] [Google Scholar]
- 24.Young MA, Jayaram B, Beveridge DL. Intrusion of counterions into the spine of hydration in the minor groove of B-DNA: fractional occupancy of electronegative pockets. J Am Chem Soc. 1997;119:59–69. [Google Scholar]
- 25.Feig M, Pettit BM. Sodium and chlorine ions as part of the DNA solvation shell. Biophys J. 1999;77:1769–1781. doi: 10.1016/S0006-3495(99)77023-2. [DOI] [PMC free article] [PubMed] [Google Scholar]
- 26.Hammelberg D, McFail-Isom L Williams LD, Wilson WD. Flexible structure of DNA: ion dependence of minor-groove structure and dynamics. J Am Chem Soc. 2000;122:10513–10520. [Google Scholar]
- 27.Korolev N, Lyubartsev AP, Laaksonen A, Nordenskiöld L. On the competition between water, sodium ion, and spermine in binding to DNA: a molecular dynamics computer simulation study. Biophys J. 2002;82:2860–2875. doi: 10.1016/S0006-3495(02)75628-2. [DOI] [PMC free article] [PubMed] [Google Scholar]
- 28.Mocci F, Saba G. Molecular dynamics simulations of A·T-rich oligomers: sequence-specific binding of Na+ in the minor groove of B-DNA. Biopolymers. 2003;68:471–485. doi: 10.1002/bip.10334. [DOI] [PubMed] [Google Scholar]
- 29.Korolev N, Lyubartsev AP, Laaksonen A, Nordenskiöld L. A molecular dynamics simulation study of oriented DNA with polyamine and sodium counterions: diffusion and averaged binding of water and cations. Nucleic Acids Res. 2003;31:5971–5981. doi: 10.1093/nar/gkg802. [DOI] [PMC free article] [PubMed] [Google Scholar]
- 30.Várnai P, Zakrzewska K. DNA and its counterions: a molecular dynamics study. Nucleic Acids Res. 2004;32:4269–4280. doi: 10.1093/nar/gkh765. [DOI] [PMC free article] [PubMed] [Google Scholar]
- 31.Ponomarev SY, Thayer KM, Beveridge DL. Ion motions in molecular dynamics simulations on DNA. Proc Natl Acad Sci USA. 2004;101:14771–14775. doi: 10.1073/pnas.0406435101. [DOI] [PMC free article] [PubMed] [Google Scholar]
- 32.Rueda M, Cubero E, Laughton CA, Orozco M. Exploring the counterion atmosphere around DNA: what can be learned from molecular dynamics simulations? Biophys J. 2004;87:800–811. doi: 10.1529/biophysj.104.040451. [DOI] [PMC free article] [PubMed] [Google Scholar]
- 33.Olson WK, Zhurkin VB. Twenty years of DNA bending. In: Sarma RH, Sarma MH, editors. Biological Structure and Dynamics. Adenine Press; Schenectedy, N.Y.: 1995. pp. 341–370. [Google Scholar]
- 34.McFail-Isom L, Sines CC, Williams LD. DNA structure: cations in charge? Curr Op Struct Biol. 1999;9:298–304. doi: 10.1016/S0959-440X(99)80040-2. [DOI] [PubMed] [Google Scholar]
- 35.Williams LD, Maher LJ., III Electrostatic mechanisms of DNA deformation. Annu Rev Biophys Biomol Struct. 2000;29:497–521. doi: 10.1146/annurev.biophys.29.1.497. [DOI] [PubMed] [Google Scholar]
- 36.Hud NV, Plavec J. A unified model for the origin of DN sequence-directed curvature. Biopolymers. 2003;69:144–159. doi: 10.1002/bip.10364. [DOI] [PubMed] [Google Scholar]
- 37.Manning GS. The contribution of transient counterion imbalances to DNA bending fluctuations. Biophys J. 2006;90:3208–3215. doi: 10.1529/biophysj.105.078865. [DOI] [PMC free article] [PubMed] [Google Scholar]
- 38.Range K, Mayaan E, Maher LJ, III, York DM. The contribution of phosphate-phosphate repulsions to the free energy of DNA bending. Nucleic Acids Res. 2005;33:1257–1268. doi: 10.1093/nar/gki272. [DOI] [PMC free article] [PubMed] [Google Scholar]
- 39.Shikiya R, Li J-S, Gold B, Marky LA. Incorporation of cationic chains in the Dickerson-Drew dodecamer: correlation of energetics, structure and ion and water binding. Biochemistry. 2005;44:12582–12588. doi: 10.1021/bi050897i. [DOI] [PubMed] [Google Scholar]
- 40.Williams SL, Parkhurst LK, Parkhurst LJ. Changes in DNA bending and flexing due to tethered cations detected by fluorescence resonance energy transfer. Nucleic Acids Res. 2006;34:1028–1035. doi: 10.1093/nar/gkj498. [DOI] [PMC free article] [PubMed] [Google Scholar]
- 41.Strauss JK, Roberts C, Nelson MG, Switzer C, Maher LJ., III DNA bending by hexamethylene-tethered ammonium ions. Proc Natl Acad Sci USA. 1996;93:9515–9520. doi: 10.1073/pnas.93.18.9515. [DOI] [PMC free article] [PubMed] [Google Scholar]
- 42.Smith RM, Alberty RA. The apparent stability constants of ionic complexes of various adenosine phosphates with monovalent cations. J Phys Chem. 1956;60:180–184. [Google Scholar]
- 43.Smith RM, Martell AE, Chen Y. Critical evaluation of stability constants for nucleotide complexes with protons and metal ions and the accompanying enthalpy changes. Pure & Appl Chem. 1991;63:1015–1080. [Google Scholar]
- 44.Stellwagen E, Stellwagen NC. Quantitative analysis of cation binding to the adenosine nucleotides using the variable ionic strength (VIS) method: validation of the Debye-Hückel-Onsager theory of electrophoresis in the absence of counterion binding. Electrophoresis. 2006 doi: 10.1002/elps.200600487. in press. [DOI] [PubMed] [Google Scholar]
- 45.Sigel H, Griesser R. Nucleoside 5′-triphosphates: self-association, acid-base, and metal ion-binding properties in solution. Chem Soc Rev. 2005;34:875–900. doi: 10.1039/b505986k. [DOI] [PubMed] [Google Scholar]
- 46.Heegaard NHH, Kennedy RT. Identification, quantitation, and characterization of biomolecules by capillary electrophoretic analysis of binding interactions. Electrophoresis. 1999;20:3122–3133. doi: 10.1002/(SICI)1522-2683(19991001)20:15/16<3122::AID-ELPS3122>3.0.CO;2-M. [DOI] [PubMed] [Google Scholar]
- 47.Tanaka Y, Terabe S. Estimation of binding constants by capillary electrophoresis. J Chromatogr B. 2002;768:81–92. doi: 10.1016/s0378-4347(01)00488-1. [DOI] [PubMed] [Google Scholar]
- 48.Li D, Fu S, Lucy CA. Prediction of electrophoretic mobilities. 3. Effect of ionic strength in capillary zone electrophoresis. Anal Chem. 1999;71:687–699. doi: 10.1021/ac980843x. [DOI] [PubMed] [Google Scholar]
- 49.Jouyban A, Kenndler E. Theoretical and empirical approaches to express the mobility of small ions in capillary electrophoresis. Electrophoresis. 2006;27:992–1005. doi: 10.1002/elps.200500696. [DOI] [PubMed] [Google Scholar]
- 50.Stellwagen E, Stellwagen NC. The free solution mobility of DNA in Tris-acetate-EDTA buffers of different concentrations, with and without added NaCl. Electrophoresis. 2002;23:1935–1941. doi: 10.1002/1522-2683(200206)23:12<1935::AID-ELPS1935>3.0.CO;2-#. [DOI] [PubMed] [Google Scholar]
- 51.Stellwagen E, Stellwagen NC. Probing the electrostatic shielding of DNA with capillary electrophoresis. Biophys J. 2003;84:1855–1866. doi: 10.1016/S0006-3495(03)74993-5. [DOI] [PMC free article] [PubMed] [Google Scholar]
- 52.Stellwagen NC, Gelfi C, Righetti PG. The free solution mobility of DNA. Biopolymers. 1997;42:687–703. doi: 10.1002/(SICI)1097-0282(199711)42:6<687::AID-BIP7>3.0.CO;2-Q. [DOI] [PubMed] [Google Scholar]
- 53.Williams BA, Vigh G. Fast, accurate mobility determination method for capillary electrophoresis. Anal Chem. 1995;68:1174–1180. doi: 10.1021/ac950968r. [DOI] [PubMed] [Google Scholar]
- 54.Grossman PD. Factors affecting the performance of capillary electrophoresis separations: Joule heating, electroosmosis, and zone dispersion. In: Grossman PD, Colburn JD, editors. Capillary Electrophoresis, Theory and Practice. Academic Press; San Diego: 1992. pp. 3–43. [Google Scholar]
- 55.Bockris JO’M, Reddy AKN. Modern Electrochemistry. 2. Vol. 1. Plenum Press; New York: 1998. [Google Scholar]
- 56.Manning GS. Limiting laws and counterion condensation in polyelectrolyte solutions. 7. Electrophoretic mobility and conductance. J Phys Chem. 1981;85:1506–1515. [Google Scholar]
- 57.Stellwagen E, Dong Q, Stellwagen NC. Monovalent cations affect the free solution mobility of DNA by perturbing the hydrogen-bonded structure of water. Biopolymers. 2005;78:62–68. doi: 10.1002/bip.20260. [DOI] [PubMed] [Google Scholar]
- 58.Weast RC, editor. CRC Handbook of Chemistry and Physics. 65. CRC Press; Boca Raton, FL: 1984. pp. D171–D172. [Google Scholar]
- 59.Smith RM, Alberty RA. The apparent stability constants of ionic complexes of various adenosine phosphates with monovalent cations. J Phys Chem. 1956;60:180–184. [Google Scholar]
- 60.Botts J, Chasin A, Young HL. Alkali metal binding by ethylenediaminetetraacetate, adenosine 5′-triphosphate, and pyrophosphate. Biochemistry. 1965;4:1788–1796. [Google Scholar]
- 61.Wilson JE, Chin A. Chelation of divalent cations by ATP, studied by titration calorimetry. Anal Biochem. 1991;193:16–19. doi: 10.1016/0003-2697(91)90036-s. [DOI] [PubMed] [Google Scholar]
- 62.Haake P, Prigodich RV. Method for determination of phosphate anion-cation association constants from 31P chemical shifts. Inorg Chem. 1984;23:457–462. [Google Scholar]
- 63.Klein SD, Bates RG. Conductance of tris(hydroxymethyl)aminomethane hydrochloride (Tris·Cl) in water at 25 and 37°C. J Solution Chem. 1980;9:289–292. [Google Scholar]
- 64.Wyman J, Gill SJ. Binding and Linkage. University Science Books; Mill Valley, CA: 1990. [Google Scholar]
- 65.Kilkuskie R, Wood N, Ringquist S, Shinn R, Hanlon S. Effects of charge modification on the helical period of duplex DNA. Biochemistry. 1988;27:4377–4386. doi: 10.1021/bi00412a026. [DOI] [PubMed] [Google Scholar]
- 66.Owczazy R, Dunietz I, Behlke MA, Klotz IM, Walder JA. Thermodynamic treatment of oligonucleotide duplex-simplex equilibria. Proc Natl Acad Sci USA. 2003;100:14840–14845. doi: 10.1073/pnas.2335948100. [DOI] [PMC free article] [PubMed] [Google Scholar]
- 67.Manning GS. The molecular theory of polyelectrolyte solutions with applications to the electrostatic properties of polynucleotides. Quart Rev Biophys. 1978;11:179–246. doi: 10.1017/s0033583500002031. [DOI] [PubMed] [Google Scholar]
- 68.Record MT, Jr, Anderson CF, Lohman TM. Thermodynamic analysis of ion effects on the binding and conformational equilibria of proteins and nucleic acids: the roles of ion association or release, screening, and ion effects on water activity. Quart Rev Biophys. 1978;11:103–178. doi: 10.1017/s003358350000202x. [DOI] [PubMed] [Google Scholar]
- 69.Tan Z-J, Chen SJ. Electrostatic correlations and fluctuations for ion binding to a finite length polyelectrolyte. J Chem Phys. 2005;122:044903. doi: 10.1063/1.1842059. [DOI] [PMC free article] [PubMed] [Google Scholar]
- 70.Tan Z-J, Chen S-J. Nucleic acid helix stability: effects of salt concentration, cation valence and size, and chain length. Biophys J. 2006;90:1175–1190. doi: 10.1529/biophysj.105.070904. [DOI] [PMC free article] [PubMed] [Google Scholar]
- 71.Tan ZJ, Chen SJ. Ion-mediated nucleic acid helix-helix interactions. Biophys J. 2006;91:518–536. doi: 10.1529/biophysj.106.084285. [DOI] [PMC free article] [PubMed] [Google Scholar]