

Abstract
Dopamine and GABA neurons in the ventral tegmental area project to the nucleus accumbens and prefrontal cortex and modulate locomotor and reward behaviors as well as cognitive and affective processes. Both midbrain cell types receive synapses from glutamate afferents that provide an essential control of behaviorally-linked activity patterns, although the sources of glutamate inputs have not yet been completely characterized. We used antibodies against the vesicular glutamate transporters VGlut1 and VGlut2 to investigate the morphology and synaptic organization of axons containing these proteins as putative markers of glutamate afferents from cortical versus subcortical sites, respectively. We also characterized the ventral tegmental area cell populations receiving VGlut1+ or VGlut2+ synapses according to their transmitter phenotype (dopamine or GABA) and major projection target (nucleus accumbens or prefrontal cortex). By light and electron microscopic examination, VGlut2+ as opposed to VGlut1+ axon terminals were more numerous, had a larger average size, synapsed more proximally, and were more likely to form convergent synapses onto the same target. Both axon types formed predominantly asymmetric synapses, although VGlut2+ terminals more often formed synapses with symmetric morphology. No absolute selectivity was observed for VGlut1+ or VGlut2+ axons to target any particular cell population. However, the synapses onto mesoaccumbens neurons more often involved VGlut2+ terminals, whereas mesoprefrontal neurons received relatively equal synaptic inputs from VGlut1+ and VGlut2+ profiles. The distinct morphological features of VGlut1 and VGlut2 positive axons suggest that glutamate inputs from presumed cortical and subcortical sources, respectively, differ in the nature and intensity of their physiological actions on midbrain neurons. More specifically, our findings imply that subcortical glutamate inputs to the ventral tegmental area expressing VGlut2 predominate over cortical sources of excitation expressing VGlut1 and are more likely to drive the behaviorally-linked bursts in dopamine cells that signal future expectancy or attentional shifting.
Keywords: dopamine, GABA, nucleus accumbens, prefrontal cortex, VGlut1, VGlut2
Dopamine (DA) and GABA neurons in the ventral tegmental area (VTA) project to such forebrain areas as the prefrontal cortex (PFC) and nucleus accumbens (NAc) and provide a critical modulatory influence on motivated, cognitive and rewarding brain functions. Behaviorally significant DA efflux in target areas is associated with burst firing in midbrain DA neurons (Brozoski et al., 1979, Sawaguchi and Goldman-Rakic, 1994, Koob, 1996, Redgrave et al., 1999), and both in vivo and in vitro studies demonstrate that such bursts are dependent on intact glutamate inputs (Grace and Bunney, 1984, Johnson et al., 1992, Overton and Clark, 1992, Chergui et al., 1993, Lodge and Grace, 2006). Therefore, defining the approximate sources and extent of glutamate innervation to the VTA is essential for elucidating the morphological basis for behavioral control of these cells.
Until recently, there were few reliable markers of glutamate neurons and their processes, given that glutamate is also a component of various metabolic processes including GABA synthesis (Waagepetersen et al., 1999). Within the past few years, major progress in this area has been achieved by the identification of proteins responsible for transport of glutamate into synaptic vesicles (Lee et al., 1999, Bai et al., 2001). Two vesicular glutamate transporters, VGlut1 and VGlut2, are currently accepted as specific markers of glutamate phenotype in neurons (Takamori et al., 2000, Fremeau et al., 2001, Herzog et al., 2001). In adult animals, VGlut1 mRNA is detected mainly within cortical cells, and VGlut2 expresses mostly within the thalamus and other subcortical structures (Ni et al., 1995, Hisano et al., 2000, Herzog et al., 2001, Hisano et al., 2002, Stornetta et al., 2002, Hur and Zaborszky, 2005). There are of course some exceptions, for example VGlut1 mRNA is expressed in cells of the medial habenula and cerebellum, and VGlut2 mRNA occurs in cortical layer IV neurons (Fremeau et al., 2001). However, the latter cells have not been shown to project outside the cortex, and the other brain regions are not major afferents to the VTA (Geisler and Zahm, 2005). A few brain areas such as the hypothalamus contain neurons of both types (Ziegler et al., 2002), although co-expression of these proteins in the same cells occurs almost exclusively during development and not in adulthood (Herzog et al., 2001, Fujiyama et al., 2003, Danik et al., 2005). At the same time, it is not known whether all glutamate cells and projections can be described by the presence of one of these two transporters. Another vesicular glutamate transporter, VGlut3, has been revealed based on sequence homology (Fremeau et al., 2002, Gras et al., 2002). However, it has been detected in cells not commonly considered to have a glutamate phenotype and so might have a role unrelated to glutamate neurotransmission (Fremeau et al., 2002, Fremeau et al., 2004b, Herzog et al., 2004). For this reason, we confined the present analysis to the inclusion of only VGlut1 and VGlut2.
The expression of a particular transporter might impact the glutamate release characteristics of individual neurons, as VGlut1+ synapses have been hypothesized to exhibit a low probability of transmitter release, whereas VGlut2 is expressed more commonly in synapses with a relatively high release probability (Varoqui et al., 2002, Fremeau et al., 2004a, Schuske and Jorgensen, 2004). It is possible that such distinct properties might correlate with the morphological characteristics of glutamate axons or the types of cells they innervate. Hence, the current study sought to compare the morphological and synaptic characteristics of VGlut1+ and VGlut2+ axons innervating the rat VTA and to begin to define their postsynaptic targets.
In a previous study, we showed that PFC inputs from the prelimbic and infralimbic cortices synapsed selectively onto DA but not GABA mesoprefrontal cells and onto GABA but not DA mesoaccumbens neurons in the VTA (Carr and Sesack, 2000). As this cortical input is expected to contain VGlut1, we hypothesized that the present study would support these prior results. The major subcortical source of glutamate afferents to the midbrain identified in the current literature is the brainstem mesopontine tegmentum (Lavoie and Parent, 1994a, Charara et al., 1996). A subset of this region, the laterodorsal tegmentum (LDT), provides extensive synaptic input to DA but not GABA mesoaccumbens neurons and equivalent innervation of both DA and GABA mesoprefrontal cells (Omelchenko and Sesack, 2005). However, this pathway contains multiple transmitter phenotypes (Clements et al., 1991, Lavoie and Parent, 1994b), and only the excitatory portion of the projection is expected to contain VGlut2 and not VGlut1 (Fremeau et al., 2001, Hur and Zaborszky, 2005). Based on these observations, we hypothesized that VGlut2 immunoreactive axons would synapse preferentially onto mesoaccumbens DA neurons and also innervate DA and GABA cells projecting to the PFC.
To test these hypotheses, we conducted electron microscopic examination of the VTA in animals following injections of the retrograde tracer FluoroGold (FG) into either the PFC or NAc using a previously published approach (Carr and Sesack, 2000, Omelchenko and Sesack, 2005, Omelchenko and Sesack, 2006a). Immunoperoxidase labeling was used to detect the presence of FG in soma and dendrites and either VGlut1 or VGlut2 in axons. Immunogold-silver was used to identify GABA or tyrosine hydroxylase (TH) immunoreactivity within VTA neurons.
EXPERIMENTAL PROCEDURES
Subjects and surgeries
As approved by the Institutional Animal Care and Use Committee at the University of Pittsburgh and in accordance with the NIH Guide for the Care and Use of Laboratory Animals, tract-tracing experiments were performed on six adult male Sprague-Dawley rats (Hilltop Lab Animals Inc, 330–360 g). Three additional naive rats were used to determine the optimal dilution of antibodies directed against VGlut1 or VGlut2 and to examine single labeling for these proteins within the VTA by light microscopy.
The design used for the present study is similar to that of our prior publications (Carr and Sesack, 2000, Omelchenko and Sesack, 2005, Omelchenko and Sesack, 2006a). The animals received bilateral injections of the retrograde tracer Fluoro-Gold (FG; Fluorochrome, Denver, CO) into either the NAc (3 animals) or the PFC (3 animals). FG was dissolved as a 1% solution in 100 mM cacodylate buffer (pH 7.5) and was iontophoretically injected (+5 μA pulsed 10 seconds on/off) for 20 minutes through a glass micropipette with 50–75 μm tip diameter. To limit the spread of tracer while still maximizing uptake, two injections per hemisphere were performed within each region of interest. The starting coordinates for NAc injections were 1.7 mm anterior to Bregma, 2.5 mm lateral to the midline, with pipettes lowered at a 10° angle in the coronal plane to reach 7.7 and 6.8 mm ventral to the skull surface. The starting coordinates for PFC injections were 4.0 mm anterior to Bregma, 0.8 mm lateral to midline with pipettes lowered straight down to reach 4.6 and 3.6 mm ventral to the skull surface. These coordinates were chosen from the atlas of Paxinos and Watson (Paxinos and Watson, 1998). The location of injections sites and effectiveness of FG transport was verified independently for each animal in the study (please see Results section).
After a 5–13 day survival period, all animals were anesthetized with pentobarbital (60 mg/kg, i.p., with supplemental doses if necessary). To prevent silver intensification of endogenous zinc (Veznedaroglu and Milner, 1992), animals were pretreated with the zinc chelator, diethyldithiocarbamic acid (1 g/kg, i.p., Sigma, St. Louis, MO) and killed by transcardial perfusion 15 minutes later. The perfusion was started with heparin saline (1000 U/ml; Elkins-Sinn, NJ, USA), followed by 50 ml of 3.75% acrolein (Electron Microscopy Sciences, Fort Washington, PA) and 2% paraformaldehyde (Electron Microscopy Sciences) in 0.1 M phosphate buffer, pH 7.4 (PB) and completed by 200–400 ml of 2% paraformaldehyde in 0.1 M PB. The brains were removed, and 4–6 mm coronal blocks containing the PFC, NAc or VTA were post-fixed in 2% paraformaldehyde for 0.5–1 hour, sliced in PB on a vibratome at 50 μm and incubated in 1% sodium borohydride in PB for 30 minutes to improve immunocytochemical labeling.
Immunocytochemistry
For the main electron microscopic study, the sections were processed according to a triple labeling procedure using three primary and two secondary antibodies in which the localization of VGlut1 or VGlut2 and FG was revealed by the avidin-biotin peroxidase method, and the phenotype of target neurons was determined by immunogold-silver labeling for GABA or for TH. Given that FG injections were performed in two different locations (the PFC or NAc), eight different tissue sets were generated (please see Table 1). We also developed single labeled sections using one primary and one secondary antibody and avidin-biotin peroxidase. These single labeled sections were used for light microscopy to verify the position of FG injections and effectiveness of transport and to reveal the distribution of VGlut1 and VGlut2 positive terminals in the VTA and surrounding areas. Sections singly labeled for FG were also examined to verify that VTA transport was exclusively retrograde. All immunolabeling procedures were performed on free-floating sections at room temperature with constant shaking, and all immunoreagent incubations were followed by extensive rinses in buffer.
Table 1.
Synaptic Targets of VGlut Labeled Axons in the Rat VTA
| I. Tissue labeled for TH | |||||||
|
| |||||||
| VGlut1 input to dendrites labeled for: | VGlut2 input to dendrites labeled for: | ||||||
| Unlabeled | TH | FG | FG+TH | Unlabeled | TH | FG | FG+TH |
|
|
|
||||||
| A. Retrograde transport from NAc | |||||||
| Total synapses | |||||||
| 86 (61%) | 39 (28%) | 3 (2%) | 12 (9%) | 112 (44%) | 92 (37%) | 19 (8%) | 29 (12%) |
| Asymmetric/Symmetric | |||||||
| 84/2 | 39/0 | 3/0 | 12/0 | 102/10 | 77/15 | 18/1 | 25/4 |
| B. Retrograde transport from PFC | |||||||
| Total synapses | |||||||
| 62 (50%) | 55 (44%) | 3 (2%) | 5 (4%) | 70 (39%) | 91 (51%) | 7 (4%) | 10 (6%) |
| Asymmetric/Symmetric | |||||||
| 56/6 | 51/4 | 3/0 | 4/1 | 67/3 | 80/11 | 7/0 | 10/0 |
|
| |||||||
| II. Tissue labeled for GABA | |||||||
|
| |||||||
| VGlut1 input to dendrites labeled for: | VGlut2 input to dendrites labeled for: | ||||||
| Unlabeled | GABA | FG | FG+GABA | Unlabeled | GABA | FG | FG+GABA |
|
|
|
||||||
| A. Retrograde transport from NAc | |||||||
| Total synapses | |||||||
| 42 (53%) | 25 (31%) | 4 (5%) | 9 (11%) | 57 (31%) | 76 (42%) | 20 (11%) | 30 (16%) |
| Asymmetric/Symmetric | |||||||
| 42/0 | 24/1 | 4/0 | 9/0 | 52/5 | 63/13 | 20/0 | 29/1 |
| B. Retrograde transport from PFC | |||||||
| Total synapses | |||||||
| 79 (60%) | 41 (31%) | 9 (7%) | 2 (2%) | 107 (59%) | 43 (24%) | 10 (5%) | 22 (12%) |
| Asymmetric/Symmetric | |||||||
| 78/1 | 40/1 | 9/0 | 2/0 | 97/10 | 35/8 | 9/1 | 21/1 |
The primary antibodies directed against FG, TH and GABA have been used extensively in studies conducted by us (Sesack et al., 1995, Carr and Sesack, 2000, Omelchenko and Sesack, 2005, Omelchenko and Sesack, 2006a) and others (Van Bockstaele and Pickel, 1995, Aston-Jones et al., 2004, Waselus et al., 2005). Evidence for specificity of the rabbit polyclonal antibody against FG (#AB153, Chemicon, Temecula, CA) is the absence of immunostaining in brain areas that do not innervate the injection site. The mouse monoclonal antibody for TH (Chemicon #MAB318), directed against a 59–61 kDa protein from the N-terminus of TH purified from PC12 cells, does not recognize other monoamine synthetic enzymes by western blot analysis. The mouse monoclonal antibody against GABA (Sigma #A-0310) was raised against purified GABA conjugated to bovine serum albumin and does not recognize several other closely related amino acids on dot blots.
The observed patterns of immunostaining produced by VGlut1 or VGlut2 antibodies raised in rabbit or guinea pig were similar to each other and in agreement with available literature (Bellocchio et al., 1998, Fremeau et al., 2001, Kaneko and Fujiyama, 2002, Fujiyama et al., 2003, Commons et al., 2005) and virtually identical across species. The rabbit polyclonal VGlut antibodies were generously supplied by Dr. Robert Edwards (UCSF School of Medicine, San Francisco, CA) and were extensively characterized in his prior publications (Bellocchio et al., 1998, Fremeau et al., 2001). The VGlut1 antibody was directed against a glutathione S-transferase fusion protein purified from E. coli containing the last 68 amino acids (residues 493–560) of the rat VGlut1 protein-coding region. The VGlut2 antibody was directed against a fusion protein involving nucleotides 2017–2220 from the 3′ end of the rat VGlut2 protein-coding region. Preadsorption of either VGlut antibodies with the corresponding fusion proteins eliminated immunoreactivity (Bellocchio et al., 1998, Fremeau et al., 2001). The guinea pig polyclonal antibodies against VGlut1 (#23071078) and VGlut2 (#23041014) were purchased from Chemicon and used exclusively for light microscopic analyses. The corresponding immunogens were synthetic peptides from the rat VGlut1 and VGlut2 proteins, and the specificity of immunostaining was established by preadsorption with these peptides (manufacturer’s information).
Sections were first rinsed in 0.1 M tris-buffered saline, pH 7.6 (TBS) and then incubated for 30 minutes in blocking solution: 1% bovine serum albumin, 3% normal donkey serum in 0.1 M TBS containing Triton X-100 (Sigma) either at 0.04% for electron microscopy or at 0.2% for light microscopy. Then sections were placed for 12–15 hours into blocking solution containing a mixture of three primary antibodies: rabbit anti-FG (1:2000; Chemicon, Temecula, CA), either rabbit anti VGlut1 (1:5000) or VGlut2 (1:8000) and either mouse anti-TH (1:8000; Chemicon) or mouse anti-GABA (1:1000; Sigma). After brief rinsing, sections were placed for 30 minutes in blocking solution containing biotinylated donkey anti-rabbit IgG (1:400; Jackson ImmunoResearch Laboratories, West Grove, PA) and rinsed in TBS. To label FG and either VGlut1 or VGlut2 by immunoperoxidase, sections were incubated for 30 minutes in 1:100 avidin-biotin peroxidase complex (Vectastain Elite kit; Vector Laboratories), followed by 0.022% diaminobenzidine (Sigma) and 0.003% hydrogen peroxide in TBS for 3–3.5 minutes.
After sections were rinsed extensively in TBS, TH and GABA were visualized by immunogold-silver by placing sections for 30 minutes in a washing buffer containing 0.8% bovine serum albumin, 0.1% fish gelatin, and 3% normal donkey serum in 10 mM phosphate buffered saline, pH 7.4 (PBS). Sections were then incubated for 12–15 hours in this solution to which was added 1:50 donkey anti-mouse IgG conjugated to 1 nm gold (Amersham, Arlington Heights, IL). Following several rinses in the washing buffer and PBS, the sections were postfixed by 2% glutaraldehyde in PBS and rinsed again in PBS and 0.2 M sodium citrate buffer, pH 7.4. Incubation in silver solution (Amersham) for 4–6 minutes was then conducted to enhance the size of gold particles.
Light and electron microscopy
For light microscopy, sections were mounted onto glass slides. After drying, they were dehydrated in serial alcohol solutions, immersed in xylene, and coverslipped with DPX. The examination of these sections was conducted using bright field microscopy. The digital light microscopic images obtained from these slides and illustrated here were processed in Adobe Photoshop to match brightness and contrast.
Sections for electron microscopy, including 4 different tissue sets per animal (VGlut1 + TH, VGlut1 + GABA, VGlut2 + TH, VGlut2 + GABA), were treated in 2% osmium tetroxide in PB for 1 hr, dehydrated in serial alcohol solutions and propylene oxide, and then left overnight in equal volumes of propylene oxide and epoxy resin (EMbed 812; Electron Microscopy Sciences). Sections were placed in straight epoxy resin for 2 hr and embedded between sheets of commercial polymer film. The plastic sheets were placed for at least 48 hr under a weight in a 60°C oven to harden the epoxy resin. Afterwards, polymerized sections were photographed to document the part of the VTA to be resectioned. Ultrathin (about 60 nm) sections were cut from the interface zone between tissue and plastic resin, collected onto copper mesh grids and counterstained with uranyl acetate and lead citrate.
The examination of sections was performed at 14,000–28,000X using an FEI Morgagni transmission electron microscope (Hillsboro, OR). Digital photomicrographs of immunoperoxidase-labeled axon terminals were acquired using an XP-60 camera from Advanced Microscopy Techniques (Danvers, MA). Contrast and illumination of photomicrographs used as illustrations were adjusted in Adobe Photoshop.
To avoid false negative results, we restricted the analysis to the outermost surface of the tissue where it interfaced with the epoxy resin and where immunoreagent penetration was maximal. We used established criteria for identification of neuronal elements (Peters et al., 1991) and gold-silver and peroxidase labeling (Omelchenko and Sesack, 2005, Omelchenko and Sesack, 2006a). In order to ensure equivalent penetration of immunoreagents within the regions analyzed, axons containing immunoperoxidase for VGlut1 or VGlut2 were evaluated only if profiles labeled by immunogold-silver were also evident within the same photographic field (approximately 13.8 μm2). Serial sections were used to verify the presence of immunogold-silver in targeted neuronal elements. We defined profiles as specifically labeled if they contained three or more particles in one section, although most labeled dendrites contained more than three particles.
In each set of tissue for each animal, we identified and photographed approximately 50 immunoperoxidase labeled axon terminals forming recognizable synapses in single sections (total of 476 for VGlut1 and 795 for VGlut2; Table 1). Asymmetric synapses (Grays’s type 1; Gray, 1959) had thickened postsynaptic densities and widened synaptic clefts; symmetric synapses (Gray’s type 2) had thin postsynaptic densities and narrower synaptic clefts. Often the photomicrographic fields contained additional immunoreactive axon varicosities that were not found to form synapses in single sections and were not further analyzed. Apparent symmetric synapses were examined in serial sections in order to ensure that they were not actually the edges of asymmetric synapses. Indeed, several synapses were reclassified following this analysis. The numbers given in the Results section are based on symmetric synapses for which the majority were verified in serial; only a few were hidden by the metal grid support and could not be verified.
We calculated the area examined for each set of tissue by multiplying the known boundaries of the grid mesh (3025 μm2) with the number of grid squares analyzed and an approximation of the tissue/resin ratio in each square (25%, 50%, 75% or 100%). In animals receiving FG injections into the NAc, the amount of tissue analyzed per group was: VGlut1 + TH, 192,088 μm2; VGlut1 + GABA, 213,263 μm2; VGlut2 + TH, 71,088 μm2; VGlut2 + GABA, 52,938 μm2. In animals receiving FG injections into the PFC the tissue area examined was: VGlut1 + TH, 161,081 μm2; VGlut1 + GABA, 158,813 μm2; VGlut2 + TH, 86,213 μm2; VGlut2 + GABA, 50,669 μm2.
Image analysis
Profile measurements were performed on captured digital images using Simple PCI software (Compix Inc, USA). The outer membranes of peroxidase labeled terminals and corresponding targeted dendrites were outlined by the operator. Each traced object was then analyzed for linear size based on their approximate shapes. For axon terminals, a relatively spherical shape was assumed, and diameter was calculated based on the area of each profile converted to a circle and using the equation . Dendrites were treated as approximately tubular in shape, and the minimum radius was determined as the distance between the center of gravity for each profile and the nearest part of the traced boundary. These measurements were performed for all terminals and innervated dendrites from all the data sets regardless of phenotype. In total, we measured the size of 507 VGlut1-labeled terminals and 492 of their synaptic targets and 787 VGlut2-labeled terminals and 773 of their terminal synaptic targets. The 31 additional VGlut1+ profiles that were measured here but are not represented in Table 1 (where n = 476) came from one tissue set where immunogold-silver labeling was compromised in a manner that prevented phenotypic characterization of dendritic targets. The absence of 8 VGlut2+ profiles from the size measures versus synaptic targets (Table 1, where n = 795) and the dissimilarity between the number of measured axons versus dendritic targets are explained by difficulties in recognizing the outer boundaries of some profiles (e.g. being partially obscured by the mesh grid).
Statistical analysis
For the comparisons of the size of VGlut1 versus VGlut2-labeled axons, as well as their dendritic targets, the data for each rat was averaged into a single mean for VGlut1 and for VGlut2. Paired t-tests with 2 degrees of freedom were then conducted based on these averages. A second analysis was also conducted using all the different numbers of repeated observations within a rat and performing multivariate analysis of variance (MANOVA) models with VGlut1 and VGlut2 treated as a within-rat experimental factor and having a general covariance structure (Kutner et al., 2005); the degrees of freedom method was Satterthwaite. The inferences using the MANOVA models confirmed those from the paired t-tests, and P-values are reported only from the paired t-test. The analyses were implemented using SAS PROC TTEST and PROC Mixed (Littell et al., 2006), and all were conducted with an alpha level = 0.05.
Differences in the extent to which VGlut1 and VGlut2 immunoreactive profiles exhibited particular morphological characteristics or innervated different VTA populations were analyzed using Fisher’s exact test (Matthews and Farewell, 1996). To correct for multiple comparisons, the critical P values were adjusted by the Bonferroni method (Hsu, 1996). Differences in morphological/synaptic properties between VGlut1+ and VGlut2+ terminals were tested in 3 comparisons (significance set at P = 0.015): predominate synapse type, presence of dense-cored vesicles, and extent of synaptic convergence onto common dendrites. The degree to which VGlut1+ and VGlut2+ terminals differed from each other in their contacts onto specific VTA cell populations was analyzed in 8 comparisons (significance set at P = 0.006): TH and non-TH, GABA and non-GABA, mesoaccumbens and non-mesoaccumbens, mesoprefrontal and non-mesoprefrontal, TH and non-TH mesoaccumbens, TH and non-TH mesoprefrontal, GABA and non-GABA mesoaccumbens, and GABA and non-GABA mesoprefrontal.
Comparisons were also made within each set of VGlut1+ and VGlut2+ synaptic contacts to determine whether either of these inputs favored specific VTA populations. VGlut1+ and VGlut2+ terminals were analyzed separately in 6 comparisons each (significance set at P = 0.008): TH versus GABA, mesoaccumbens versus mesoprefrontal, TH versus GABA mesoaccumbens, TH versus GABA mesoprefrontal, TH mesoaccumbens versus TH mesoprefrontal, and GABA mesoaccumbens versus GABA mesoprefrontal.
RESULTS
Light microscopy
The injections of the retrograde tracer FG into the NAc and PFC were conducted in a manner similar to those used in our previous studies (Carr and Sesack, 2000, Omelchenko and Sesack, 2005, Omelchenko and Sesack, 2006a) and produced comparable results. Visualized by immunoperoxidase, FG filled both the core and shell subdivisions of the NAc at mid rostro-caudal levels (Fig. 1A), whereas FG injections into the PFC were placed within prelimbic and infralimbic areas (terminology according to (Krettek and Price, 1977)) in rostral and middle parts of this structure (Fig. 1B). Following these injections, retrograde transport of FG was observed within soma and dendrites in both paranigral and parabrachial subdivisions of the VTA. Notably fewer neurons were involved following FG injections into the PFC (Fig. 1C,D).
Figure 1.

Light microscopic images of rat coronal brain sections. Panels A and B show injections of FG into the NAc or PFC, respectively. The corresponding retrograde transport of FG to the VTA is shown in panels C and D. Inserts show individual retrogradely labeled neurons and their dendritic processes. Arrows point to the same cells at low and high magnification. Abbreviations: ac, anterior commissure; cc, corpus callosum; fm, forceps minor; IP, interpeduncular nucleus; LV, lateral ventricle; ml, medial lemniscus. Scale bar, 1 mm in A and B, 500 μm in C and D, 125 μm in inserts.
Within the VTA at higher magnification, immunoperoxidase labeling for either VGlut1 or VGlut2 was uniformly distributed as small puncta representing probable axon varicosities (Fig. 2). Clusters of immunoreactive axons were also observed intermingled with the fibers of the fasciculus retroflexus for VGlut1 but not VGlut2 (Fig. 2A,B). No somatodendritic labeling was revealed for either marker, in agreement with prior immunocytochemistry studies (Varoqui et al., 2002). Qualitative comparison of VTA sections labeled for VGlut1 versus VGlut2 showed the latter protein to have a notably higher density and to be contained in varicosities of somewhat larger size on average compared to VGlut1 labeled puncta (Fig. 2C,D).
Figure 2.

Light microscopic images of coronal sections through the rat VTA illustrating peroxidase immunoreactivity for VGlut1 and VGlut2 at low (A and B) and high (C and D) magnification; asterisks indicate the same blood vessel in each pair. Labeling is confined to puncta having the appearance of axon varicosities. The density of VGlut2 labeling is noticeably higher than that of VGlut1 immunoreactivity, and the average size of VGlut2+ puncta appears somewhat larger. Note the presence of fibers immunoreactive for VGlut1 but not VGlut2 in the outer portions of the fasciculus retroflexus (fr). Scale bar, 100 μm for A and B, 25 μm for C and D.
Electron microscopy
Comparative morphology of VGlut1 and VGlut2 axon terminals in the VTA
Diffuse peroxidase labeling for VGlut1 (n = 476; Figs. 3, 5, 7 and 9) and VGlut2 (n = 795; Figs. 4, 6, 8 and 10) was distinguished within numerous axon terminals in the VTA. These immunolabeled varicosities contained tightly packed synaptic vesicles, mitochondria, and occasional dense-cored vesicles. The presence of the latter organelles was roughly equivalent between VGlut1+ (at least one observed in 5% of all terminals; Fig. 5B) and VGlut2+ (8%; Fig. 4A) terminals forming synapses (P = 0.1, Fisher’s exact test). In both terminal types, heavy peroxidase reaction product often compromised the recognition of dense cored vesicles, so that the actual proportions might be higher.
Figure 3.

Electron micrographs showing typical VGlut1-labeled axon terminals (VGlut1-t) in the rat VTA. The majority form asymmetric synapses (black arrows) onto unlabeled dendrites (ud), although symmetric synapses (white arrow) are occasionally observed. The synaptic convergence of multiple VGlut1-ts onto the same dendrite as shown in B is a relatively uncommon finding. Scale bar, 0.5 μm.
Figure 5.

Electron micrographs showing VGlut1-positive terminals (VGlut1-t) forming asymmetric synapses (black arrows) onto dendrites singly-labeled for TH (TH-d in A) or GABA (GABA-d in B). The VGlut1-t in panel B contains dense-cored vesicles (white arrowheads); GABA labeling is also apparent in an adjacent glial process (*). Scale bar, 0.4 μm.
Figure 7.
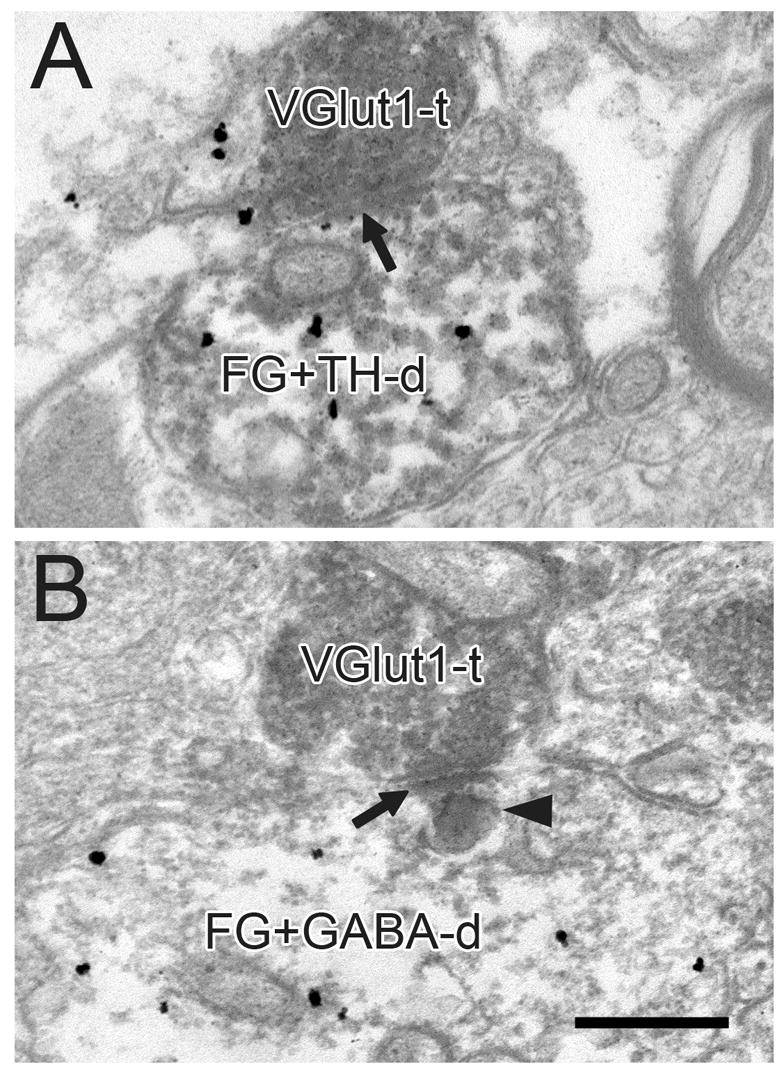
Electron micrographs of the VTA in rats receiving FG injections into the NAc. VGlut1-immunoreactive terminals (VGlut1-t) form asymmetric synapses (black arrows) onto dendrites dually-labeled for FG and TH (FG+TH-d in A) or FG and GABA (FG+GABA-d in B). In panel B, dense immunolabeling for FG is evident in a lysosome (black arrowhead). Scale bar, 0.4 μm.
Figure 9.
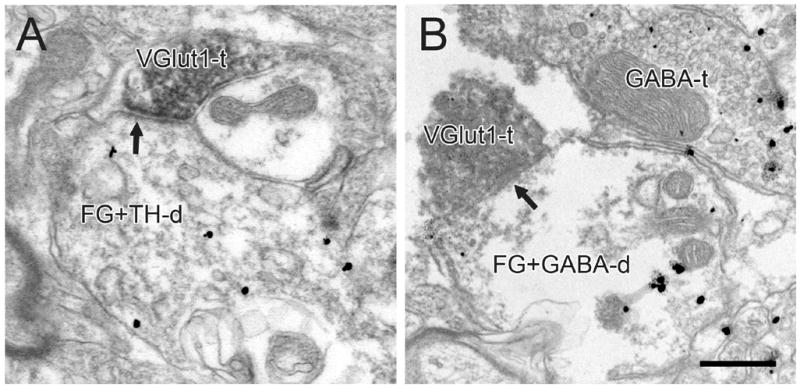
Electron micrographs of the VTA in rats receiving FG injections into the PFC. VGlut1-immunoreactive terminals (VGlut1-t) form asymmetric synapses (black arrows) onto dendrites dually-labeled for FG and TH (FG+TH-d in A) or FG and GABA (FG+GABA-d in B). An axon terminal immunoreactive for GABA (GABA-t) is evident in the adjacent neuropil. Scale bar, 0.4 μm.
Figure 4.
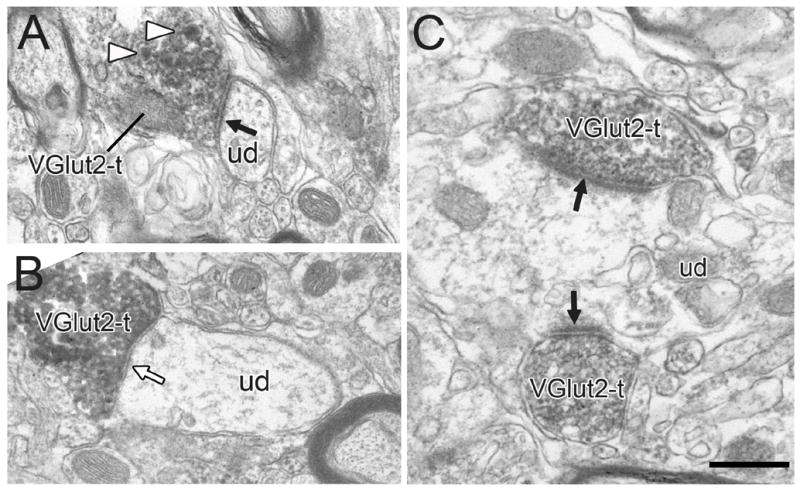
Electron micrographs showing typical VGlut2-labeled axon terminals (VGlut2-t). Most VGlut2-ts form asymmetric synapses (black arrows) onto unlabeled dendrites (ud), although others occasionally form symmetric synapses (white arrow). The VGlut2-t in panel A contains dense-cored vesicles (white arrowheads). Panel C shows an example of two VGlut2-ts forming convergent synapses onto a common dendrite. Scale bar, 0.5 μm in A, B; 0.4 μm in C.
Figure 6.
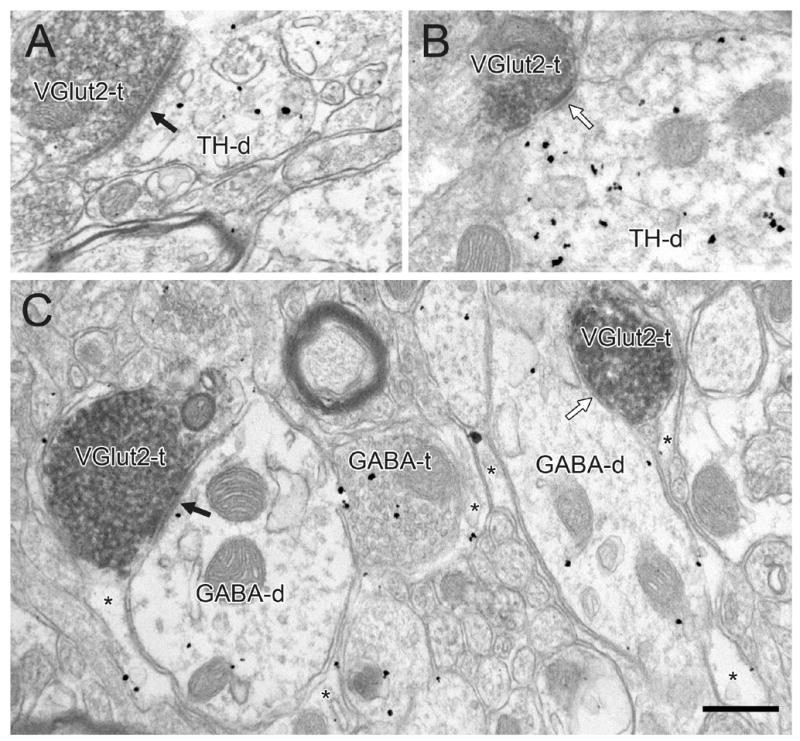
Electron micrographs showing VGlut2-positive terminals (VGlut2-t) forming asymmetric (black arrows) or symmetric (white arrow) synapses onto dendrites singly-labeled for TH (TH-d in A and B) or GABA (GABA-ds in C). In panel C, gold-silver labeling for GABA is also evident in an axon terminal (GABA-t) and in glial processes (asterisks). Scale bar, 0.4 μm.
Figure 8.
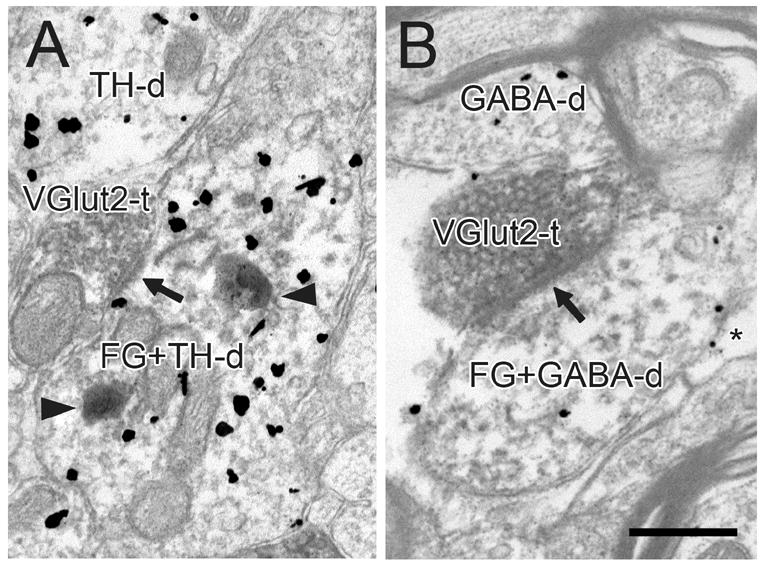
Electron micrographs of the VTA in rats receiving FG injections into the NAc. VGlut2-immunoreactive terminals (VGlut2-t) form asymmetric synapses (black arrows) onto dendrites dually-labeled for FG and TH (FG+TH-d in A) or FG and GABA (FG+GABA-d in B). Dendrites singly-labeled for TH (TH-d) and GABA (GABA-d) are evident in the adjacent neuropil. In panel A, dense immunolabeling for FG is evident in lysosomes (black arrowheads). Panel B shows gold-silver labeling for GABA in a glial process (*). Scale bar, 0.5 μm in A; 0.4 μm in B.
Figure 10.

Electron micrographs of the VTA in rats receiving FG injections into the PFC. VGlut2-immunoreactive terminals (VGlut2-t) form asymmetric synapses (black arrows) onto a dendrite dually-labeled for FG and TH (FG+TH-d in A), onto a dendrite singly-labeled for FG only (FG-d in B) or onto a soma (n, nucleus) dually-labeled for FG and GABA (FG+GABA-s in C). In panels A and B, the dendrites receive additional synaptic inputs from unlabeled terminals (ut). In C, dense immunolabeling for FG is evident in a lysosome (black arrowhead). Scale bar, 0.4 μm.
VGlut1 and VGlut2 positive profiles commonly targeted dendrites of various diameters and rarely soma (<1%; Fig. 10C). The majority of synapses formed by VGlut1+ (97%; Figs. 3, 5, 7 and 9) and VGlut2+ terminals (90%; Figs. 4A,C; 6A,C; 8; 10) had asymmetric morphology; the remainder were symmetric (VGlut1, Fig. 3B; VGlut2+, Figs. 4B; 6B,C). The tendency for VGlut2-immunoreactive terminals to more frequently form symmetric synapses than VGlut1+ axons was highly significant (P < 0.0001, Fisher’s exact test).
VGlut1 and VGlut2 positive axon varicosities and their synapses in the VTA showed other distinct features. As expected from light microscopic observations, we observed many more VGlut2 than VGlut1 positive profiles. Although the exact density of each axon type was not systematically quantified, we estimated the number of synaptic varicosities in the sample to be 4.5 times higher for VGlut2 than for VGlut1 (3.0 versus 0.66 per mm2, respectively). In addition, the mean diameter of terminals forming synapses was larger for VGlut2-labeled than for VGlut1-labeled profiles (0.90 ± 0.13 versus 0.72 ± 0.33 μm, respectively; mean ± standard error of the mean). This difference was consistently observed within each rat and was statistically significant (P = 0.003, t-test). The average minimum radius of the targeted dendrites also was larger for VGlut2+ than for VGlut1+ profiles (0.38 ± 0.13 versus 0.30 ± 0.18 μm, respectively). Again, this difference was observed within each rat and was significant (P = 0.002, t-test). As expected from their greater prevalence in the sample, it was also significantly more common to observe multiple VGlut2+ terminals (6.4%; Fig. 4C) synapsing onto a common dendrite than was seen for VGlut1+ terminals (0.8%; Fig. 3B; p<0.0001, Fisher’s exact test). These data reflect only the relative proportion of convergence that could be seen in single or a limited number of serial sections. Obviously, the actual degree of convergence onto individual cells is likely to be significantly higher for both terminal populations.
VTA profiles targeted by VGlut1 and VGlut2 immunoreactive axons
Immunogold-silver labeling for TH or GABA in soma and dendrites (Figs. 5–10), and the occasional observation of GABA immunoreactivity in axons (Figs. 6C, 9B) and glia (Figs. 5B, 6C, 8B), matched previous descriptions of the VTA (Bayer and Pickel, 1991, Carr and Sesack, 2000, Omelchenko and Sesack, 2005). Immunoperoxidase product for retrogradely transported FG was either diffusely localized to the cytoplasm (Figs. 7–10) or concentrated within lysosomes (Figs. 7B; 8A; 10C) as previously reported (Schmued et al., 1989, Carr and Sesack, 2000, Omelchenko and Sesack, 2005, Omelchenko and Sesack, 2006a). Mesoaccumbens and mesoprefrontal cell populations displayed no obvious differences in FG content or in gross morphological features.
All VTA cell populations defined by phenotype and by retrograde transport from target regions received synaptic input from VGlut1+ and VGlut2+ axon terminals (Tables 1–2), although the relative proportions of these contacts did show some significant differences. In most cases, these synapses were of the asymmetric type, with occasional symmetric synapses also encountered (Table 1). For ease of qualitative and statistical comparisons, the synapse types were combined.
Table 2.
Synaptic Inputs* to Rat VTA Cell Populations Identified by Tract-tracing and Immunomarkers
| Tract-tracing from: | Immunomarker for: | ||
|---|---|---|---|
| PFC | LDT | VGlut1 | VGlut2 |
| DA mesoaccumbens neurons | |||
| − | +++ | + | ++ |
| GABA mesoaccumbens neurons | |||
| ++ | − | ++ | ++ |
| DA mesoprefrontal neurons | |||
| + | + | + | + |
| GABA mesoprefrontal neurons | |||
| − | ++ | + | ++ |
Only asymmetric synapses are represented here.
− = no synapses found; +, ++, +++ = 1–10%, 10–20%, or >20%, respectively, of all synapses observed within each data set.
Across all TH immunolabeled tissue sets (Table 1, section I), 42% of VGlut1+ axons (Fig. 5A) and 52% of VGlut2+ terminals (Fig. 6A,B) formed synapses onto TH-labeled dendrites regardless of FG content. In tissue labeled for GABA (Table 1, section II), 36% of VGlut1+ terminals (Fig. 5B) and 47% of VGlut2+ synapses (Fig. 6C) contacted GABA-immunoreactive dendrites with or without FG. The tendency for VGlut2+ versus VGlut1+ axons to more frequently contact TH or GABA-labeled dendrites (P = 0.015 and 0.018, respectively) was not significant after Bonferroni adjustment for multiple comparisons (see Materials and Methods).
In tissue sections from the animals that received FG injections into the NAc (Table 1, sections IA and IIA), 13% of VGlut1+ (Fig. 7) and 23% of VGlut2+ profiles (Fig. 8) formed synaptic contacts onto dendrites immunoreactive for FG, regardless of neurotransmitter phenotype. The greater likelihood of VGlut2+ versus VGlut1+ axons synapsing onto cells retrogradely labeled from the NAc versus non-mesoaccumbens targets was statistically significant (P = 0.002).
In TH-labeled sections from these animals (Table 1, section IA), 9% of VGlut1+ (Fig. 7A) and 12% of VGlut2+ terminals (Fig. 8A) synapsed onto FG-positive profiles dually-labeled for TH. In GABA-labeled tissue from the same animals (Table 1, section IIA), 11% of VGlut1+ (Fig. 7B) and 16% of VGlut2+ terminals (Fig. 8B) formed synapses onto FG-immunoreactive dendrites that were also labeled for GABA. These differences between VGlut1+ and VGlut2+ axons were not significant.
In tissue sections from the animals that received FG injections into the PFC (Table 1, sections IB and IIB), 7% of VGlut1+ (Fig. 9) and 14% of VGlut2+ terminals (Fig. 10) formed synaptic contacts onto dendrites immunoreactive for FG, regardless of neurotransmitter phenotype. The tendency for VGlut2+ versus VGlut1+ axons to more frequently contact mesoprefrontal cells (P = 0.018) was not significant after Bonferroni correction.
In TH-labeled tissue sections from these animals (Table 1, sections IB), 4% of VGlut1+ (Fig. 9A) and 6% of VGlut2+ terminals (Fig. 10A) synaptically contacted FG-positive profiles dually-labeled for TH. This difference was not significant. In GABA-labeled tissue from the same animals (Table 1, sections IIB), 2% of VGlut1+ (Fig. 9B) and 12% of VGlut2+ immunoreactive terminals (Fig. 10C) formed synapses onto FG-immunoreactive dendrites that were also labeled for GABA. A few additional VGlut1+ and VGlut2+ terminals formed synaptic contacts onto dendrites singly-labeled for FG retrogradely transported from the PFC. Figure 10B shows one example for VGlut2. The greater frequency of VGlut2+ versus VGlut1+ terminals synapsing onto GABA labeled mesoprefrontal neurons was statistically significant (P = 0.005).
The observed frequencies with which VGlut1+ axons synapsed onto different VTA populations were apparently related to the relative presentation of these populations in the sample with no clear selectivity. The trend toward more frequent innervation of GABA mesoaccumbens versus GABA mesoprefrontal targets (P = 0.019) did not reach significance following Bonferroni correction. In contrast, VGlut2+ inputs demonstrated significant selectivity with regard to mesoaccumbens as apposed to mesoprefrontal cells (P = 0.001). The other defined VTA populations were innervated by VGlut2+ inputs in rough proportion to their presence in the sample.
DISCUSSION
This study represents the first ultrastructural comparison of VTA inputs from glutamate axons expressing VGlut1 versus VGlut2 as putative markers of cortical versus subcortical origins, respectively. The larger size, higher density, more frequent convergence, and more proximal contacts observed for VGlut2+ axons suggest that subcortical glutamate inputs to the VTA predominate over cortical sources of excitation in driving behaviorally-linked burst firing in DA cells. Other morphological distinctions between VGlut1 and VGlut2 axon terminals, most notably the greater incidence of symmetric synapses in the VGlut2 population, suggest additional complex differences in the net physiologically influence of each input onto VTA neurons.
Based on our prior findings utilizing neuronal tract-tracing, it was expected that differences would also be observed in the VTA cell populations targeted by VGlut1 versus VGlut2 labeled axons. However, this investigation revealed that both types of glutamate terminals provide some innervation to each of the VTA DA and GABA populations identified (Table 2). Nevertheless, inputs to mesoaccumbens cells overall and to mesoprefrontal GABA neurons more often derived from VGlut2+ than from VGlut1+ terminals. These findings will be discussed in relation to the anatomy and physiology of known glutamate afferents targeting the VTA and will include consideration of other possible sources of glutamate inputs not yet verified in the published literature.
Methodological consideration: limitations of the methods
The current study sought to first compare the morphological and synaptic characteristics of VGlut1+ and VGlut2+ axons innervating the VTA and then to begin to define their postsynaptic targets. The highly sensitive avidin-biotin immunoperoxidase procedure used to label VGlut proteins ensured that both axon populations were well represented in the sample comparing their ultrastructural features. The fact that only profiles forming recognized synapses were included in the analysis suggests that some characteristics might be over or under estimated if compared to an examination that included intervaricose segments or non-synaptic varicosities. Nevertheless, the VGlut proteins appear to concentrate in varicose portions of axons, and these profiles form synapses at a high frequency. Moreover, comparison of synaptic terminals ensures that each profile type was analyzed along a similar part of the axonal trajectory. One feature that probably did not benefit from the use of immunoperoxidase was the detection of dense-cored vesicles, which were sometimes obscured by reaction product. A more complete analysis of these vesicles could be obtained in future studies using the more particulate immunogold marker.
To accomplish the second goal of the study, we applied a previously established triple immunolabeling technique (Carr and Sesack, 2000, Omelchenko and Sesack, 2005, Omelchenko and Sesack, 2006a) that permits identification of discrete terminal types together with neurotransmitter phenotype and target projection of various VTA cell populations. In a study of this type, consideration must be given to potential sources of false positive and false negative data, which have been discussed extensively in our previous publications (see above). In brief, false positive results could derive from non-specific immunoreagents or erroneous transport of tract-tracing agents. However, these factors are unlikely to have effected the current results, given that antibody specificity is well established for the reagents used here, and the specificity of FG transport has also been demonstrated here and in our previous work (Omelchenko and Sesack, 2005, Omelchenko and Sesack, 2006a).
Of perhaps greater concern are the sources of false negative data, which include the inability of tract-tracing to label every single neuron in a projecting population and limited penetration of immunochemicals. The use of multiple, bilateral sites for tracer injection in each animal to some extent ensured a reasonable sample of retrogradely labeled neurons in each case. Moreover, the fact that some VGlut1+ and VGlut2+ axons contacted each of the populations analyzed suggests that failure to retrogradely transport FG did not unduly contribute to false negatives in this study. Restriction of the analysis to areas of the tissue surface with optimal antibody penetration and the use of serial sections to verify labeling have also reduced the problem of false negative results that attends limited antibody penetration. Nevertheless, as false-negative outcomes cannot be completely avoided, it is important to point out that these limitations are likely to affect all inputs and all VTA populations similarly. Hence, the current quantitative comparison should at least represent the relative characteristics of the VGlut1+ and VGlut2+ inputs.
Distinct properties of VGlut1 and VGlut2 inputs
Several morphological observations regarding VGlut1 and VGlut2 immunolabeling in the VTA agree with previous reports from other brain regions, including the almost exclusive localization to axon terminals (Bellocchio et al., 1998, Fremeau et al., 2001, Kaneko and Fujiyama, 2002, Fujiyama et al., 2003, Commons et al., 2005), the preferential targeting of dendrites as opposed to soma, and the predominance of asymmetric synapses (Fujiyama et al., 2003, Commons et al., 2005). As asymmetric synapses are correlated with an excitatory physiology (Carlin et al., 1980), this observation is consistent with the well-established excitatory functions of glutamate pathways.
Our morphological analyses further suggest that VGlut1+ and VGlut2+ inputs have some distinct characteristics. In particular, the finding of a larger proportion of symmetric synapses formed by VGlut2+ versus VGlut1+ terminals suggests a more complex neurochemistry of putative subcortical versus cortical sources of glutamate drive. The PFC projection, which is assumed to be the largest source of VGlut1+ axons, is considered to be almost exclusively excitatory and to contain only glutamate as a principal neurotransmitter. Nevertheless, PFC projections to the brainstem include a small proportion of axons forming symmetric synapses (Sesack and Pickel, 1992, Jankowski and Sesack, 2004). In contrast, subcortical projections to the VTA that are exclusively glutamatergic have yet to be identified, making it more likely that VGlut2+ axons will contain multiple transmitters and mediate complex physiological actions. One example might be the mesopontine tegmentum, a probable source of VGlut2+ axons. Despite being reported as a prominent glutamate afferent (Lavoie and Parent, 1994a, Charara et al., 1996), this projection reportedly colocalizes the modulatory transmitter acetylcholine (Clements et al., 1991, Lavoie and Parent, 1994b) and mediates a complex postsynaptic action on midbrain neurons (Scarnati et al., 1984, Lokwan et al., 1999).
The current analysis also suggests that the physiological significance of VGlut1+ and VGlut2+ inputs for regulating VTA performance is dissimilar. The qualitative observation of a higher density of VGlut2+ as opposed to VGlut1+ varicosities in the VTA is consistent with one prior report (Jones and Wonnacott, 2004) and suggests that the control mediated by VGlut2+ projections is noticeably stronger in this region. Our data showing that VGlut2 immunoreactive terminals are also larger than those immunoreactive for VGlut1 is consistent with findings from analysis of thalamic nuclei (Fujiyama et al., 2003). As synaptic efficacy has been associated with terminal size (Lisman and Harris, 1993, Pierce and Lewin, 1994), the statistically significant differences reported here lend support to the speculation that VGlut2 containing terminals release transmitter at a higher probability (Varoqui et al., 2002, Fremeau et al., 2004a, Schuske and Jorgensen, 2004). The more proximal terminations of VGlut2+ versus VGlut1+ terminals in the VTA (a similar observation was reported in the dorsal raphe nucleus (Commons et al., 2005)) suggests that the former inputs mediate a stronger influence on cell firing (Lisman and Harris, 1993). Together, the greater density, larger size, and more proximal position indicate that for VTA neurons overall, the regulation provided by VGlut2 immunopositive terminals dominates over the effects of VGlut1+ inputs. Of course, this general relationship may not hold for each individual neuron.
Sources of glutamate drive to the VTA
The identification of all regions that provide glutamate innervation to the VTA is as yet incomplete. Within published studies, the only afferents for which glutamate has been confirmed as a neurotransmitter are the PFC (Christie et al., 1986, Tzschentke and Schmidt, 2000), and the mesopontine tegmentum (Clements and Grant, 1990, Lavoie and Parent, 1994a, Charara et al., 1996, Forster and Blaha, 2000). These two sources of glutamate input exhibit VGlut1 and VGlut2 phenotypes respectively (Ni et al., 1995, Hisano et al., 2000, Herzog et al., 2001, Hisano et al., 2002, Ziegler et al., 2002, Hur and Zaborszky, 2005). Nevertheless, the preliminary studies of Zahm suggest that the midbrain is likely to also receive glutamate innervations from other brain regions (Geisler and Zahm, 2005).
The PFC is likely to remain the primary source of VGlut1+ innervation to the VTA, although some observations suggest that minor VGlut1+ inputs from other brain regions are possible. For example, the current observation of dense-cored vesicles in a number of VGlut1+ terminals suggests a possible non-cortical origin, as dense-cored vesicles are rarely reported in the subcortical projections of the PFC (Sesack and Pickel, 1992, Carr and Sesack, 2000, Jankowski and Sesack, 2004). VGlut1 mRNA has been reported in the lateral hypothalamus (Ziegler et al., 2002, Rosin et al., 2003), which provides an extensive projection to the VTA (Geisler and Zahm, 2005), and cells containing VGlut1 mRNA have also been described in the medial habenula (Ni et al., 1995, Fremeau et al., 2001, Herzog et al., 2001). In the current study, we observed VGlut1+ axons within the fasciculus retroflexus, the major efferent pathway from the medial habenula. Moreover, cells in the lateral hypothalamus (including those expressing VGlut1 mRNA) and neurons of the medial habenula contain the neuropeptides orexin and neurokinins, respectively (Burgunder and Young, 1989, Fadel and Deutch, 2002, Rosin et al., 2003). Nevertheless, it remains to be determined whether hypothalamic neurons that express VGlut1 innervate the VTA, and a direct projection from the medial habenula to the VTA has been particularly difficult to establish with certainty (Geisler and Zahm, 2005).
Based on published studies, it has been presumed that the major source of VGlut2+ axons to the VTA is the mesopontine tegmentum. However, preliminary observations of Geisler et al. (Geisler et al., 2005) challenge this view. First, the number of neurons in that region that express VGlut2 mRNA is limited (see also (Hur and Zaborszky, 2005)). Second, other potential sources of VGlut2 are likely to be more numerous, including the lateral hypothalamus and lateral preoptic area. Additional VGlut2+ inputs may arise from the lateral habenula, periaqueductal gray, and reticular formation (Geisler et al., 2005). Although these data are still preliminary, they are supported by other VGlut2 in situ hybridization studies (Hisano et al., 2000, Fremeau et al., 2001, Ziegler et al., 2002, Rosin et al., 2003, Hur and Zaborszky, 2005) and by tracing experiments (Phillipson, 1979b, Geisler and Zahm, 2005).
In addition to mRNA and protein localization studies, there are some electrophysiological data that support excitatory, possibly glutamatergic, projections to VTA dopamine neurons, such as from the subcommissural bed nucleus of the stria terminalis (Georges and Aston-Jones, 2002), lateral hypothalamus (Maeda and Mogenson, 1981), and superior colliculus (Coizet et al., 2003). However, VGlut2 mRNA has only been localized to the latter two regions and not the subcommissural bed nucleus (Hur and Zaborszky, 2005). Finally, it is possible that some VGlut2+ axons in the VTA originate from local neurons (Omelchenko and Sesack, 2006b) that exhibit VGlut2 mRNA (Dal Bo et al., 2004, Hur and Zaborszky, 2005, Omelchenko and Sesack, 2006b). The fact that we did not observe VGlut2 immunoreactivity in soma and dendrites within the VTA does not contradict this possibility, as many studies report a strictly presynaptic location for VGlut proteins (Bellocchio et al., 1998, Fremeau et al., 2001, Kaneko and Fujiyama, 2002, Fujiyama et al., 2003, Commons et al., 2005) apparently due to immediate trafficking into axons.
Given the large number of potential sources of VGlut2+ projections into the VTA, it is not surprising that the overall density of axons containing this protein is significantly greater than that for VGlut1+ axons. In future studies, it will be essential to complete the identification of all specific brain areas providing glutamate afferents to the VTA in order to elucidate the morphological basis for behavioral control of these neurons.
Comparison of the current findings with previous tract-tracings studies
Tract-tracing from the PFC and LDT (Carr and Sesack, 2000, Omelchenko and Sesack, 2005), coupled with the initial assumption that these would constitute the major sources of VGlut1+ and VGlut2+ axons, respectively, led to the prediction that the immunolabeled axons would show some specificity in the VTA cell populations targeted. Hence, several of the findings of this study were unexpected (Table 2). First, the abundance of VGlut2 compared to VGlut1 immunoreactive synapses in the VTA would not have been predicted based on the relatively comparable density of afferents from the PFC and LDT (Carr and Sesack, 2000, Omelchenko and Sesack, 2005). Second, we did not expect VGlut2+ axons to synapse onto GABA mesoaccumbens neurons, which were not found to be innervated by the LDT (Omelchenko and Sesack, 2005). However, as noted above, there are other possible sources of VGlut2-containing afferents to the VTA which might constitute the origin of these connections. Finally, and perhaps most obviously, tract-tracing from the PFC predicted that DA mesoaccumbens cells would receive little or no VGlut1+ synaptic input, whereas such contacts were clearly noted here. As discussed above, false negatives cannot be completely avoided in studies of this type. Moreover, it is likely that identifying synaptic inputs based on their biochemical characteristics is more effective than using tract-tracing, which typically cannot represent the whole of a pathway. Moreover, there are additional portions of the frontal cortex (e.g. agranular insular, cingulate and orbital regions) that project to the VTA (Geisler and Zahm, 2005) but were not included in the tracer injection sites (Carr and Sesack, 2000). Hence, it is possible that a small input from the PFC to mesoaccumbens DA neurons was missed in the tract-tracing study (Carr and Sesack, 2000). Conversely, the inconsistency may relate to the existence of additional sources of VGlut1+ afferents to the VTA outside the PFC, as described earlier.
Despite these inconsistencies, some predictions from tract-tracing were at least partly confirmed in this study. For example, data suggesting that the PFC does not innervate GABA mesoprefrontal cells (Carr and Sesack, 2000) is consistent with the present finding that VGlut1+ terminals target this population significantly less often than VGlut2+ axons. Moreover, tracing experiments imply that the DA mesoaccumbens population is innervated more strongly by the LDT than the PFC (Carr and Sesack, 2000, Omelchenko and Sesack, 2005). Here, we observed significantly more VGlut2+ then VGlut1+ inputs innervating all mesoaccumbens populations. DA mesoaccumbens cells also received more VGlut2+ than VGlut1+ inputs, although the latter difference was not statistically significant and likely reflects the greater density of VGlut2+ axons overall. Finally, the observation that mesoprefrontal DA cells receive equivalent inputs from VGlut1+ and VGlut2+ axons, when considered in light of the overall greater density of VGlut2+ axons in the VTA, is at least consistent with the important role of PFC inputs in regulating the activity of these cells (Carr and Sesack, 2000).
Functional considerations
Cortical and subcortical glutamate inputs to the ventral midbrain are the principal drivers of burst firing in DA neurons (Grace and Bunney, 1984, Johnson et al., 1992, Overton and Clark, 1992, Chergui et al., 1993, Coizet et al., 2003, Lodge and Grace, 2006) and are involved in eliciting the behaviorally relevant responses to novel and rewarding stimuli (Schultz, 1998, Schultz et al., 1998) that are important for shaping future behavior (Berridge and Robinson, 1998, Redgrave et al., 1999, Morris et al., 2006). Our data regarding the innervation of identified VTA population by both VGlut1+ and VGlut2+ inputs are consistent with the idea that individual VTA neurons integrate extensive sources of information (Geisler and Zahm, 2005) in guiding behavior. Our findings are also consistent with previous anatomical studies indicating that the cerebral cortex sends few projections to the midbrain DA-rich region, with most of these originating from ventral and medial portions of the PFC (Phillipson, 1979a, Naito and Kita, 1994, Chiba et al., 2001, Frankle et al., 2006). The overall greater density of VGlut2+ afferents to the VTA agrees with recent electrophysiological findings emphasizing the shorter latency and greater functional significance of subcortical inputs for VTA regulation (Dommett et al., 2005).
As cortical and subcortical sources of glutamate probably provide distinct information to the VTA, it is likely that the larger contribution of subcortical inputs to the synaptic regulation of mesoaccumbens cells is more important for driving locomotor behavior related to reward. It is also reasonable to speculate that glutamate inputs from subcortical sources convey less processed information related to exteroceptive and interoceptive stimuli. The evident density of these subcortical glutamate afferents to the VTA may explain how natural and artificial rewards acquire such dominance in driving the approach behaviors that are regulated by the VTA. Conversely, glutamate inputs from the cortex are likely to provide more complex management that might be important for suppressing certain behaviors based on the consequences of actions (Bechara et al., 1996) and for discriminating between rewards (Schultz, 2006). The smaller number of these inputs may explain why recognizing the negative consequences of actions may be ultimately insufficient in controlling behavior in the face of powerful natural or artificial rewards.
Acknowledgments
Support was provided by USPHS grant NIMH 067937. The authors gratefully acknowledge the technical contributions of Maureen Walsh, the statistical consulting assistance of Dr. Allan Sampson at the University of Pittsburgh, and the generous supply of antibodies provided by Dr. Robert Edwards at the University of California at San Francisco.
ABBREVIATIONS
- DA
dopamine
- FG
FluoroGold
- LDT
laterodorsal tegmentum
- NAc
nucleus accumbens
- PB
phosphate buffer
- PBS
phosphate buffered saline
- PFC
prefrontal cortex
- TBS
tris-buffered saline
- TH
tyrosine hydroxylase
- VGlut1
vesicular glutamate transporter subtype 1
- VGlut2
vesicular glutamate transporter subtype 2
- VTA
ventral tegmental area
Footnotes
Publisher's Disclaimer: This is a PDF file of an unedited manuscript that has been accepted for publication. As a service to our customers we are providing this early version of the manuscript. The manuscript will undergo copyediting, typesetting, and review of the resulting proof before it is published in its final citable form. Please note that during the production process errors may be discovered which could affect the content, and all legal disclaimers that apply to the journal pertain.
References
- Aston-Jones G, Zhu Y, Card JP. Numerous GABAergic afferents to locus ceruleus in the pericerulear dendritic zone: possible interneuronal pool. J Neurosci. 2004;24:2313–2321. doi: 10.1523/JNEUROSCI.5339-03.2004. [DOI] [PMC free article] [PubMed] [Google Scholar]
- Bai L, Xu H, Collins JF, Ghishan FK. Molecular and functional analysis of a novel neuronal vesicular glutamate transporter. J Biol Chem. 2001;276:36764–36769. doi: 10.1074/jbc.M104578200. [DOI] [PubMed] [Google Scholar]
- Bayer VE, Pickel VM. GABA-labeled terminals form proportionally more synapses with dopaminergic neurons containing low densities of tyrosine hydroxylase-immunoreactivity in rat ventral tegmental area. Brain Res. 1991;559:44–55. doi: 10.1016/0006-8993(91)90285-4. [DOI] [PubMed] [Google Scholar]
- Bechara A, Tranel D, Damasio H, Damasio AR. Failure to respond autonomically to anticipated future outcomes following damage to prefrontal cortex. Cereb Cortex. 1996;6:215–225. doi: 10.1093/cercor/6.2.215. [DOI] [PubMed] [Google Scholar]
- Bellocchio EE, Hu H, Pohorille A, Chan J, Pickel VM, Edwards RH. The localization of the brain-specific inorganic phosphate transporter suggests a specific presynaptic role in glutamatergic transmission. J Neurosci. 1998;18:8648–8659. doi: 10.1523/JNEUROSCI.18-21-08648.1998. [DOI] [PMC free article] [PubMed] [Google Scholar]
- Berridge KC, Robinson TE. What is the role of dopamine in reward: hedonic impact, reward learning, or incentive salience? Brain Res Brain Res Rev. 1998;28:309–306. doi: 10.1016/s0165-0173(98)00019-8. [DOI] [PubMed] [Google Scholar]
- Brozoski T, Brown R, Rosvold H, Goldman P. Cognitive deficit caused by regional depletion of dopamine in prefrontal cortex of rhesus monkey. Science. 1979;205:929–932. doi: 10.1126/science.112679. [DOI] [PubMed] [Google Scholar]
- Burgunder JM, Young WS., 3rd Neurokinin B and substance P genes are co-expressed in a subset of neurons in the rat habenula. Neuropeptides. 1989;13:165–169. doi: 10.1016/0143-4179(89)90087-5. [DOI] [PubMed] [Google Scholar]
- Carlin RK, Grab DJ, Cohen RS, Siekevitz P. Isolation and characterization of postsynaptic densities from various brain regions: enrichment of different types of postsynaptic densities. J Cell Biol. 1980;86:831–843. doi: 10.1083/jcb.86.3.831. [DOI] [PMC free article] [PubMed] [Google Scholar]
- Carr DB, Sesack SR. Projections from the rat prefrontal cortex to the ventral tegmental area: target specificity in the synaptic associations with mesoaccumbens and mesocortical neurons. J Neurosci. 2000;20:3864–3873. doi: 10.1523/JNEUROSCI.20-10-03864.2000. [DOI] [PMC free article] [PubMed] [Google Scholar]
- Charara A, Smith Y, Parent A. Glutamatergic inputs from the pedunculopontine nucleus to midbrain dopaminergic neurons in primates: phaseolus vulgaris-leucoagglutinin anterograde labeling combined with postembedding glutamate and GABA immunohistochemistry. J Comp Neurol. 1996;364:254–266. doi: 10.1002/(SICI)1096-9861(19960108)364:2<254::AID-CNE5>3.0.CO;2-4. [DOI] [PubMed] [Google Scholar]
- Chergui K, Charlety PJ, Akaoka H, Saunier CF, Brunet JL, Buda M, Svensson TH, Chouvet G. Tonic activation of NMDA receptors causes spontaneous burst discharge of rat midbrain dopamine neurons in vivo. Eur J Neurosci. 1993;5:137–144. doi: 10.1111/j.1460-9568.1993.tb00479.x. [DOI] [PubMed] [Google Scholar]
- Chiba T, Kayahara T, Nakano K. Efferent projections of infralimbic and prelimbic areas of the medial prefrontal cortex in the Japanese monkey, Macaca fuscata. Brain Res. 2001;888:83–101. doi: 10.1016/s0006-8993(00)03013-4. [DOI] [PubMed] [Google Scholar]
- Christie MJ, James LB, Beart PM. An excitatory amino acid projection from rat prefrontal cortex to periaqueductal gray. Brain Res Bull. 1986;16:127–129. doi: 10.1016/0361-9230(86)90020-1. [DOI] [PubMed] [Google Scholar]
- Clements JR, Grant S. Glutamate-like immunoreactivity in neurons of the laterodorsal tegmental and pedunculopontine nuclei in the rat. Neurosci Lett. 1990;120:70–73. doi: 10.1016/0304-3940(90)90170-e. [DOI] [PubMed] [Google Scholar]
- Clements JR, Toth DD, Highfield DA, Grant SJ. Glutamate-like immunoreactivity is present within cholinergic neurons of the laterodorsal tegmental and pedunculopontine nuclei. Adv Exp Med Biol. 1991;295:127–142. doi: 10.1007/978-1-4757-0145-6_5. [DOI] [PubMed] [Google Scholar]
- Coizet V, Comoli E, Westby GW, Redgrave P. Phasic activation of substantia nigra and the ventral tegmental area by chemical stimulation of the superior colliculus: an electrophysiological investigation in the rat. Eur J Neurosci. 2003;17:28–40. doi: 10.1046/j.1460-9568.2003.02415.x. [DOI] [PubMed] [Google Scholar]
- Commons KG, Beck SG, Bey VW. Two populations of glutamatergic axons in the rat dorsal raphe nucleus defined by the vesicular glutamate transporters 1 and 2. Eur J Neurosci. 2005;21:1577–1586. doi: 10.1111/j.1460-9568.2005.03991.x. [DOI] [PMC free article] [PubMed] [Google Scholar]
- Dal Bo G, St-Gelais F, Danik M, Williams S, Cotton M, Trudeau LE. Dopamine neurons in culture express VGLUT2 explaining their capacity to release glutamate at synapses in addition to dopamine. J Neurochem. 2004;88:1398–1405. doi: 10.1046/j.1471-4159.2003.02277.x. [DOI] [PubMed] [Google Scholar]
- Danik M, Cassoly E, Manseau F, Sotty F, Mouginot D, Williams S. Frequent coexpression of the vesicular glutamate transporter 1 and 2 genes, as well as coexpression with genes for choline acetyltransferase or glutamic acid decarboxylase in neurons of rat brain. J Neurosci Res. 2005;81:506–521. doi: 10.1002/jnr.20500. [DOI] [PubMed] [Google Scholar]
- Dommett E, Coizet V, Blaha CD, Martindale J, Lefebvre V, Walton N, Mayhew JE, Overton PG, Redgrave P. How visual stimuli activate dopaminergic neurons at short latency. Science. 2005;307:1476–1479. doi: 10.1126/science.1107026. [DOI] [PubMed] [Google Scholar]
- Fadel J, Deutch AY. Anatomical substrates of orexin-dopamine interactions: lateral hypothalamic projections to the ventral tegmental area. Neuroscience. 2002;111:379–387. doi: 10.1016/s0306-4522(02)00017-9. [DOI] [PubMed] [Google Scholar]
- Forster GL, Blaha CD. Laterodorsal tegmental stimulation elicits dopamine efflux in the rat nucleus accumbens by activation of acetylcholine and glutamate receptors in the ventral tegmental area. Eur J Neurosci. 2000;12:3596–3604. doi: 10.1046/j.1460-9568.2000.00250.x. [DOI] [PubMed] [Google Scholar]
- Frankle WG, Laruelle M, Haber SN. Prefrontal cortical projections to the midbrain in primates: evidence for a sparse connection. Neuropsychopharmacology. 2006;31:1627–1636. doi: 10.1038/sj.npp.1300990. [DOI] [PubMed] [Google Scholar]
- Fremeau RT, Jr, Burman J, Qureshi T, Tran CH, Proctor J, Johnson J, Zhang H, Sulzer D, Copenhagen DR, Storm-Mathisen J, Reimer RJ, Chaudhry FA, Edwards RH. The identification of vesicular glutamate transporter 3 suggests novel modes of signaling by glutamate. Proc Natl Acad Sci U S A. 2002;99:14488–14493. doi: 10.1073/pnas.222546799. [DOI] [PMC free article] [PubMed] [Google Scholar]
- Fremeau RT, Jr, Kam K, Qureshi T, Johnson J, Copenhagen DR, Storm-Mathisen J, Chaudhry FA, Nicoll RA, Edwards RH. Vesicular glutamate transporters 1 and 2 target to functionally distinct synaptic release sites. Science. 2004a;304:1815–1819. doi: 10.1126/science.1097468. [DOI] [PubMed] [Google Scholar]
- Fremeau RT, Jr, Troyer MD, Pahner I, Nygaard GO, Tran CH, Reimer RJ, Bellocchio EE, Fortin D, Storm-Mathisen J, Edwards RH. The expression of vesicular glutamate transporters defines two classes of excitatory synapse. Neuron. 2001;31:247–260. doi: 10.1016/s0896-6273(01)00344-0. [DOI] [PubMed] [Google Scholar]
- Fremeau RT, Jr, Voglmaier S, Seal RP, Edwards RH. VGLUTs define subsets of excitatory neurons and suggest novel roles for glutamate. Trends Neurosci. 2004b;27:98–103. doi: 10.1016/j.tins.2003.11.005. [DOI] [PubMed] [Google Scholar]
- Fujiyama F, Hioki H, Tomioka R, Taki K, Tamamaki N, Nomura S, Okamoto K, Kaneko T. Changes of immunocytochemical localization of vesicular glutamate transporters in the rat visual system after the retinofugal denervation. J Comp Neurol. 2003;465:234–249. doi: 10.1002/cne.10848. [DOI] [PubMed] [Google Scholar]
- Geisler S, Derst C, Gautam M, Veh RW, Zahm DS. Glutamatergic afferents of the ventral tegmental area in rat. Soc Neurosci Abstr. 2005:Program No. 517.11. doi: 10.1523/JNEUROSCI.0012-07.2007. [DOI] [PMC free article] [PubMed] [Google Scholar]
- Geisler S, Zahm DS. Afferents of the ventral tegmental area in the rat-anatomical substratum for integrative functions. J Comp Neurol. 2005;490:270–294. doi: 10.1002/cne.20668. [DOI] [PubMed] [Google Scholar]
- Georges F, Aston-Jones G. Activation of ventral tegmental area cells by the bed nucleus of the stria terminalis: a novel excitatory amino acid input to midbrain dopamine neurons. J Neurosci. 2002;22:5173–5187. doi: 10.1523/JNEUROSCI.22-12-05173.2002. [DOI] [PMC free article] [PubMed] [Google Scholar]
- Grace AA, Bunney BS. The control of firing pattern in nigral dopamine neurons: burst firing. J Neurosci. 1984;4:2877–2890. doi: 10.1523/JNEUROSCI.04-11-02877.1984. [DOI] [PMC free article] [PubMed] [Google Scholar]
- Gras C, Herzog E, Bellenchi GC, Bernard V, Ravassard P, Pohl M, Gasnier B, Giros B, El Mestikawy S. A third vesicular glutamate transporter expressed by cholinergic and serotoninergic neurons. J Neurosci. 2002;22:5442–5451. doi: 10.1523/JNEUROSCI.22-13-05442.2002. [DOI] [PMC free article] [PubMed] [Google Scholar]
- Herzog E, Bellenchi GC, Gras C, Bernard V, Ravassard P, Bedet C, Gasnier B, Giros B, El Mestikawy S. The existence of a second vesicular glutamate transporter specifies subpopulations of glutamatergic neurons. J Neurosci. 2001;21:RC181. doi: 10.1523/JNEUROSCI.21-22-j0001.2001. [DOI] [PMC free article] [PubMed] [Google Scholar]
- Herzog E, Gilchrist J, Gras C, Muzerelle A, Ravassard P, Giros B, Gaspar P, El Mestikawy S. Localization of VGLUT3, the vesicular glutamate transporter type 3, in the rat brain. Neuroscience. 2004;123:983–1002. doi: 10.1016/j.neuroscience.2003.10.039. [DOI] [PubMed] [Google Scholar]
- Hisano S, Hoshi K, Ikeda Y, Maruyama D, Kanemoto M, Ichijo H, Kojima I, Takeda J, Nogami H. Regional expression of a gene encoding a neuron-specific Na(+)-dependent inorganic phosphate cotransporter (DNPI) in the rat forebrain. Brain Res Mol Brain Res. 2000;83:34–43. doi: 10.1016/s0169-328x(00)00194-7. [DOI] [PubMed] [Google Scholar]
- Hisano S, Sawada K, Kawano M, Kanemoto M, Xiong G, Mogi K, Sakata-Haga H, Takeda J, Fukui Y, Nogami H. Expression of inorganic phosphate/vesicular glutamate transporters (BNPI/VGLUT1 and DNPI/VGLUT2) in the cerebellum and precerebellar nuclei of the rat. Brain Res Mol Brain Res. 2002;107:23–31. doi: 10.1016/s0169-328x(02)00442-4. [DOI] [PubMed] [Google Scholar]
- Hsu JC. Multiple Comparisons: Theory and Methods. Chapman and Hall; London: 1996. [Google Scholar]
- Hur EE, Zaborszky L. Vglut2 afferents to the medial prefrontal and primary somatosensory cortices: a combined retrograde tracing in situ hybridization. J Comp Neurol. 2005;483:351–373. doi: 10.1002/cne.20444. [DOI] [PubMed] [Google Scholar]
- Jankowski MP, Sesack SR. Prefrontal cortical projections to the rat dorsal raphe nucleus: ultrastructural features and associations with serotonin and gamma-aminobutyric acid neurons. J Comp Neurol. 2004;468:518–529. doi: 10.1002/cne.10976. [DOI] [PubMed] [Google Scholar]
- Johnson SW, Seutin V, North RA. Burst firing in dopamine neurons induced by N-methyl-D-aspartate: role of electrogenic sodium pump. Science. 1992;258:665–667. doi: 10.1126/science.1329209. [DOI] [PubMed] [Google Scholar]
- Jones IW, Wonnacott S. Precise localization of alpha7 nicotinic acetylcholine receptors on glutamatergic axon terminals in the rat ventral tegmental area. J Neurosci. 2004;24:11244–11252. doi: 10.1523/JNEUROSCI.3009-04.2004. [DOI] [PMC free article] [PubMed] [Google Scholar]
- Kaneko T, Fujiyama F. Complementary distribution of vesicular glutamate transporters in the central nervous system. Neurosci Res. 2002;42:243–250. doi: 10.1016/s0168-0102(02)00009-3. [DOI] [PubMed] [Google Scholar]
- Koob GF. Hedonic valence, dopamine and motivation. Mol Psychiatry. 1996;1:186–189. [PubMed] [Google Scholar]
- Krettek JE, Price JL. The cortical projections of the mediodorsal nucleus and adjacent thalamic nuclei in the rat. J Comp Neurol. 1977;171:157–191. doi: 10.1002/cne.901710204. [DOI] [PubMed] [Google Scholar]
- Kutner MH, Nachtsheim CJ, Neter J, Li W. Applied Linear Statistical Models. McGraw-Hill/Irwin; 2005. [Google Scholar]
- Lavoie B, Parent A. Pedunculopontine nucleus in the squirrel monkey: cholinergic and glutamatergic projections to the substantia nigra. J Comp Neurol. 1994a;344:232–241. doi: 10.1002/cne.903440205. [DOI] [PubMed] [Google Scholar]
- Lavoie B, Parent A. Pedunculopontine nucleus in the squirrel monkey: distribution of cholinergic and monoaminergic neurons in the mesopontine tegmentum with evidence for the presence of glutamate in cholinergic neurons. J Comp Neurol. 1994b;344:190–209. doi: 10.1002/cne.903440203. [DOI] [PubMed] [Google Scholar]
- Lee RY, Sawin ER, Chalfie M, Horvitz HR, Avery L. EAT-4, a homolog of a mammalian sodium-dependent inorganic phosphate cotransporter, is necessary for glutamatergic neurotransmission in Caenorhabditis elegans. J Neurosci. 1999;19:159–167. doi: 10.1523/JNEUROSCI.19-01-00159.1999. [DOI] [PMC free article] [PubMed] [Google Scholar]
- Lisman JE, Harris KM. Quantal analysis and synaptic anatomy--integrating two views of hippocampal plasticity. Trends Neurosci. 1993;16:141–147. doi: 10.1016/0166-2236(93)90122-3. [DOI] [PubMed] [Google Scholar]
- Littell RC, Milliken GA, Stroup WW, Wolfinger RD, Schabenberger O. SAS for Mixed Models. SAS Institute Inc; Cary, NC: 2006. [Google Scholar]
- Lodge DJ, Grace AA. The laterodorsal tegmentum is essential for burst firing of ventral tegmental area dopamine neurons. Proc Natl Acad Sci U S A. 2006;103:5167–5172. doi: 10.1073/pnas.0510715103. [DOI] [PMC free article] [PubMed] [Google Scholar]
- Lokwan SJ, Overton PG, Berry MS, Clark D. Stimulation of the pedunculopontine tegmental nucleus in the rat produces burst firing in A9 dopaminergic neurons. Neuroscience. 1999;92:245–254. doi: 10.1016/s0306-4522(98)00748-9. [DOI] [PubMed] [Google Scholar]
- Maeda H, Mogenson GJ. A comparison of the effects of electrical stimulation of the lateral and ventromedial hypothalamus on the activity of neurons in the ventral tegmental area and substantia nigra. Brain Res Bull. 1981;7:283–291. doi: 10.1016/0361-9230(81)90020-4. [DOI] [PubMed] [Google Scholar]
- Matthews DE, Farewell VT. Using and Understanding Medical Statistics. Basel; Karger: 1996. Fisher's test for 2×2 contigency tables. [Google Scholar]
- Morris G, Nevet A, Arkadir D, Vaadia E, Bergman H. Midbrain dopamine neurons encode decisions for future action. Nat Neurosci. 2006;9:1057–1063. doi: 10.1038/nn1743. [DOI] [PubMed] [Google Scholar]
- Naito A, Kita H. The cortico-nigral projection in the rat: an anterograde tracing study with biotinylated dextran amine. Brain Res. 1994;637:317–322. doi: 10.1016/0006-8993(94)91252-1. [DOI] [PubMed] [Google Scholar]
- Ni B, Wu X, Yan GM, Wang J, Paul SM. Regional expression and cellular localization of the Na(+)-dependent inorganic phosphate cotransporter of rat brain. J Neurosci. 1995;15:5789–5799. doi: 10.1523/JNEUROSCI.15-08-05789.1995. [DOI] [PMC free article] [PubMed] [Google Scholar]
- Omelchenko N, Sesack SR. Laterodorsal tegmental projections to identified cell populations in the rat ventral tegmental area. J Comp Neurol. 2005;483:217–235. doi: 10.1002/cne.20417. [DOI] [PubMed] [Google Scholar]
- Omelchenko N, Sesack SR. Cholinergic Axons in the Rat Ventral Tegmental Area Synapse Preferentially onto Mesoaccumbens Dopamine Neurons. J Comp Neurol. 2006a;494:863–875. doi: 10.1002/cne.20852. [DOI] [PMC free article] [PubMed] [Google Scholar]
- Omelchenko N, Sesack SR. Ultrastructural evidence that non-dopamine cells in the rat ventral tegmental area synapse locally onto dopamine and GABA neurons. Soc Neurosci Abstr. 2006b:722, 712. [Google Scholar]
- Overton P, Clark D. Iontophoretically administered drugs acting at the N-methyl-D-aspartate receptor modulate burst firing in A9 dopamine neurons in the rat. Synapse. 1992;10:131–140. doi: 10.1002/syn.890100208. [DOI] [PubMed] [Google Scholar]
- Paxinos G, Watson C. The Rat Brain in Stereotaxic Coordinates. Academic Press; San Diego: 1998. [Google Scholar]
- Peters A, Palay SL, Webster H. The Fine Structure of the Nervous System: Neurons and Their Supporting Cells. Oxford; New York: 1991. [Google Scholar]
- Phillipson OT. Afferent projections to the ventral tegmental area of Tsai and interfascicular nucleus: a horseradish peroxidase study in the rat. J Comp Neurol. 1979a;187:117–143. doi: 10.1002/cne.901870108. [DOI] [PubMed] [Google Scholar]
- Phillipson OT. The cytoarchitecture of the interfascicular nucleus and ventral tegmental area of Tsai in the rat. J Comp Neurol. 1979b;187:85–98. doi: 10.1002/cne.901870106. [DOI] [PubMed] [Google Scholar]
- Pierce JP, Lewin GR. An ultrastructural size principle. Neuroscience. 1994;58:441–446. doi: 10.1016/0306-4522(94)90071-x. [DOI] [PubMed] [Google Scholar]
- Redgrave P, Prescott TJ, Gurney K. Is the short-latency dopamine response too short to signal reward error? Trends Neurosci. 1999;22:146–151. doi: 10.1016/s0166-2236(98)01373-3. [DOI] [PubMed] [Google Scholar]
- Rosin DL, Weston MC, Sevigny CP, Stornetta RL, Guyenet PG. Hypothalamic orexin (hypocretin) neurons express vesicular glutamate transporters VGLUT1 or VGLUT2. J Comp Neurol. 2003;465:593–603. doi: 10.1002/cne.10860. [DOI] [PubMed] [Google Scholar]
- Sawaguchi T, Goldman-Rakic PS. The role of D1-dopamine receptor in working memory: local injections of dopamine antagonists into the prefrontal cortex of rhesus monkeys performing an oculomotor delayed-response task. J Neurophysiol. 1994;71:515–528. doi: 10.1152/jn.1994.71.2.515. [DOI] [PubMed] [Google Scholar]
- Scarnati E, Campana E, Pacitti C. Pedunculopontine-evoked excitation of substantia nigra neurons in the rat. Brain Res. 1984;304:351–361. doi: 10.1016/0006-8993(84)90339-1. [DOI] [PubMed] [Google Scholar]
- Schmued LC, Kyriakidis K, Fallon JH, Ribak CE. Neurons containing retrogradely transported Fluoro-Gold exhibit a variety of lysosomal profiles: a combined brightfield, fluorescence, and electron microscopic study. J Neurocytol. 1989;18:333–343. doi: 10.1007/BF01190836. [DOI] [PubMed] [Google Scholar]
- Schultz W. Predictive reward signal of dopamine neurons. J Neurophysiol. 1998;80:1–27. doi: 10.1152/jn.1998.80.1.1. [DOI] [PubMed] [Google Scholar]
- Schultz W. Behavioral theories and the neurophysiology of reward. Annu Rev Psychol. 2006;57:87–115. doi: 10.1146/annurev.psych.56.091103.070229. [DOI] [PubMed] [Google Scholar]
- Schultz W, Tremblay L, Hollerman JR. Reward prediction in primate basal ganglia and frontal cortex. Neuropharmacology. 1998;37:421–429. doi: 10.1016/s0028-3908(98)00071-9. [DOI] [PubMed] [Google Scholar]
- Schuske K, Jorgensen EM. Neuroscience. Vesicular glutamate transporter--shooting blanks. Science. 2004;304:1750–1752. doi: 10.1126/science.1100475. [DOI] [PubMed] [Google Scholar]
- Sesack SR, Pickel VM. Prefrontal cortical efferents in the rat synapse on unlabeled neuronal targets of catecholamine terminals in the nucleus accumbens septi and on dopamine neurons in the ventral tegmental area. J Comp Neurol. 1992;320:145–160. doi: 10.1002/cne.903200202. [DOI] [PubMed] [Google Scholar]
- Sesack SR, Snyder CL, Lewis DA. Axon terminals immunolabeled for dopamine or tyrosine hydroxylase synapse on GABA-immunoreactive dendrites in rat and monkey cortex. J Comp Neurol. 1995;363:264–280. doi: 10.1002/cne.903630208. [DOI] [PubMed] [Google Scholar]
- Stornetta RL, Sevigny CP, Guyenet PG. Vesicular glutamate transporter DNPI/VGLUT2 mRNA is present in C1 and several other groups of brainstem catecholaminergic neurons. J Comp Neurol. 2002;444:191–206. doi: 10.1002/cne.10141. [DOI] [PubMed] [Google Scholar]
- Takamori S, Rhee JS, Rosenmund C, Jahn R. Identification of a vesicular glutamate transporter that defines a glutamatergic phenotype in neurons. Nature. 2000;407:189–194. doi: 10.1038/35025070. [DOI] [PubMed] [Google Scholar]
- Tzschentke TM, Schmidt WJ. Functional relationship among medial prefrontal cortex, nucleus accumbens, and ventral tegmental area in locomotion and reward. Crit Rev Neurobiol. 2000;14:131–142. [PubMed] [Google Scholar]
- Van Bockstaele EJ, Pickel VM. GABA-containing neurons in the ventral tegmental area project to the nucleus accumbens in rat brain. Brain Res. 1995;682:215–221. doi: 10.1016/0006-8993(95)00334-m. [DOI] [PubMed] [Google Scholar]
- Varoqui H, Schafer MK, Zhu H, Weihe E, Erickson JD. Identification of the differentiation-associated Na+/PI transporter as a novel vesicular glutamate transporter expressed in a distinct set of glutamatergic synapses. J Neurosci. 2002;22:142–155. doi: 10.1523/JNEUROSCI.22-01-00142.2002. [DOI] [PMC free article] [PubMed] [Google Scholar]
- Veznedaroglu E, Milner TA. Elimination of artifactual labeling of hippocampal mossy fibers seen following pre-embedding immunogold-silver technique by pretreatment with zinc chelator. Microsc Res Tech. 1992;23:100–101. doi: 10.1002/jemt.1070230110. [DOI] [PubMed] [Google Scholar]
- Waagepetersen HS, Sonnewald U, Schousboe A. The GABA paradox: multiple roles as metabolite, neurotransmitter, and neurodifferentiative agent. J Neurochem. 1999;73:1335–1342. doi: 10.1046/j.1471-4159.1999.0731335.x. [DOI] [PubMed] [Google Scholar]
- Waselus M, Valentino RJ, Van Bockstaele EJ. Ultrastructural evidence for a role of gamma-aminobutyric acid in mediating the effects of corticotropin-releasing factor on the rat dorsal raphe serotonin system. J Comp Neurol. 2005;482:155–165. doi: 10.1002/cne.20360. [DOI] [PubMed] [Google Scholar]
- Ziegler DR, Cullinan WE, Herman JP. Distribution of vesicular glutamate transporter mRNA in rat hypothalamus. J Comp Neurol. 2002;448:217–229. doi: 10.1002/cne.10257. [DOI] [PubMed] [Google Scholar]